
Square
Following
Hot
News
Notifications
Profile
Share your thoughts
placeholder
Article
Markets are closed on the weekend, but the real action happens in the first half hour after Monday’s open. If you’ve got a checklist, you won’t panic. Sector rotation is really just hot money changing seats—the names everyone chased last week may have to make room this week. The thinnest liquidity comes in the early morning, and that’s when the nastiest wicks hit. I’m often up watching charts until 3 a.m., then I make it through the next day on strong coffee. The answers are hidden in the details. Which sector do you check first when the market opens Monday? I start by looking at where the mon
post-image
  • 2
  • 2
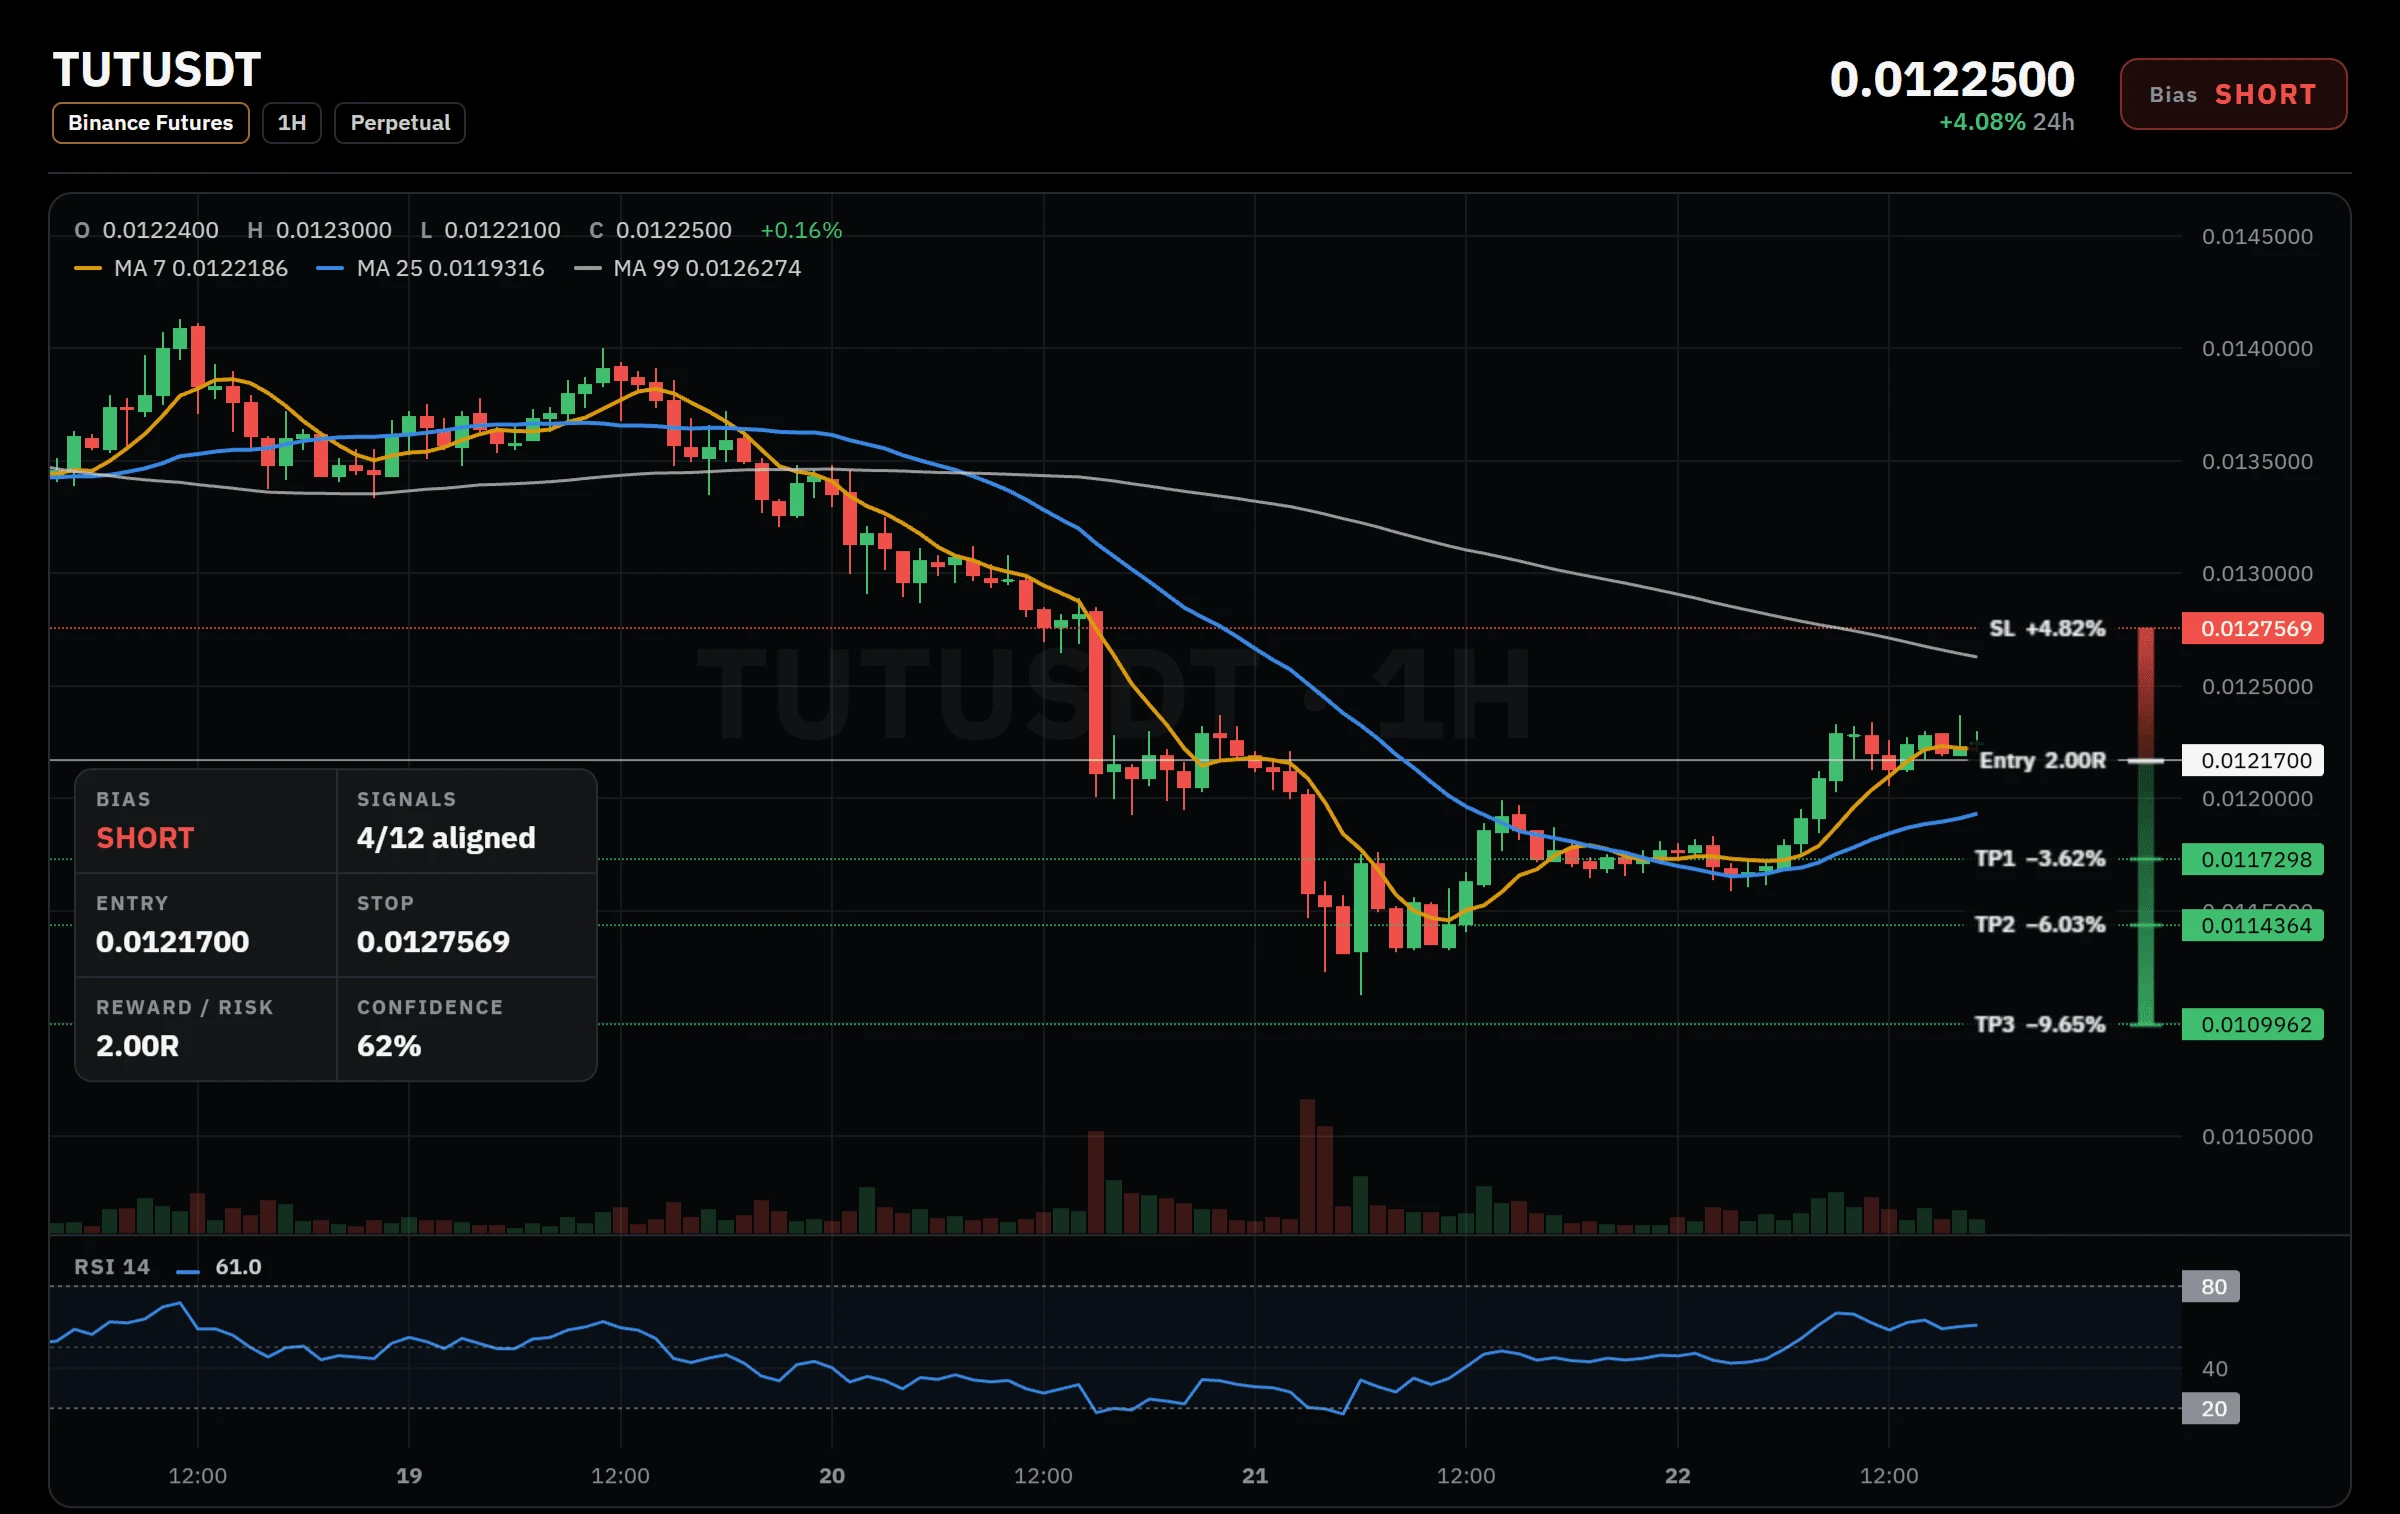
$TUT /USDT SHORT SETUP MOMENTUM CONFLICT

$TUT /USDT

Direction: SHORT

Entry: 0.0121700

Stop Loss: 0.0127569

Targets
TP1: 0.0117298
TP2: 0.0114364
TP3: 0.0109962

$TUT ‌
post-image
TUT-1.66%
Trenches
PIEVERSE
P
bade
b
PIEVERSE
0x0e...25a9
Market Cap
$
Change
.
24h Vol
$.
Holders
.
IDOL
I
bade
b
IDOL
0x3b...ab07
Market Cap
$.
Change
.
24h Vol
$.
Holders
.
JAGENT
J
bade
b
JAGENT
0x8e...ae15
Market Cap
$.
Change
.
24h Vol
$.
Holders
.
mihao
m
bade
b
mihao
4Cxj...pump
Market Cap
$.
Change
.
24h Vol
$.
Holders
.
CATE
C
bade
b
CATE
Ai66...pump
Market Cap
$.
Change
.
24h Vol
$.
Holders
.
Musk says AI5 will go to Optimus first, while cars will keep using AI4 because it’s “enough for superhuman driving.” But the real logic is the opposite: the chip isn’t underpowered; cars have no competition, so there’s no need to pile on more compute. As Old Xu put it, the automotive business has entered a defensive phase, and computing power is being redirected toward robots. If you own Tesla stock, the question you should be asking isn’t how powerful the chip is, but what year Optimus will ship. What do you think?
post-image
TSLA-7.56%
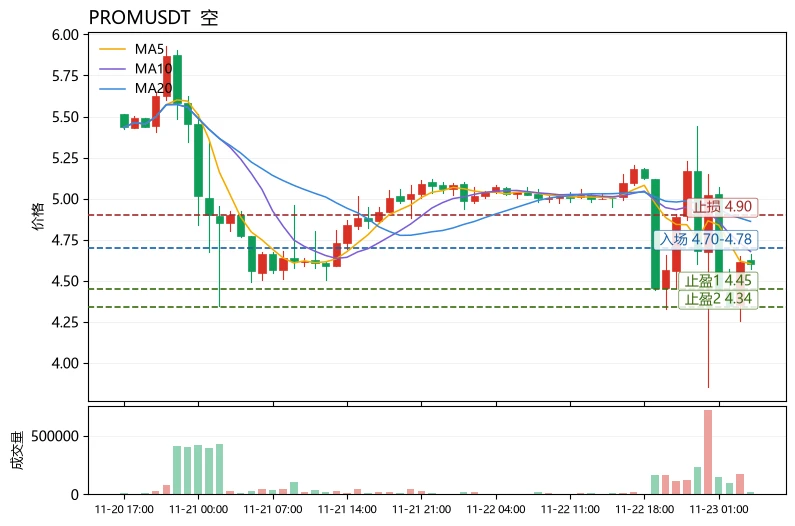
$PROM Current price: 4.604; first resistance above: 4.8616 (MA20); first support below: 4.34 (lower Bollinger Band). Price is hugging the lower Bollinger Band, with MA5 overlapping the current price and far below MA20. The moving averages are bearishly aligned, and the MACD histogram at -0.0411 remains below the zero line, indicating insufficient rebound momentum. However, RSI at 44.7 is not oversold, the funding rate of -0.0123% shows shorts are paying and a short squeeze risk exists, while the extreme fear reading of 11 on the Fear and Greed Index also means the risk-reward for chasing shor
post-image
PROM+0.45%
DOGE-0.22%
SUI-1.05%
Live trading session, starting with a $100 capital
live-cover
LIVE50
BTC-0.67%
ETH-1.26%
China just reversed its own leverage rule from January.
On November 30, the margin requirement for buying stocks with borrowed money drops from 100% back to 80%.
Taiwan, after its worst week in 35 years, is weighing a cut to its margin maintenance ratio from 130% to 120%.
Two different markets, same move, guys. Both make it easier to buy stocks with borrowed money, right?
Would you buy Asia here on leverage?
post-image
The Nasdaq fell 10% in a week, and Nvidia closed at a one-year low!
After a week of sharp declines, those rushing to buy the dip are the first to get wiped out!
#BTC #NVDA$NVDA
NVDA-13.84%
BTC-0.67%
  • 2
  • 1
The bears are still grinding out a bottom. Until a genuine reversal candlestick appears, don't rush to catch a falling knife.
$IRYS I'm choosing to short this trade.
Entry range: 0.01906 - 0.01916
Targets: 0.01818 / 0.01744
Invalidation level: 0.01973
Note: RSI is already oversold, so a mean-reversion bounce after a sharp drop could happen at any time. Don't let your guard down.
Never go all in, guys. Size your positions according to what your account can handle.
Risk warning: The above is only a personal trading idea and does not constitute investment advice. Contract trading involves extrem
post-image
IRYS-22.27%
Only 6 strong signals this round: AKE, EVAA, IDOL; 2 longs and 4 shorts. First watch volume and structure, then act. Last round: 4 wins, 1 loss, +16.6%. TAO and APT are in the red; the 15 positions currently held are up an average of +2.0%. Steady pace, no rush to declare a winner or loser. 🎯 Last round's returns: TAO entry $189.6700 → exit $189.6700, 5.0x leverage, gained +3.4%; APT entry $0.3817 → exit $0.3794, 5.0x leverage, gained +3.0%━━━ Market View ━━━BTC $60,709, +0.6%. Bearish signals are more concentrated; negative funding rate data is temporarily unavailable, and funds are still ch
post-image
AKE+6.39%
EVAA-0.42%
IDOL-7.01%
ACE-4.27%
BULLA+10.92%
Yesterday at the market, I saw two baskets of identical oranges, one priced at three yuan and the other at one yuan fifty. Only when I got closer did I realize that half the cheap ones were rotten underneath. $AKE Today’s price action is a bit like that basket of cheap oranges.
Compare it with the coins that were climbing slowly a few days ago.
Price gains. $AKE In 24 hours, it plunged from 0.0055 to 0.0028, down 46%—a free fall after people let go near the top. The slow climbers move up three to five points a day, and only looking back do you realize they’ve come a long way. One falls down; t
AKE+6.07%
  • 3
  • 2
$KORU No way 🥺, bro, the funding rate is so high—are you trying to kill me? 😭😭😭
post-image
KORU-1.22%
Global stock markets post their longest losing streak in three years as investor risk aversion rises $BTC
post-image
BTC-0.67%
🚨 All eyes are now on Monday’s open. This AI sell-off has swept across the globe, wiping out more than $9 trillion in global stock market value since August. The S&P 500 alone has lost $6 trillion in five days. So what will happen on Monday? History offers a 50/50 answer: 1. October 1987: The S&P 500 fell 20.5% in a single day, in what was then Black Monday 2. September 2001, after 9/11: The S&P 500 rose 3.9% 3. October 2008, the Lehman Brothers collapse: The S&P 500 fell 3.9%, then surged 11.6% the following Monday 4. March 2020, the COVID-19 pandemic: The S&P 500 fell 12.0% 5. April 2025, t
post-image
SPCX+0.78%
#PCEAndGDPDataNextWeek

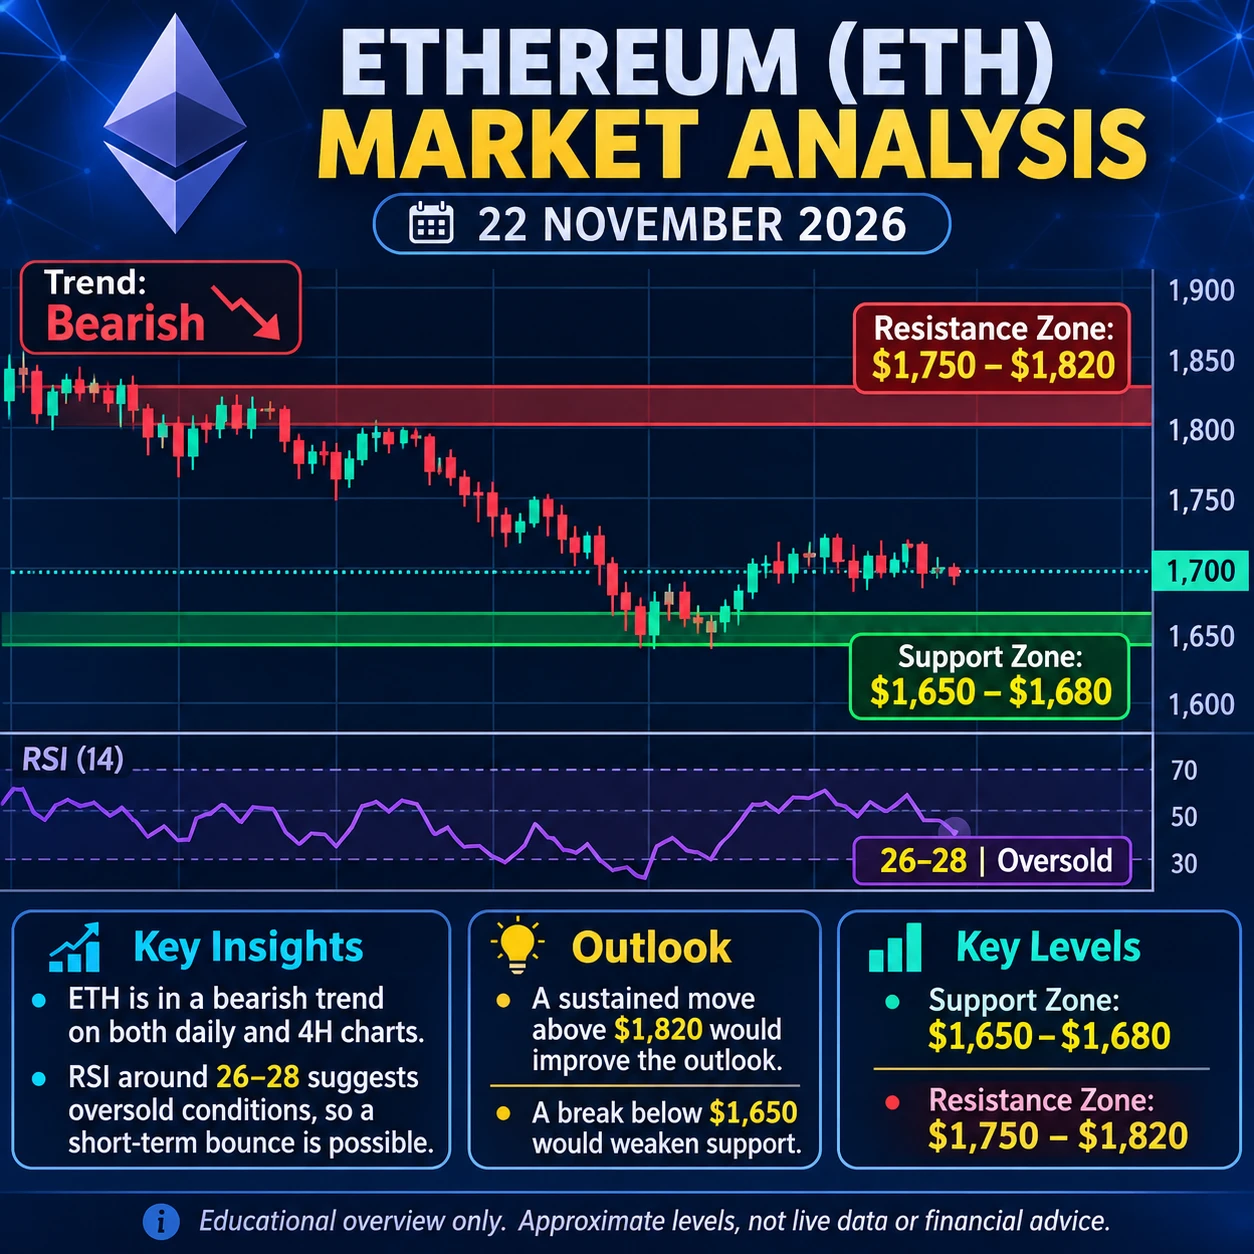
(ETH) Technical Analysis

22 November 2026 | ETH/USD

1\. Market Overview

Ethereum is showing a bearish market structure on both the daily and 4-hour charts. The price is trading around the $1,700 area, although prices vary across market data sources.

2\. Key Support and Resistance

| Level | Price |
| ----------------- | ------------- |
| Resistance 2 | $1,820 |
| Resistance 1 | $1,750 |
| Current reference | $1,700 |
| Support 1 | $1,680–$1,650 |
| Support 2 | $1,575 |

3\. Technical Indicato
post-image
QCOM-0.02%
LLY-0.36%
ETH-1.23%
  • 11
  • 1
$BLESS Up 29.7% over the past 24 hours, contract trading volume reached 331.35 million USDT, and the current price is 0.016581, with 11.3% upside remaining to the 24-hour high of 0.018687. For bulls to open up a new leg higher, they must first reclaim 0.018687; 0.011809 below is a key support level to watch closely. On the 1-hour chart, the price is trading above the 21 EMA, with the RSI near 61, so short-term momentum remains intact. However, there is currently no clear entry setup, so it is best to wait for a confirmed candlestick pattern before acting. Can buyers push the price to new highs
post-image
EVAA-0.49%
BULLA+10.92%
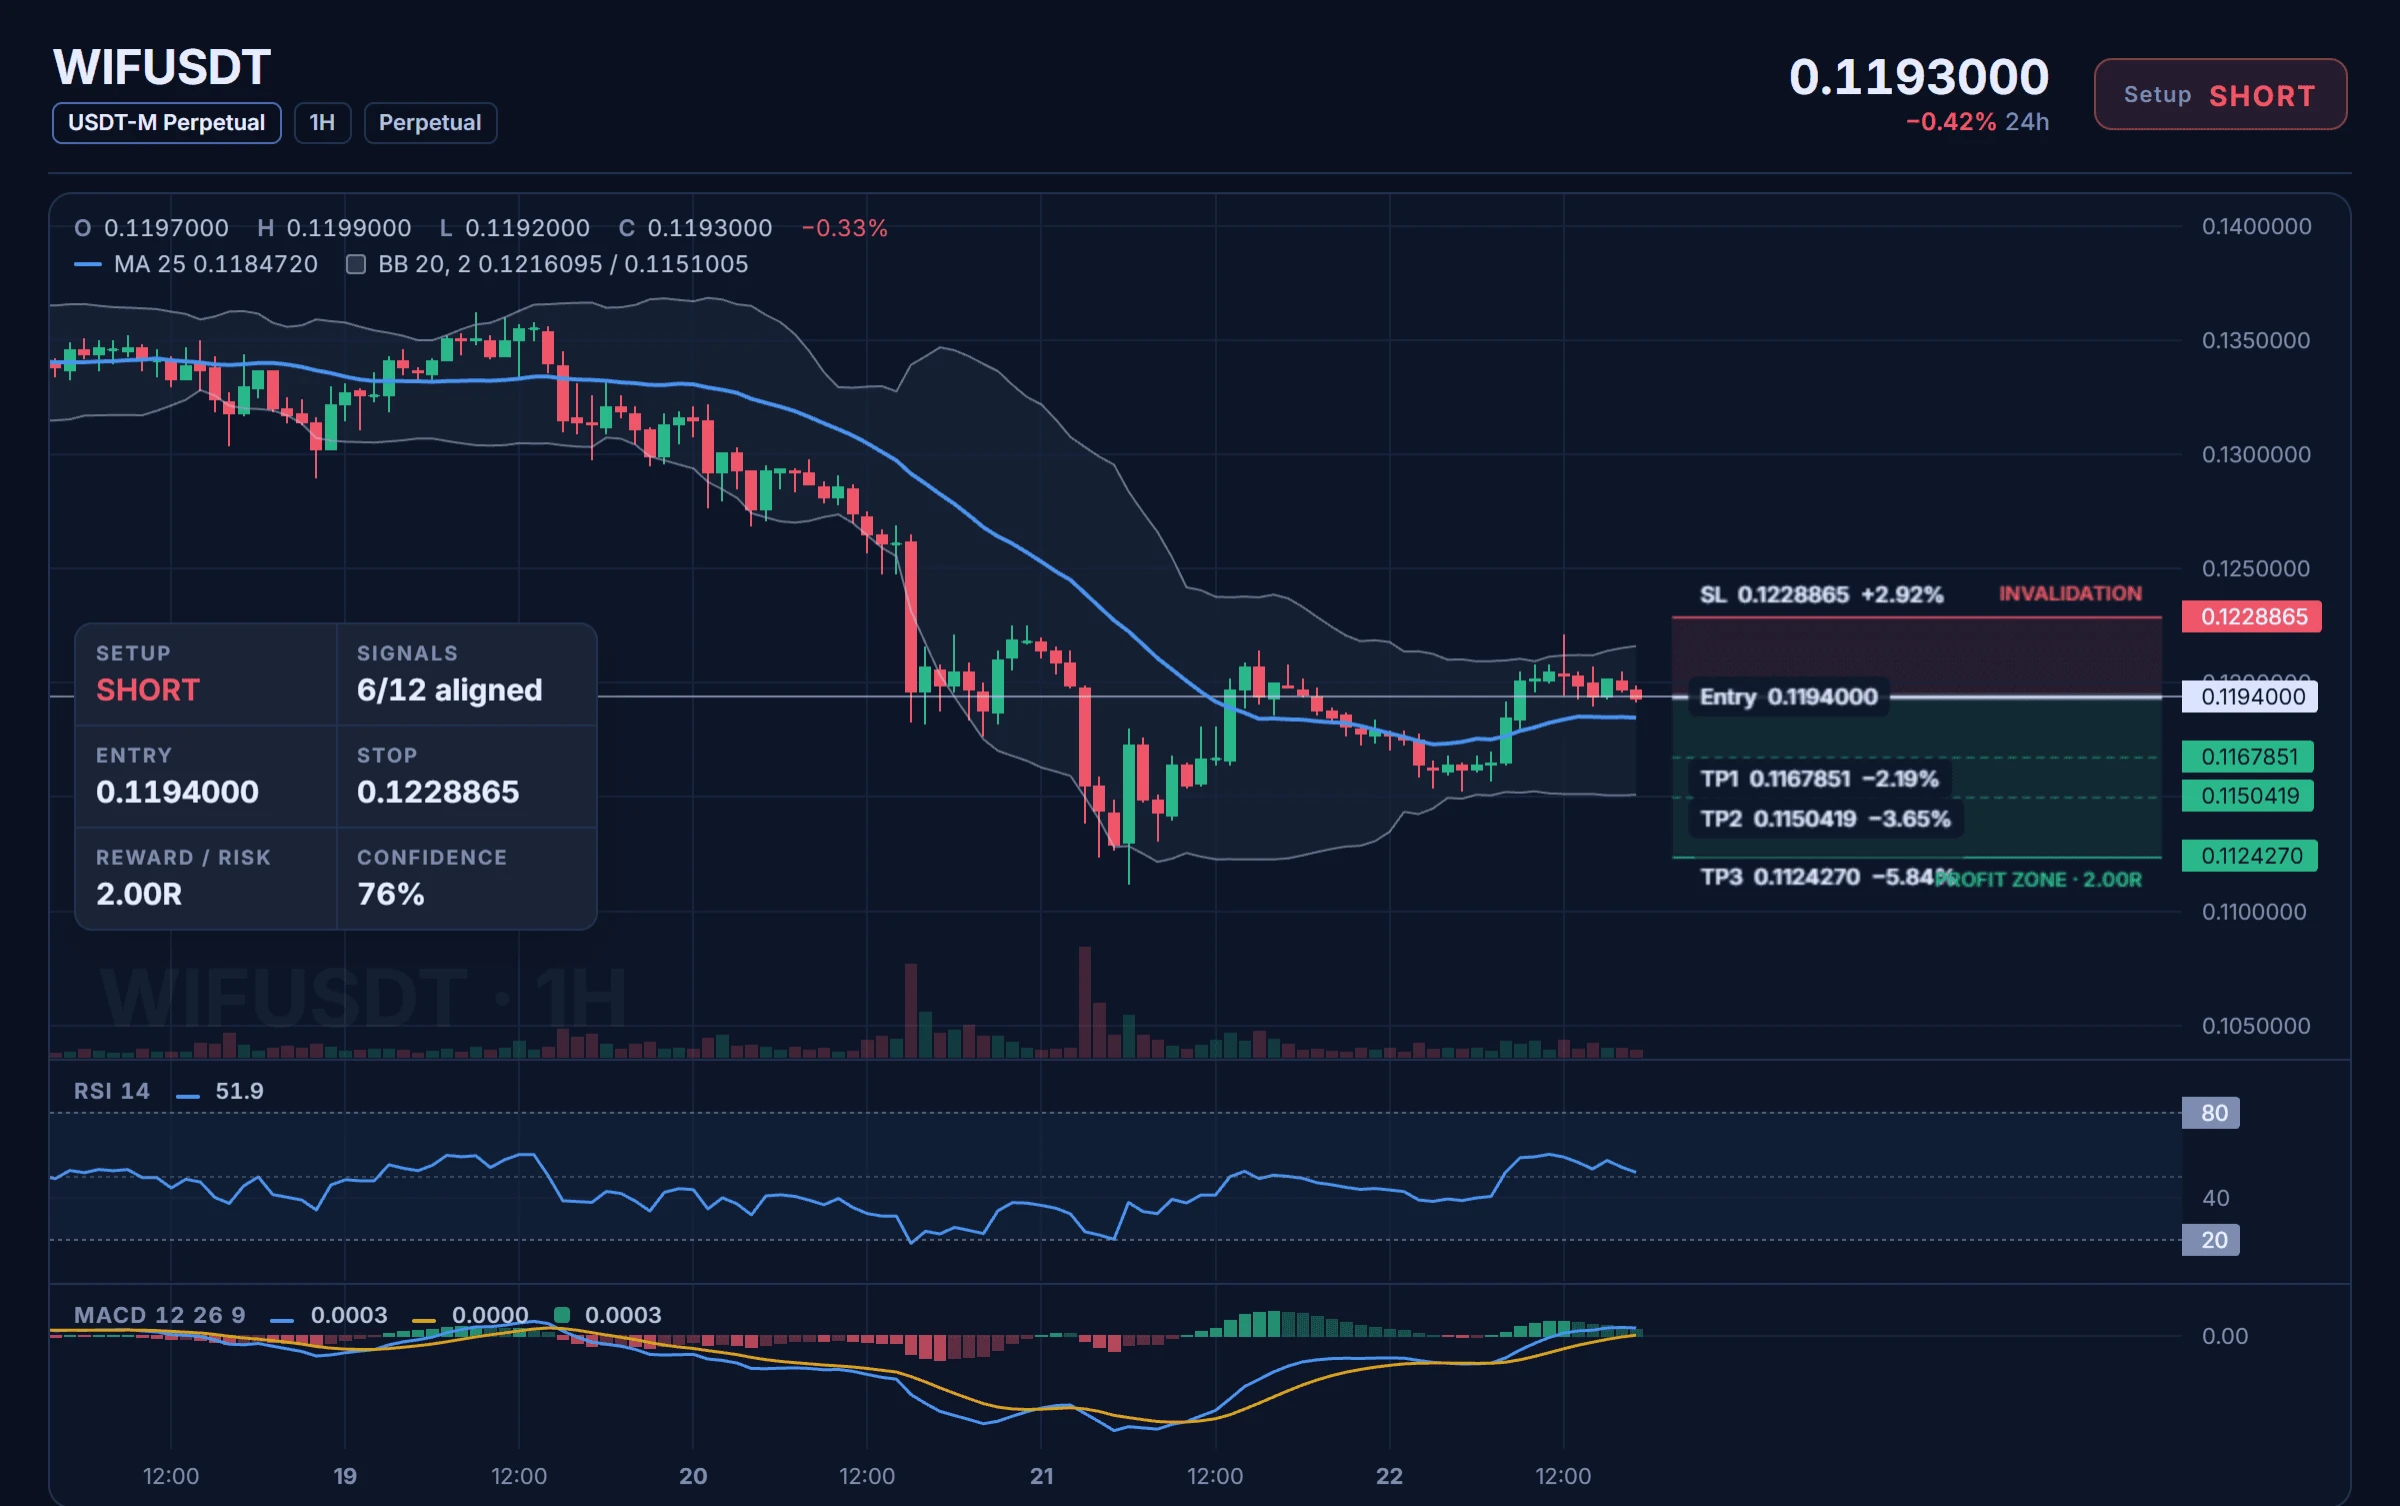
$WIF /USDT SHORT SETUP RANGE RESISTANCE RETEST

$WIF /USDT

Direction: SHORT

Entry: 0.1194000

Stop Loss: 0.1228865

Targets
TP1: 0.1167851
TP2: 0.1150419
TP3: 0.1124270

$WIF ‌
post-image
WIF-0.50%
Whatever the circumstances is DON'T QUIT.
good night 🌉.
post-image
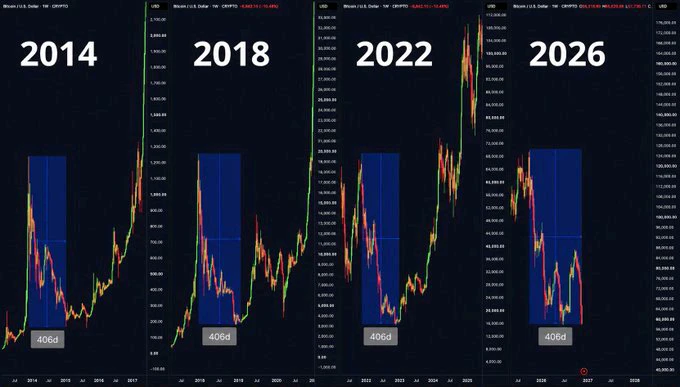
🚨📈 IS THE BULL MARKET ABOUT TO BEGIN NEXT WEEK?!
Could this be the FINAL week of Bitcoin's bear market? 👀🔥
Look at this historical pattern:
📉 2014 Bear Market: 58 weeks (406 days)
📉 2018 Bear Market: 58 weeks (406 days)
📉 2022 Bear Market: 58 weeks (406 days)
📉 2026 Bear Market: 58 weeks (406 days)
If this historical pattern repeats, we could be approaching a major market turning point! 🚀
Is the next Bitcoin bull run closer than everyone thinks? 🐂💎
#Bitcoin #BTC #BullMarket #Crypto #Altseason2026
post-image
BTC-0.67%
Load More

Join 40 M users in our growing community

⚡️ Join 40 M users in the crypto craze discussion

💬 Engage with your favorite top creators

👍 See what interests you

Trending Topics

BTCReboundFaces60KTest

2.2M Views30.1K Discussing

BTC rebounded from around $55,300 on November 21, briefly reclaiming $60,000 before pulling back to around $59,300. The $60K level is back in focus as traders assess whether the recovery can last. Is this rebound a sign of stabilization or a short-lived recovery? Would reclaiming and holding $60K be enough, or do you need confirmation from trading volume and fund flows?

PCEAndGDPDataNextWeek

261.1K Views2.6K Discussing

GateDirectIPOPhase3ANTAllocates92100Shares

859.3K Views5.1K Discussing
View More