Square
Following
Hot
News
Profile
Share your thoughts
placeholder
Article
btc update
live-cover
LIVE1,791
$BTC ‌DOGE long-short ratio is as high as 3.62 (retail longs are extremely crowded), with the highest risk of a contrarian flush
BCH funding rate is negative (-0.0138%), with short sellers relatively active
ETH order book depth bid/ask ratio is just 0.63, indicating the heaviest selling pressure
BTC traders should watch for the market impact of the Fed FOMC meeting on 10/27-28
BTC-0.28%
Trenches
CNPY
C
bade
b
CNPY
0xc6...ddd2
Market Cap
$.
Change
.
24h Vol
$.
Holders
.

STONK
S
bade
b
STONK
6GmA...UNgx
Market Cap
$.
Change
.
24h Vol
$.
Holders
.
ZIG
Z
bade
b
ZIG
0x8c...1145
Market Cap
$.
Change
.
24h Vol
$.
Holders
.
LIGHT
L
bade
b
LIGHT
0x47...3c0e
Market Cap
$.
Change
.
24h Vol
$.
Holders
.
AGT
A
bade
b
AGT
0x5d...e274
Market Cap
$.
Change
.
24h Vol
$
Holders
.
market price $xua
live-cover
LIVE1,815
Gold prices retreat for consecutive sessions; how should positions entered at higher levels be managed?
Gold began a sustained decline this week after surging, with key support levels breaking one after another and prices briefly testing around 3966 at the lows. Many long positions entered above 4068 are now facing some pressure. Prices have just rebounded near the lows, and at this stage it is better to carefully review positions rather than act blindly on emotion.
Personal view: The bearish structure on the two-hour timeframe remains unchanged, and the current rebound is more of a corrective
post-image
XAU-0.07%
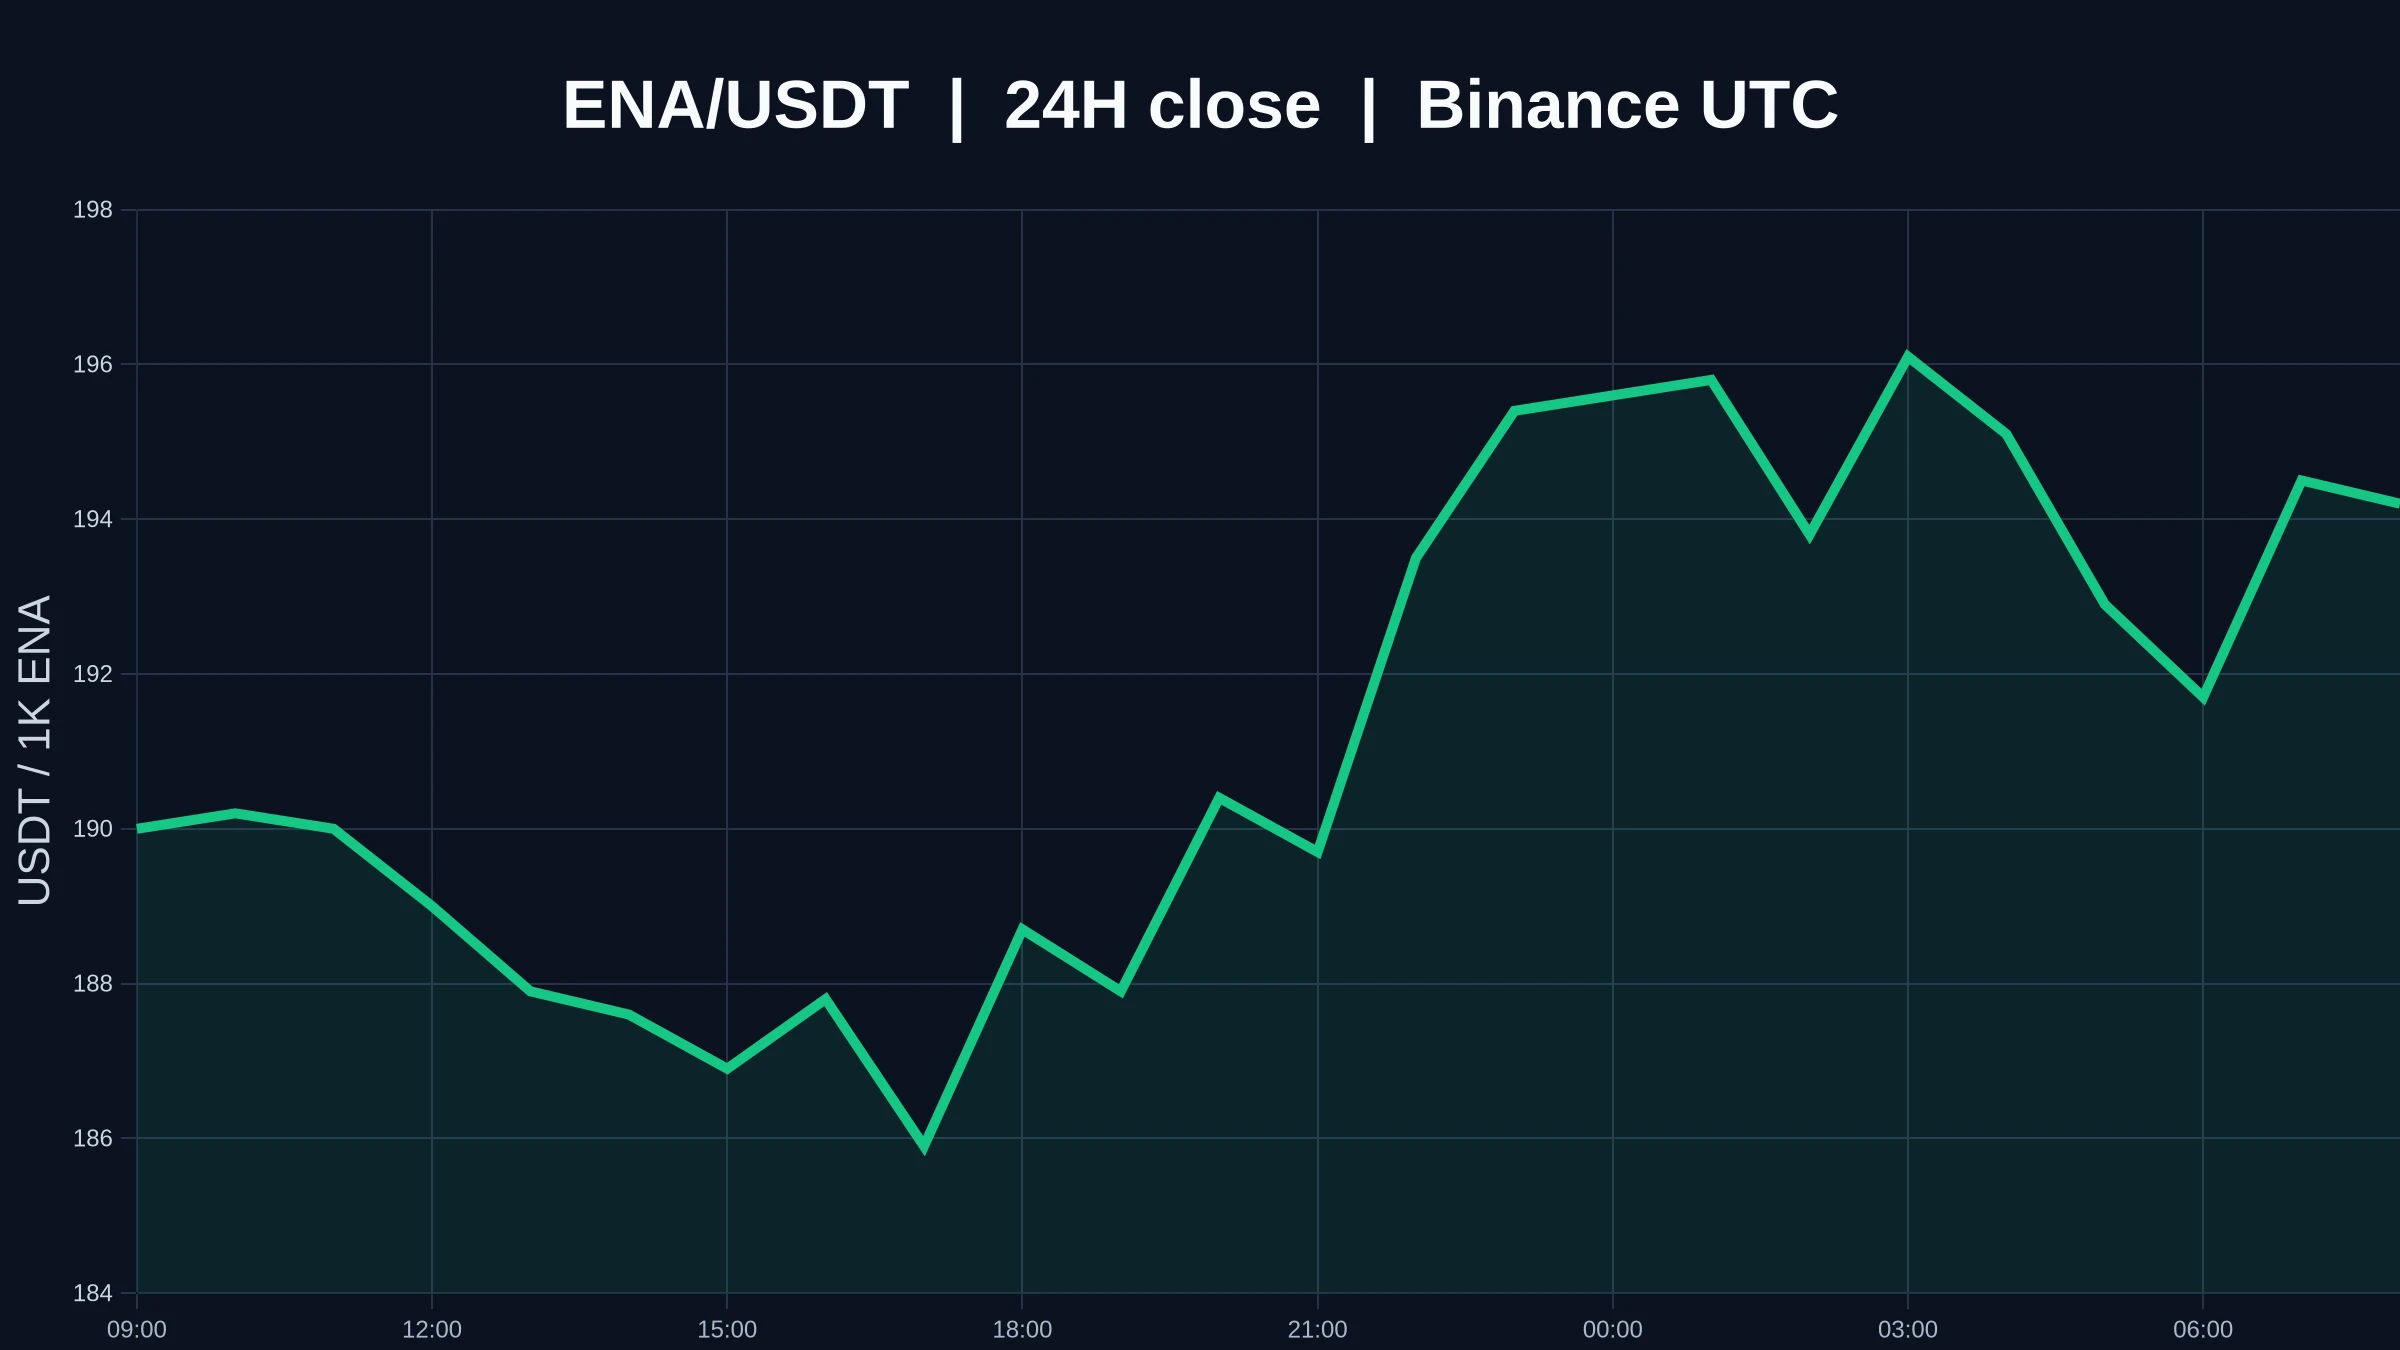
$ENA The 1-hour chart is relatively strong, while the 4-hour chart is weak; trading participation is only 0.05x, and the price is stuck at 0.1942 USDT. The two timeframes give opposite answers—who will change first?
For now, I wouldn’t treat a single short-term rebound as a trend reversal, because volume is too thin and the 4-hour chart remains in a downtrend channel.
I think we should wait for the 4-hour chart to turn as well, or for the price to hold above 0.1973 with rising volume, before calling it a valid breakout; a pullback to 0.1839 followed by a quick recovery would also present an op
post-image
ENA+0.22%
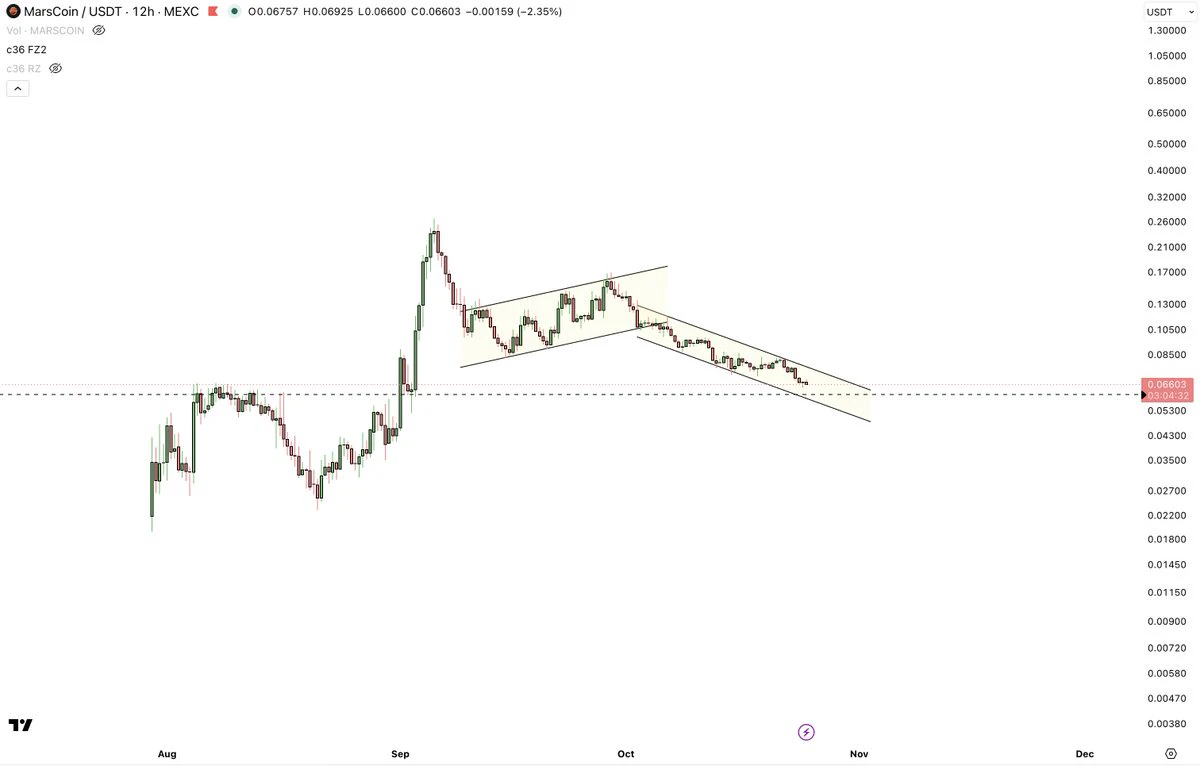
marscoin-4:native - good area to pick up a bit rn and looking to add with size around $0.06
post-image
MARSCOIN-1.87%
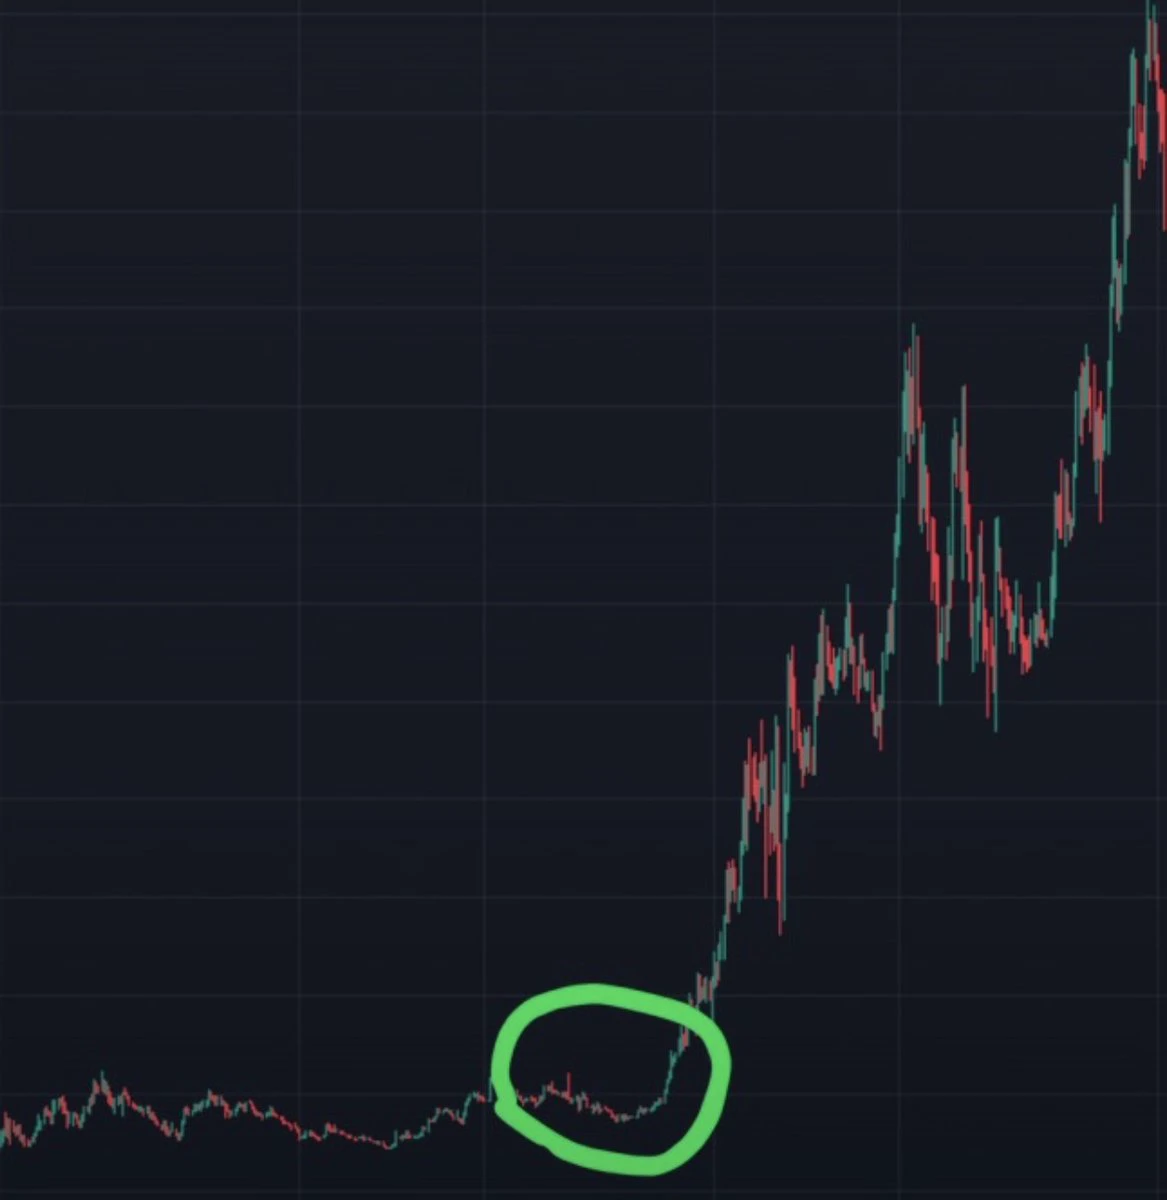
if you bought inside that green circle, you wouldn't need to explain your trade to anyone
the chart would do the talking
one ticker, before the pump
Who’s got it?
post-image
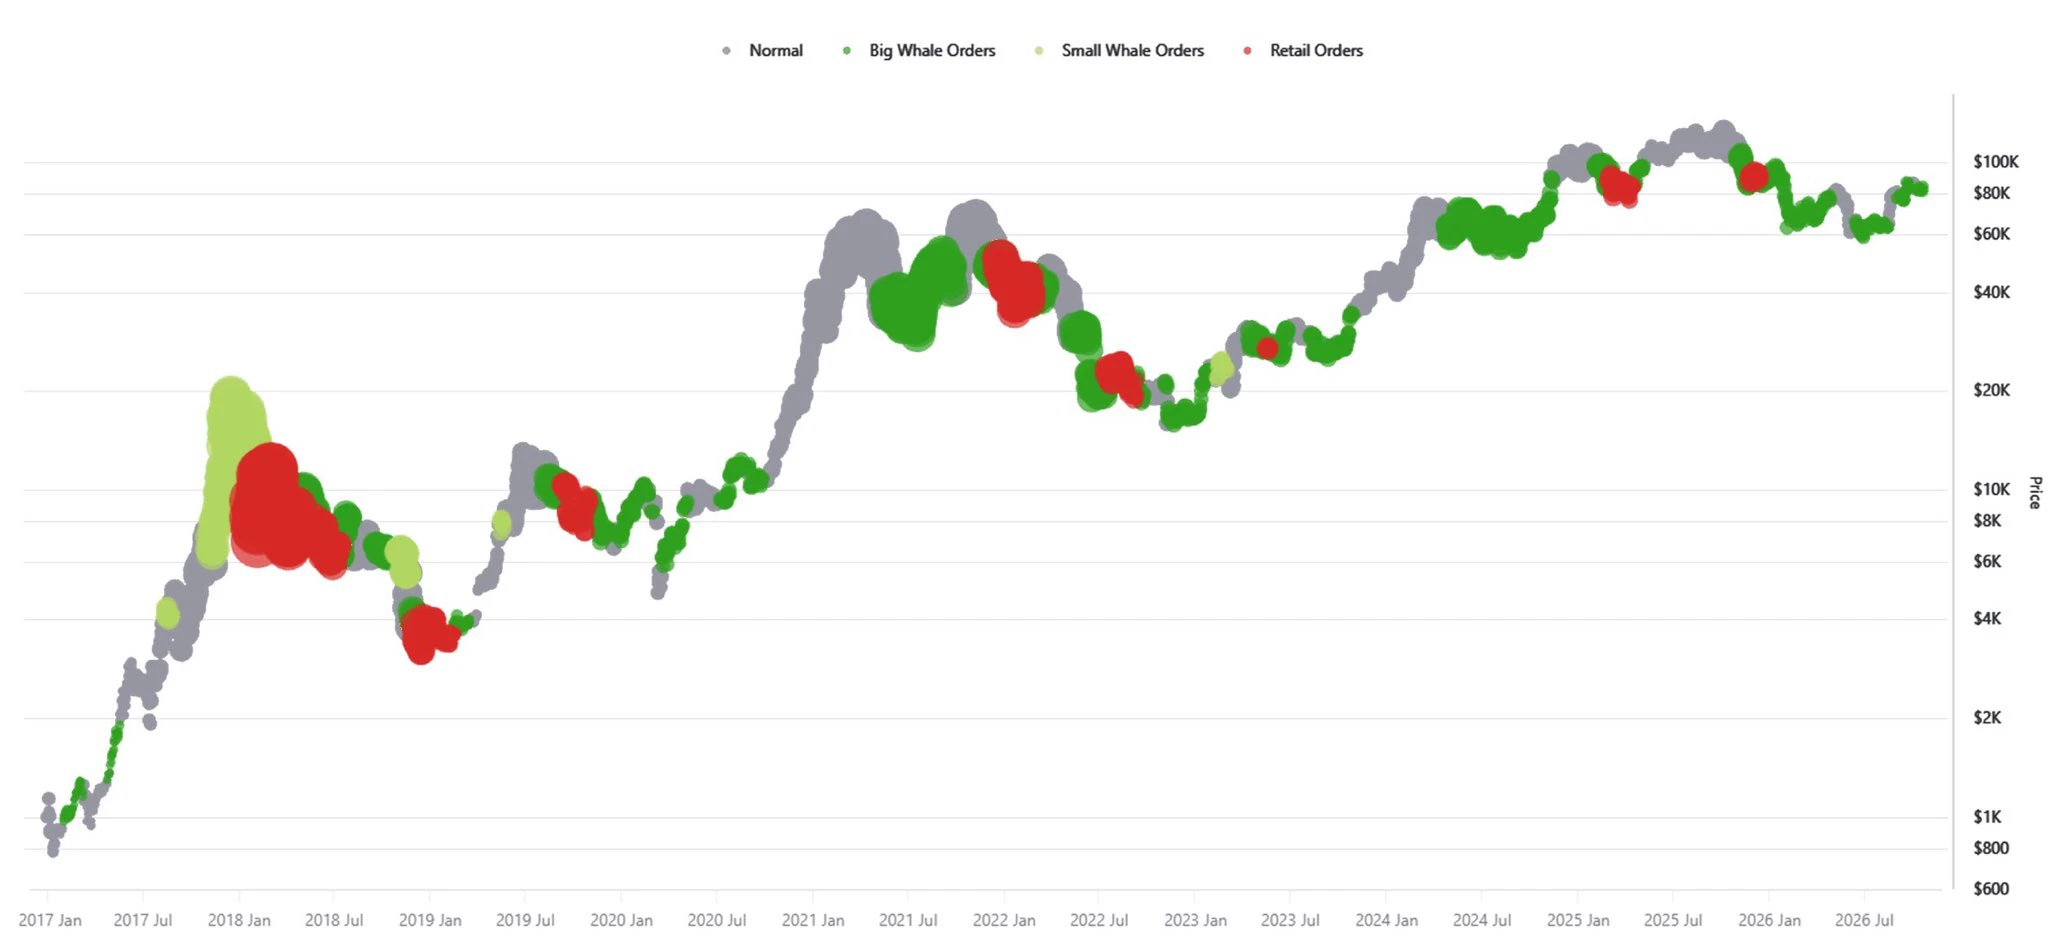
🐳 BITCOIN WHALES ARE MAKING MOVES!
Large holders accumulating $BTC could be a signal worth watching, but accumulation alone doesn’t guarantee a rally.
The real question is whether buyers can turn this activity into sustained upward momentum.
📊 Watch whale flows, trading volume, and key support levels.
My take: Stay alert, avoid FOMO, and let price action confirm the next move.
post-image
BTC-0.28%
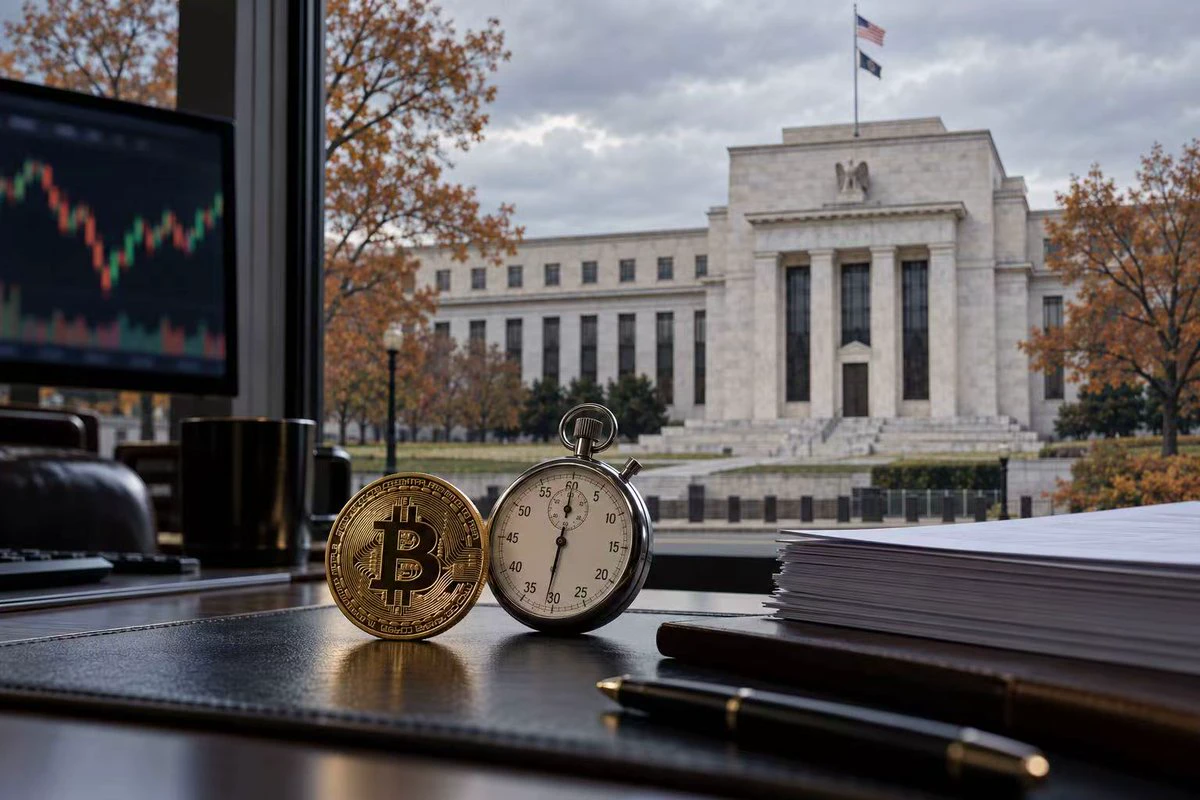
The Fed’s toughest task this time may be explaining why it can hold off on raising rates when the economy is still this strong.
With the October 27–28 FOMC meeting approaching, a pause remains the consensus expectation. In Reuters’ latest survey, 94 of 100 economists expected rates to remain unchanged, but all respondents expected another hike in December. This suggests the pause is more about observing the effects of policy, and that the tightening cycle is still some way from ending.
The real wild card lies in the economic data. The preliminary US Composite PMI for October fell from 58.4 to
post-image
GLDX-1.36%
PAXG-0.05%
XAU-0.07%
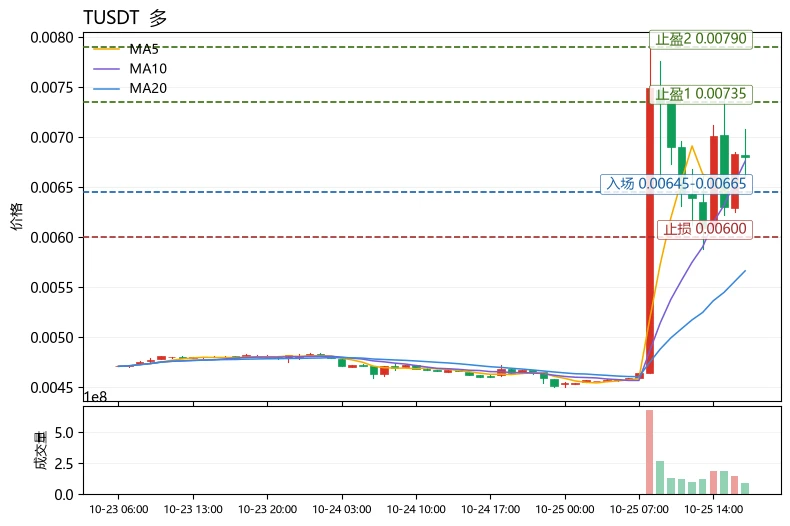
$T Short-term bias is bullish, but this is a high-volatility momentum-chasing trade, so position sizing must come before direction. The current price is 0.0068, up 47.19% over 24h, with a range of about 50.15% across 30 candles and volatility at an extremely high level; MA5=0.006606 has crossed above MA20=0.005664, the MACD histogram is positive, and the trend remains bullish, while RSI 63.1 is not yet overbought. The key contradiction is the funding rate of -0.9521%: shorts are paying, creating squeeze momentum, but this also means any pullback could be very sharp. The strategy is to take onl
post-image
WL+3.47%
STRK-6.06%
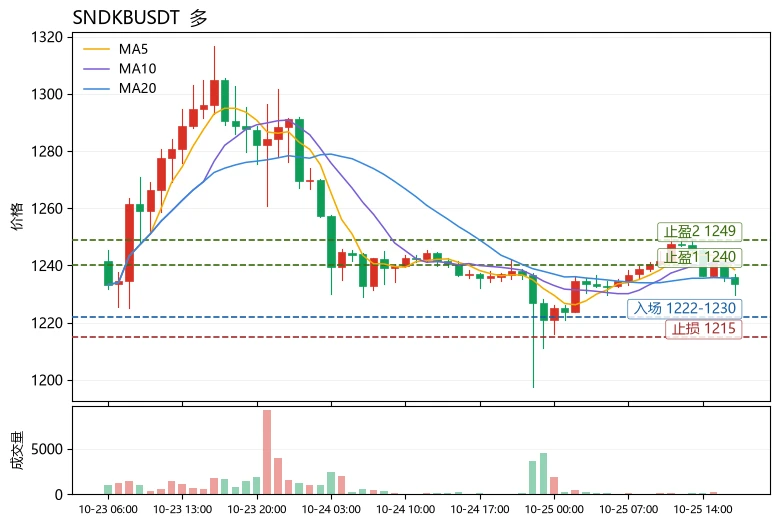
The moving averages are in a bullish alignment, yet the price has been slow to rise—is it building momentum or a false breakout? The answer leans toward the former: although the price is tracking near the lower Bollinger Band, MA5 remains above MA20 and the MACD histogram is still positive, indicating a pullback within a strong structure rather than a trend reversal.
Technical breakdown: The current price of 1233.61 is near the lower edge of the Bollinger Bands [1221.02, 1249.92], just about 1% above the lower band. Short-term oversold pressure has partially eased. MA5=1238.51 is above MA20=12
post-image
SNDKB
SNDKBSNDKB
Four.meme
MC:$3.87KHolders:1
0%
KAT-9.39%
💳 P2P payment methods: the key to trading USDT/VES smoothly.
Before opening a trade, there’s one step that determines whether everything goes smoothly or gets held up: making sure your payment methods are properly set up.
This practical guide covers how to set them up on the P2P marketplace and what to check to reduce friction when trading USDT/VES in Venezuela:
🔹 Make sure the payment method you offer matches one your counterparty can use: a mismatch is the main cause of delays.
🔹 The spread between buying and selling: it’s not just the price—it’s the real cost of entering and exiting a tr
post-image
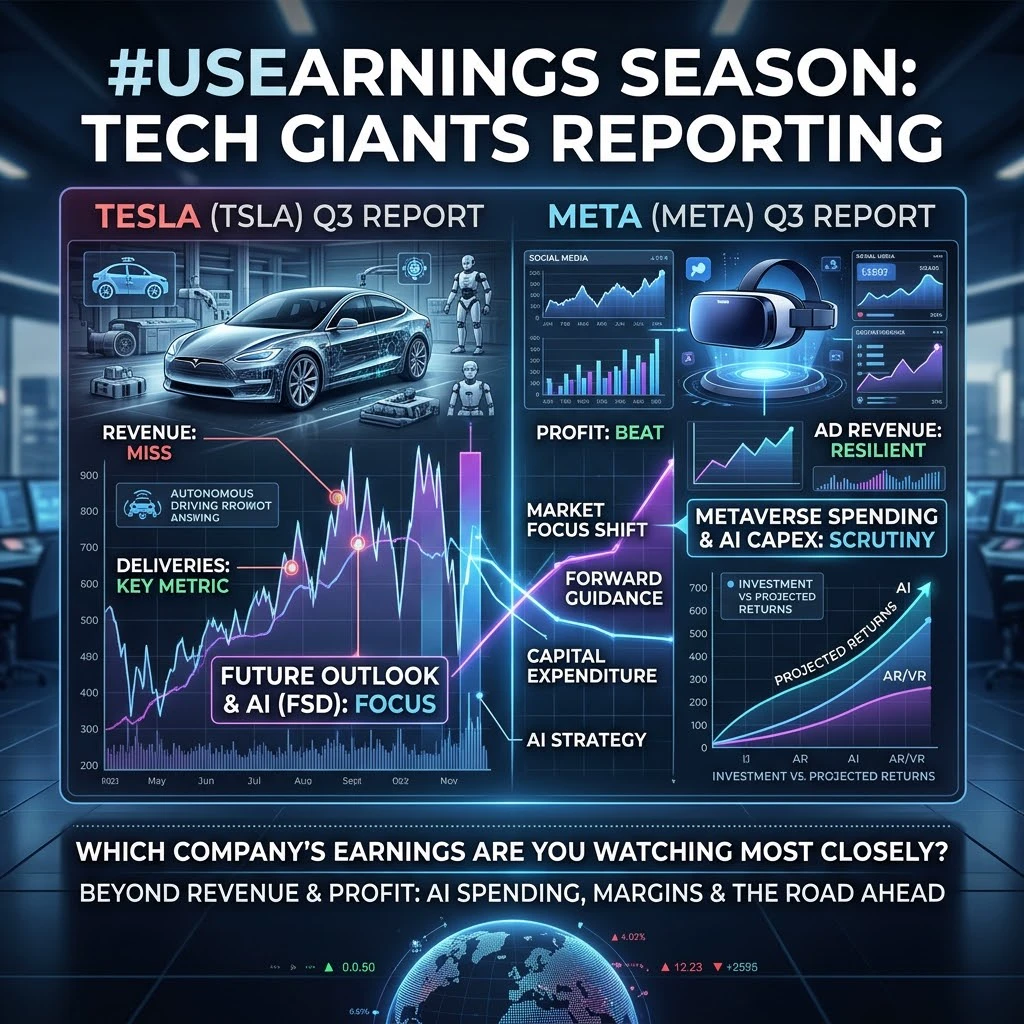
#USEarningsSeason

U.S. Earnings Season: The Real Story Is Bigger Than Profit
Imagine opening the market on Monday morning and seeing a major company report strong revenue, only for its share price to fall hours later. How can a business make more money and still disappoint investors? The answer often lies in what comes next. During the U.S. third-quarter 2026 earnings season, investors are looking beyond headline numbers to understand AI spending, capital investment, profit margins and future growth.
1. Start With the Basics: What Is Earnings Season?
Earnings season is when publicly traded
post-image
TSLA-0.62%
  • 8
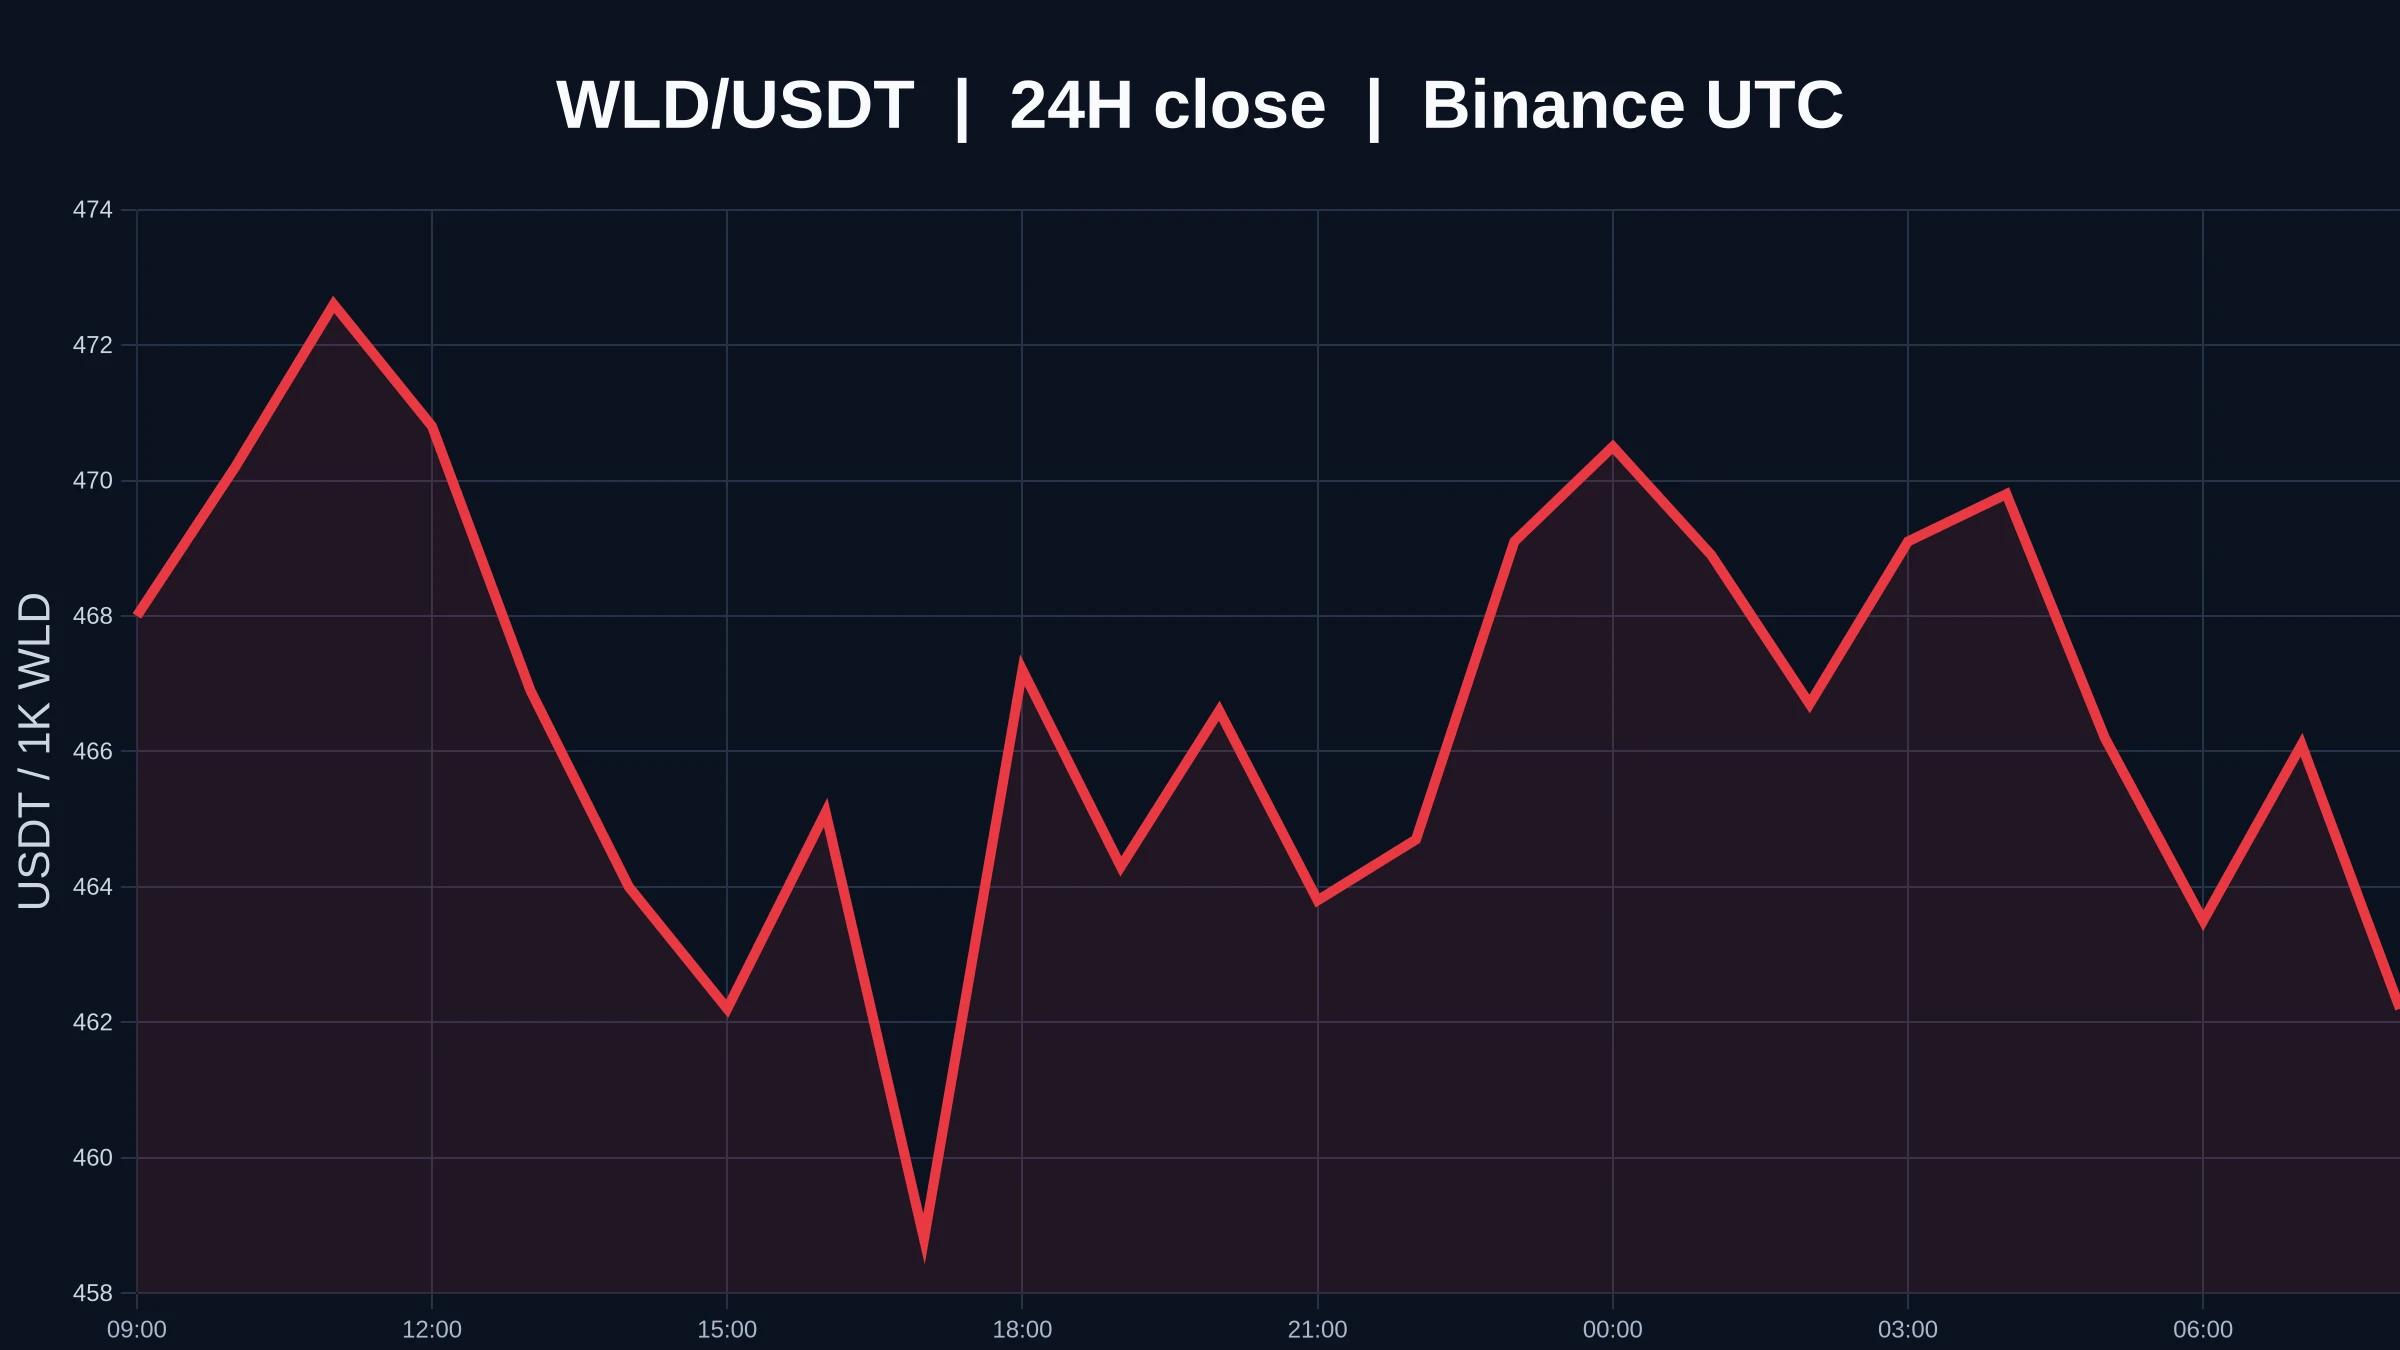
$WLD rebounds from oversold territory, but why I’m still not willing to call a bottom
$WLD is currently at 0.4644 USDT, down 1.49% over 24 hours, after trading between 0.4577 and 0.4747. The 1-hour support is at 0.4577, with resistance at 0.4742. Both the 1-hour and 4-hour trends are weak, and trading activity is only 0.07x. The price has already approached its 24-hour low, but the trend hasn’t reversed on either timeframe, and volume hasn’t signaled a change either, leaving the price moving sideways in a narrow range.
Oversold does not mean a bottom is in—that’s the first thing I want to mak
post-image
WLD-4.20%
Summary of Major Financial Events Next Week: Fed Decision + Big Tech Earnings Week Ahead!
Next week (10.28-10.30) will bring key developments for global capital markets, with major events including the Fed rate decision, a wave of Big Tech earnings reports, and key inflation data. Market volatility risks are set to rise significantly, and investors should pay close attention to the following:
I. Fed Policy Window: Rate Hike Expectations Shift
• October 29, 02:00 Fed rate decision: Markets widely expect the Fed to keep rates unchanged in the 3.75%-4.00% range. CME FedWatch puts the probability
SK Hynix+4.41%
SKHY+4.01%
MSFT+0.56%
AMZN-0.97%
  • 3
Weekend get-together~~
Let's dig in😉😉
post-image
Does a Price Breakout Mean the Market Is About to Take Off?
In cryptocurrency trading, many people have experienced this:
The price finally breaks through a key resistance level, and trading volume also increases. Traders think a rally is about to begin and chase the price, only for it to suddenly reverse and fall back into its previous range.
This is what traders often call a “false breakout.”
What really needs to be judged is not just whether the price has broken through, but whether the market can continue accepting higher prices afterward.
I. What Is a False Breakout?
A false breakout usua
post-image
  • 2
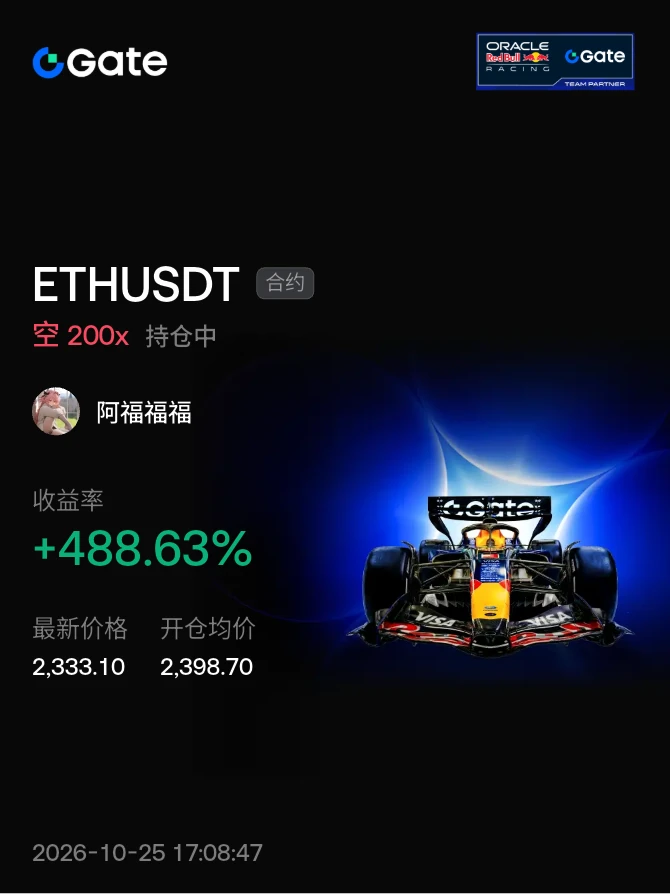
#晒出我的持仓收益 The average ETH cost has been brought down by rolling the position,
BTC is the overall reserve force and remains untouched😇
post-image
ETH-1.39%
BTC-0.28%
Why Do Some Tokens Have High Trading Volume, Yet Their Prices Fail to Rise?
In the crypto market, a confusing phenomenon sometimes occurs:
Trading volume keeps growing, and market discussion gets increasingly heated, but the token price continues to fluctuate within a range.
Many people assume that rising trading volume means money is flowing in and that the price will soon break out.
But that is not always the case.
Trading volume reflects market activity, while price movements depend on how buyers and sellers trade and whether the market can continue to absorb selling supply.
I. What Does Hi
post-image
How are we supposed to survive No Nut November?
post-image
Load More

Join 40 M users in our growing community

⚡️ Join 40 M users in the crypto craze discussion

💬 Engage with your favorite top creators

👍 See what interests you

Trending Topics

USEarningsSeason

85.58k Views3.43k Discussing

The U.S. Q3 earnings season is in full swing, with major tech companies including Tesla and Meta reporting results. Market focus is shifting beyond revenue and profit toward AI spending, capital expenditure, margins and forward guidance. Which company’s earnings are you watching most closely?

GateWCTCS9GlobalTradingCompetition

679.66k Views7.99k Discussing

USConsumerSentimentNearRecordLow

9.11k Views265 Discussing

View More