











#IntelBeatsEarningsButStockPlunges #ShareWeekly #INTC
Intel’s Earnings Surprise Was Not Enough: Why Investors Are Suddenly Worried About Its Recovery
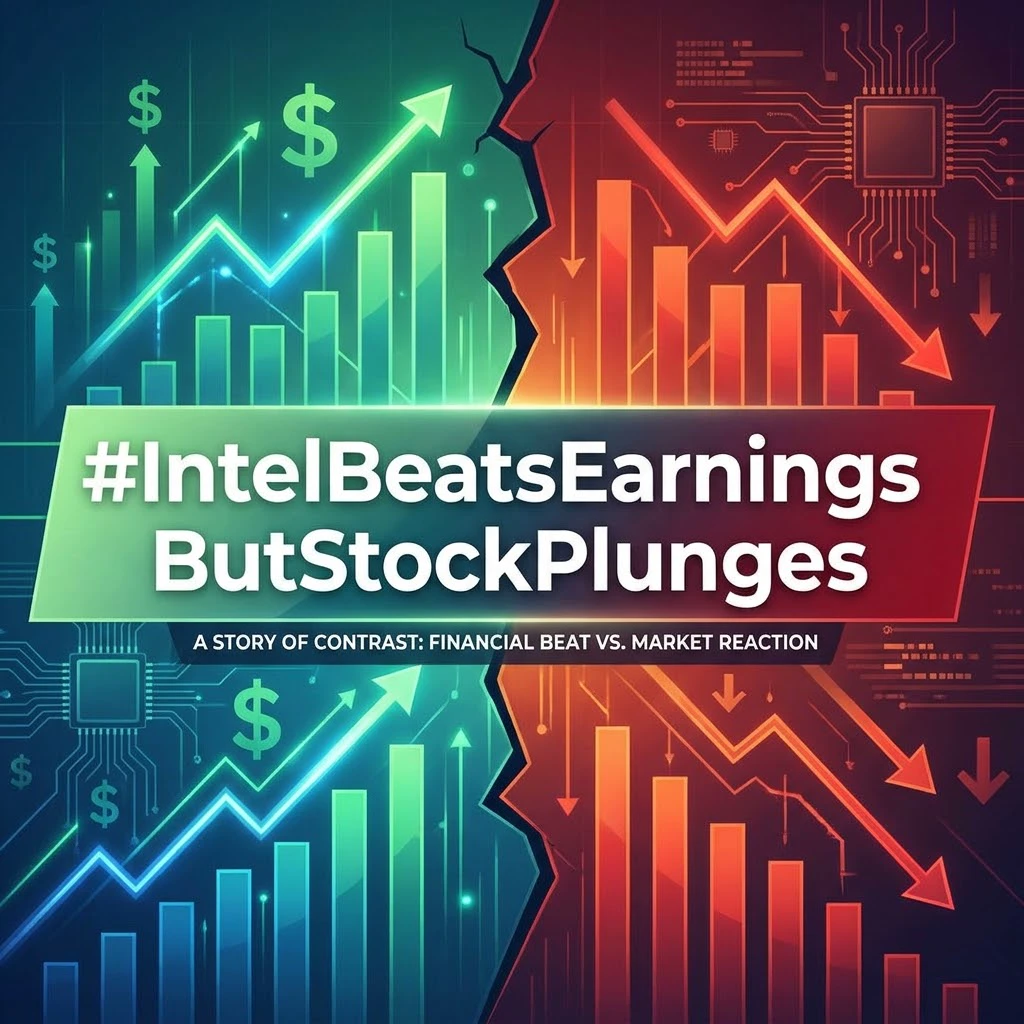
Intel delivered a stronger-than-expected third-quarter performance, but the stock market responded with a massive sell-off, sending shares down approximately 23%. At first glance, this reaction seems difficult to understand. How can a company beat earnings expectations and still experience such a dramatic decline?
The answer is that investors are more interested in what comes next than what has already happened. Intel's Q3 results showed meaningful operational progress, but its fourth-quarter guidance raised serious concerns about profitability, production capacity, and future cash generation.
1. Strong Q3 Results, Disappointing Future Guidance
Intel reported Q3 2026 revenue of $16.5 billion, non-GAAP gross margins of 44.1%, and adjusted EPS of $0.52. These figures demonstrated that the business is making progress.
However, management's Q4 outlook changed the market's perspective:
- Revenue: $15–$16 billion.
- Non-GAAP gross margin: 38%.
- Adjusted EPS: $0.25.
Analysts had expected approximately $17.07 billion in revenue and $0.45 in adjusted EPS. Intel's projections were significantly below both estimates.
The biggest concern is the expected gross-margin decline of approximately six percentage points. Investors are questioning whether Intel can turn growing demand into sustainable earnings.
2. Manufacturing Capacity Is Becoming a Major Problem
One of Intel's biggest challenges is its inability to manufacture enough server processors to satisfy customer demand.
This is particularly concerning because AI infrastructure requires powerful server CPUs alongside GPUs and other specialized hardware. Missing delivery opportunities could prevent Intel from fully benefiting from the AI expansion.
Additionally, an explosion at the Kiryat Gat facility in Israel is expected to contribute to approximately $600 million in revenue losses over two quarters, adding further pressure to operations.
3. PC Weakness Is Another Warning Sign
Intel's PC-related business declined 5% year over year in Q3. Management expects weakness in the PC market to continue through the first half of 2027.
Rising memory prices are creating another obstacle because expensive components can increase the cost of building new computers and discourage consumer demand.
This means Intel cannot depend entirely on the traditional PC market to support its recovery.
4. AI Growth Is Impressive, But Profitability Matters
There is still a positive story developing inside Intel.
Data Center and AI revenue reached $7.3 billion, representing 78% year-over-year growth. Meanwhile, foundry revenue increased by 58%.
These developments suggest that Intel is benefiting from increasing demand for AI infrastructure and manufacturing services.
However, revenue growth alone cannot guarantee a successful turnaround. Investors want stronger margins, reliable deliveries, and improved free cash flow.
Intel is also investing heavily in expanding manufacturing capacity, while management has warned that full-year positive cash flow is not expected.
5. Is the 23% Sell-Off an Opportunity or a Warning?
Both interpretations deserve attention.
The bullish argument includes accelerating AI server demand, strong Data Center and AI growth, improving foundry revenue, and better operational execution.
The bearish argument focuses on disappointing Q4 guidance, declining margins, production limitations, weak PC demand, and continuing cash-flow pressure.
Another important consideration is valuation. Intel shares had already gained more than 130% during 2026 before the earnings announcement, leaving significant expectations built into the stock price.
My Market Perspective
I do not believe one disappointing forecast automatically destroys Intel's long-term recovery story. However, I also would not consider a sharp decline an automatic buying opportunity.
I would monitor five indicators: Q4 revenue performance, gross-margin recovery, Xeon and AI processor deliveries, free cash flow, and the ability of Intel Foundry to become a profitable external manufacturing business.
My outlook has three possible scenarios:
- Bullish: AI demand accelerates and manufacturing efficiency improves.
- Neutral: Growth continues, but profitability recovers gradually.
- Bearish: Supply constraints persist and cash flow deteriorates further.
Ultimately, Intel has significant opportunities, but execution will determine whether those opportunities translate into shareholder value.
For me, the most important question is not how far INTC has fallen. It is whether Intel can prove that its recovery is financially sustainable.
Not financial advice. Always do your own research.
#英特尔财报超预期股价却暴跌 #WCTCS9 @Gate_Square
$INTC