Share your thoughts
placeholder
Article
Everyone’s staring at LINK’s RSI—but they’re blind to the 95% confidence trap.

$LINK /USDT - LONG

Trade Plan:
Entry: 11.779 – 11.827
SL: 11.574
TP1: 11.975
TP2: 12.090
TP3: 12.262

Why this setup?
- 1D trend is bullish, yet 15m RSI at 71.13 screams overheated—this is the classic pre-pump shakeout.
- Price is armed at 11.803 with TP1 at 11.975; the 4h structure is coiling, not reversing.
- ATR (0.0955) is tight—meaning the breakout, when it comes, will be violent. Why wait for confirmation when the stop (11.574) is only 1.9% away?

Debate:
Are you fading this RSI spike or loading the
post-image
LINK-1.54%
Layout for Bitcoin, Ethereum, and Dogecoin
live-cover
LIVE971
How is this a rebound? This was CPR for my account, wasn’t it? When the screen was full of green candles, I was wondering, “Can this market still be traded?” Then, right after I finished looking at the bearish news, $LIT surged from 3.753 all the way to 4.618, giving me a straight-up slap in the face and telling me: stop arguing, the trend is king.

The entry logic was actually very simple: the pullback held, and buying strength increased. When it stops falling, it stops falling—the price and volume were both hinting that someone was buying the bottom. While everyone else was running, I chos
post-image
LIT+1.47%
BTC-1.51%
XRP-2.78%
MARKET ALERT - FLOCK/USDT
FLOCK analysis and trading opportunities
Trend & Indicator Analysis
15-Minute Timeframe: Price (around 0.05272) has just broken out above the 20 EMA (0.05164) and 50 EMA (0.05167). This indicates short-term bullish momentum after a consolidation phase. The price is well above the 200 EMA (0.04650), confirming that the primary trend remains upward.
1-Hour Timeframe: The price structure is in a post-pump consolidation phase following a sharp surge toward 0.06540. The current price is rebounding strongly from the 20 EMA area (0.05069), which is serving as the nearest sup
FLOCK+36.09%
  • 4
  • 1
UNI at $6.3—are you chasing it or not?
First, the surface view: it has doubled in a month, and everyone is shouting, “UNI has gone crazy.”
It was still languishing at 3.2-3.6 in mid-August, climbed above 5 at the end of August, and surged to 6.5 in early September. Today it is ranging between 6.11-6.35, with little 24-hour volatility, but it is still up 90%+ over the past month.
RSI is at 78-80, already overbought. The trend is bullish, but the slope is too steep, and 6.5 has held three times.
First: UNI is no longer just a governance token—it is “burning money.”
Previously, UNI only provided
post-image
BTC-1.54%
ETH-2.48%
UNI+1.31%
Aster’s clarity of thought can now catch up with fable5
But it’s still a little slow
I got two resets over the past two days, on top of the existing quota
There’s 300% of the quota available to use
So satisfying
post-image
Those without USDT, contact me. Anything of value is accepted; you can go first $BTC $GT $ETH
BTC-1.54%
GT+2.94%
ETH-2.48%
It is better to spend time improving your imperfect self than to waste time expecting perfection from others.
Just minted a couple of OTC Desks
Feels like this could be to Solana what Stonkbrokers is to Robinhood
You'll need 100k $OTC + .5 SOL to get one
Are these on your radar yet?
post-image
SOL-1.20%
BTC at $79,600—are you panicking?
Look at the surface first: major macro headwinds, yet the price hasn't collapsed.
It just surged above $82,000 on September 3. On September 4, the nonfarm payrolls came in at 162,000 versus expectations of 55,000, exceeding them by 3 times. The market was stunned: the probability of a rate hike jumped from 50% to 60%. BTC fell in response and is currently hovering around $79,600. From $82,000 to $79,600, it has fallen just 3%.
In the past, this kind of data could trigger a 10% plunge.
First: Nonfarm payrolls beat expectations by 3 times? You think it's bearish
post-image
BTC-1.54%
ETH-2.48%
SOL-1.20%
#USELESSSurgesAnother67%
USELESS extended its move and added another 67 percent in 24 hours after the public call from Bonk Guy. Market capitalisation has reached approximately 213 million dollars. Bonk Guy stated that his conviction on this trade exceeds the 2023 BONK position and that his current holding is up roughly 1.68 million dollars. The combination of a high-profile call and a vertical price reaction remains the backdrop.
On the 4-hour chart price is trading at 0.23790 after a high of 0.24050. The 9-period MA sits at 0.23876 and the 50-period MA is much lower at 0.12024. Bollinger Ba
USELESS+2.77%
  • 1
  • 2
Bought Bstonk; you can think of it as Base’s Pons
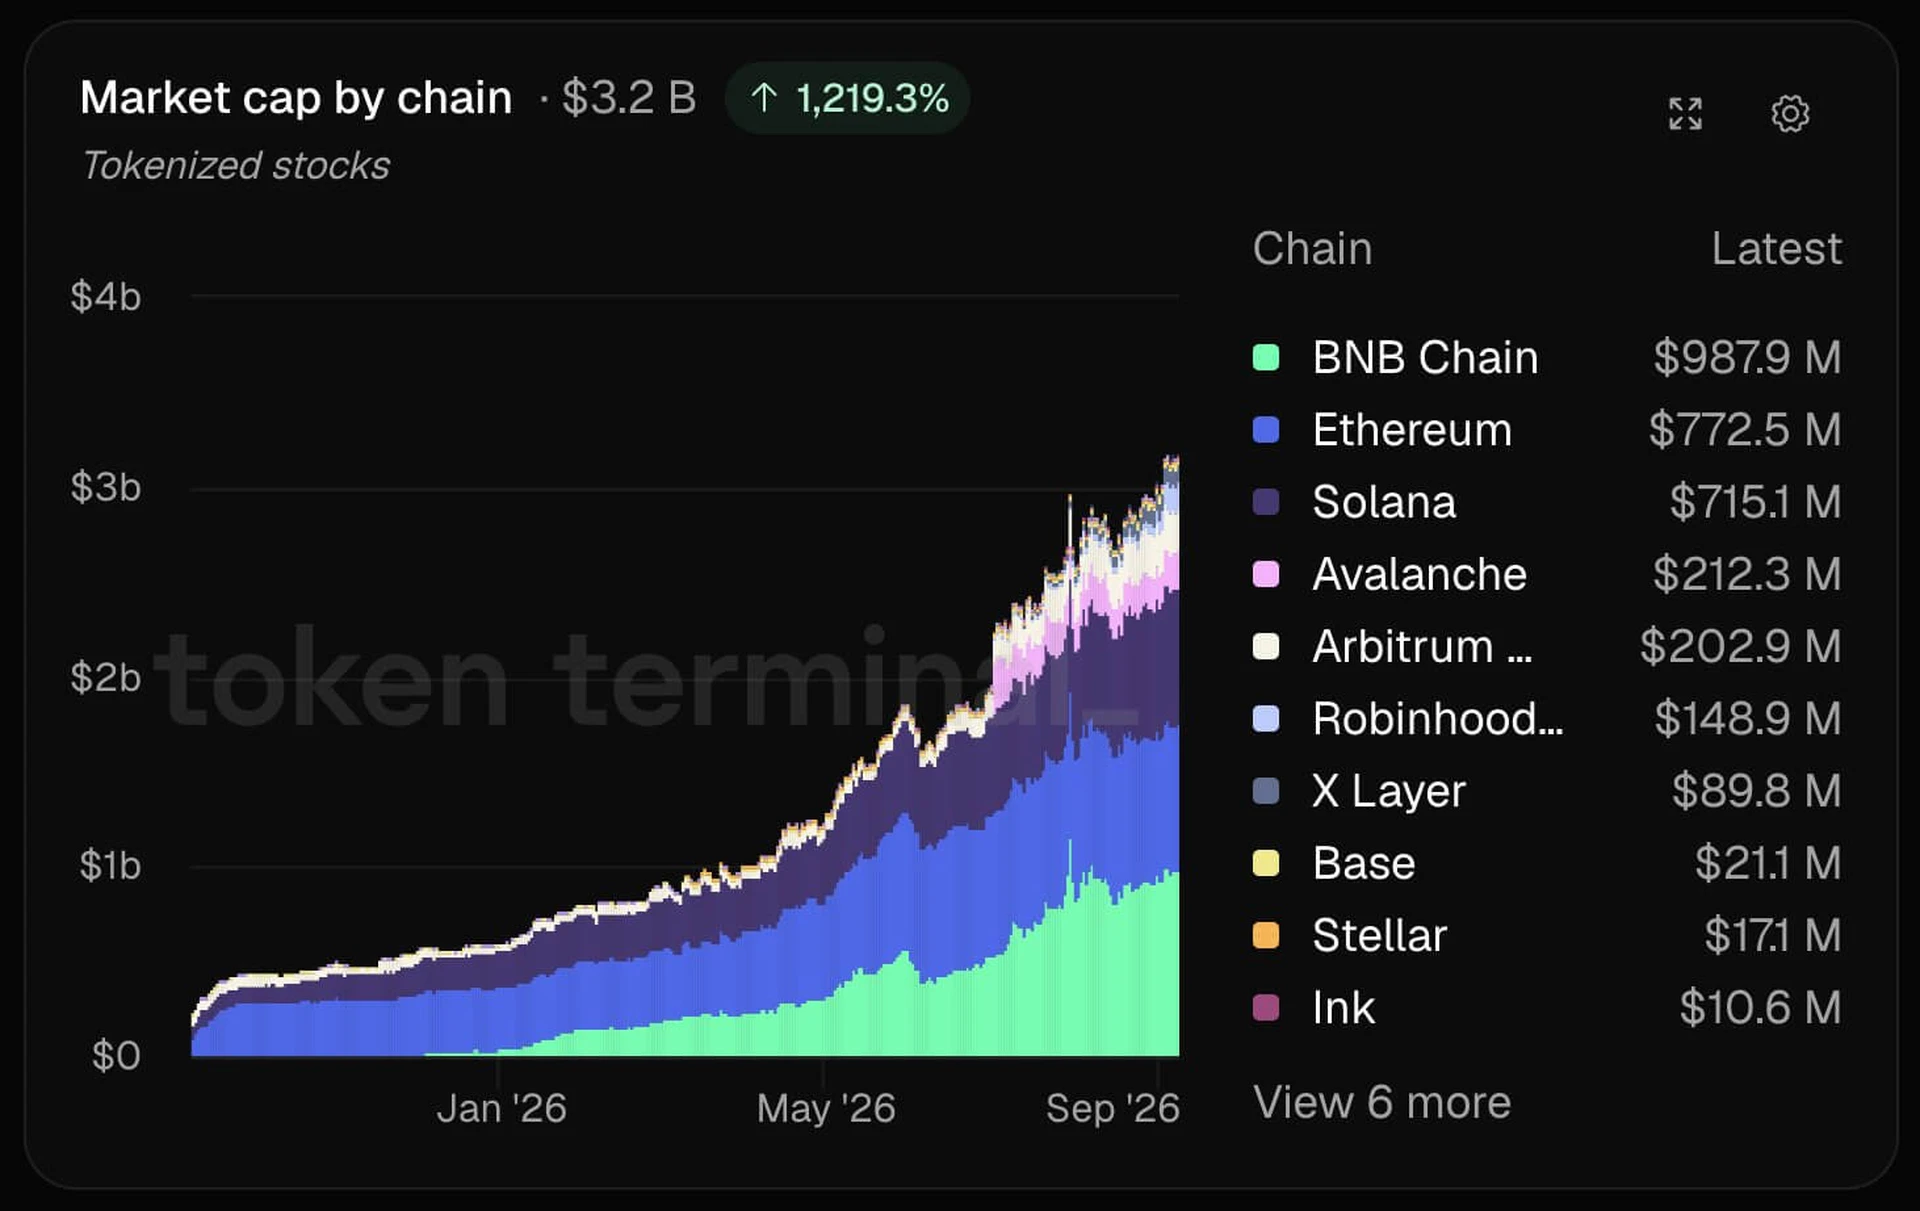
I know Base is far behind Robinson in tokenized stocks, but their market caps differ by 200x! The upside is enormous
And 100% of protocol revenue is used to buy back the token
Do your own research
post-image
PONS+27.99%
Been LP farming with tokenized stocks on @Uniswap Robinhood and the economics have been way better than I expected:
Fees I earned (600%+ APR) heavily beat IL.
The setup is pretty simple:
- buy a stock I’m confy holding
- pair with USDG
- LP around a range (narrow one) where I think the stock will trade.
If the stock rallies, the LP gradually sells the stock into USDG. So compared to simply holding the stock, you sacrifice some upside.
But the fees earned can be much more substantial.
I saw this happen very clearly with $META.
I entered META around $594 and set my LP range around $560–635 (~8%
post-image
USDG-0.01%
META+0.99%
METAG-0.04%
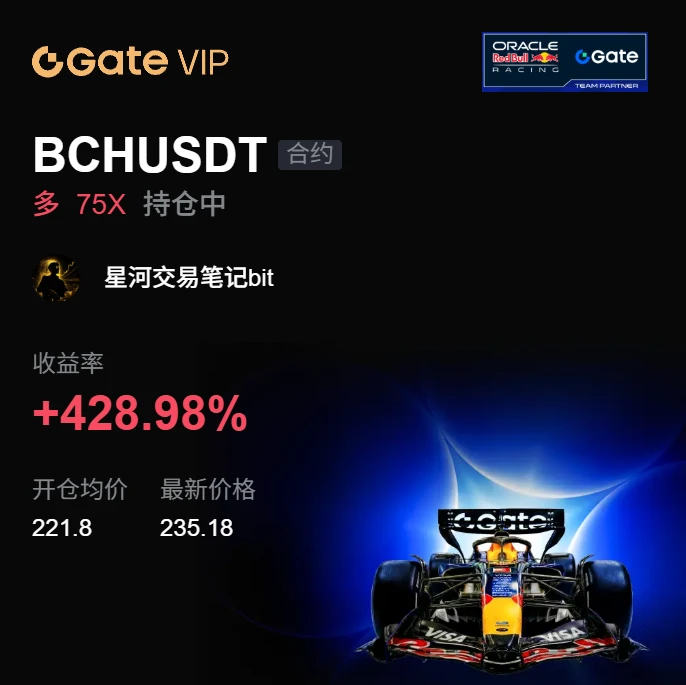
Starting today, I’m calling trades—anyone brave enough to be an early adopter? Keep positions tightly controlled and profit slowly!!!
post-image
“Wang Kang Treaty”
Even Li Hongzhang wouldn’t dare sign it…
post-image
Rounding off
The bull came and prices rose because I flapped my wings over here once????
post-image
牛来+19.23%
in on $TSLA ‌– it's getting hammered today!"
Tesla is down nearly 6% at $353.91, dropping -22.45 points. The 24h high is $364.68 and the low is $351.34 – that's a wide range. EMA5 is at $353.17, while EMA10 ($361.16) and EMA30 ($361.60) are well above – price is trading below both, a clear bearish signal. MACD is negative at -2.42, with DIF (-1.36) below DEA (1.05) – momentum is firmly to the downside. The after-hours price is $352.90, down another -0.28%, suggesting more weakness ahead. The P/E ratio is extremely high at 327.85, and the market cap is $1.397T. The news about disappointing Cyb
post-image
TSLA-3.70%
  • 1
  • 1
BTC GOLDEN CROSS COULD BE A LIQUIDITY TRAP.
Everyone is watching Bitcoin’s golden cross. That’s exactly why I wouldn’t trade it blindly.
When thousands of traders are watching the same $82K –$84K zone, breakout orders, stop-losses, and liquidation levels can pile up around it. And when liquidity builds, large players have something to target.
So even if Bitcoin’s bigger bullish setup remains intact, $BTC could still sweep below support, trigger stops, and reclaim the level before making the real move. The same game can happen above resistance.
Options positioning makes this even more interesti
post-image
BTC-1.51%
#BTCReclaims80K
$BTC is sitting at a critical decision point.
Bitcoin pushed above $82K, but the breakout was rejected after the stronger-than-expected U.S. August jobs report triggered a sharp macro-driven reaction. BTC fell from around $81.3K to $78.6K before recovering toward $79.8K.
That price action is telling us something important: right now, macro is driving crypto.
The key levels are clear:
🔴 $82.2K–$82.3K — Major resistance
🟡 $80K–$80.5K — First reclaim zone
🟢 $78.6K–$79K — Critical short-term support
The bullish structure is still alive as long as BTC continues holding above $78
BTC-1.54%
Load More

Join 40 M users in our growing community

⚡️ Join 40 M users in the crypto craze discussion

💬 Engage with your favorite top creators

👍 See what interests you

View More