

Square
Following
Hot
News
Notifications
Profile
Share your thoughts
placeholder
Article
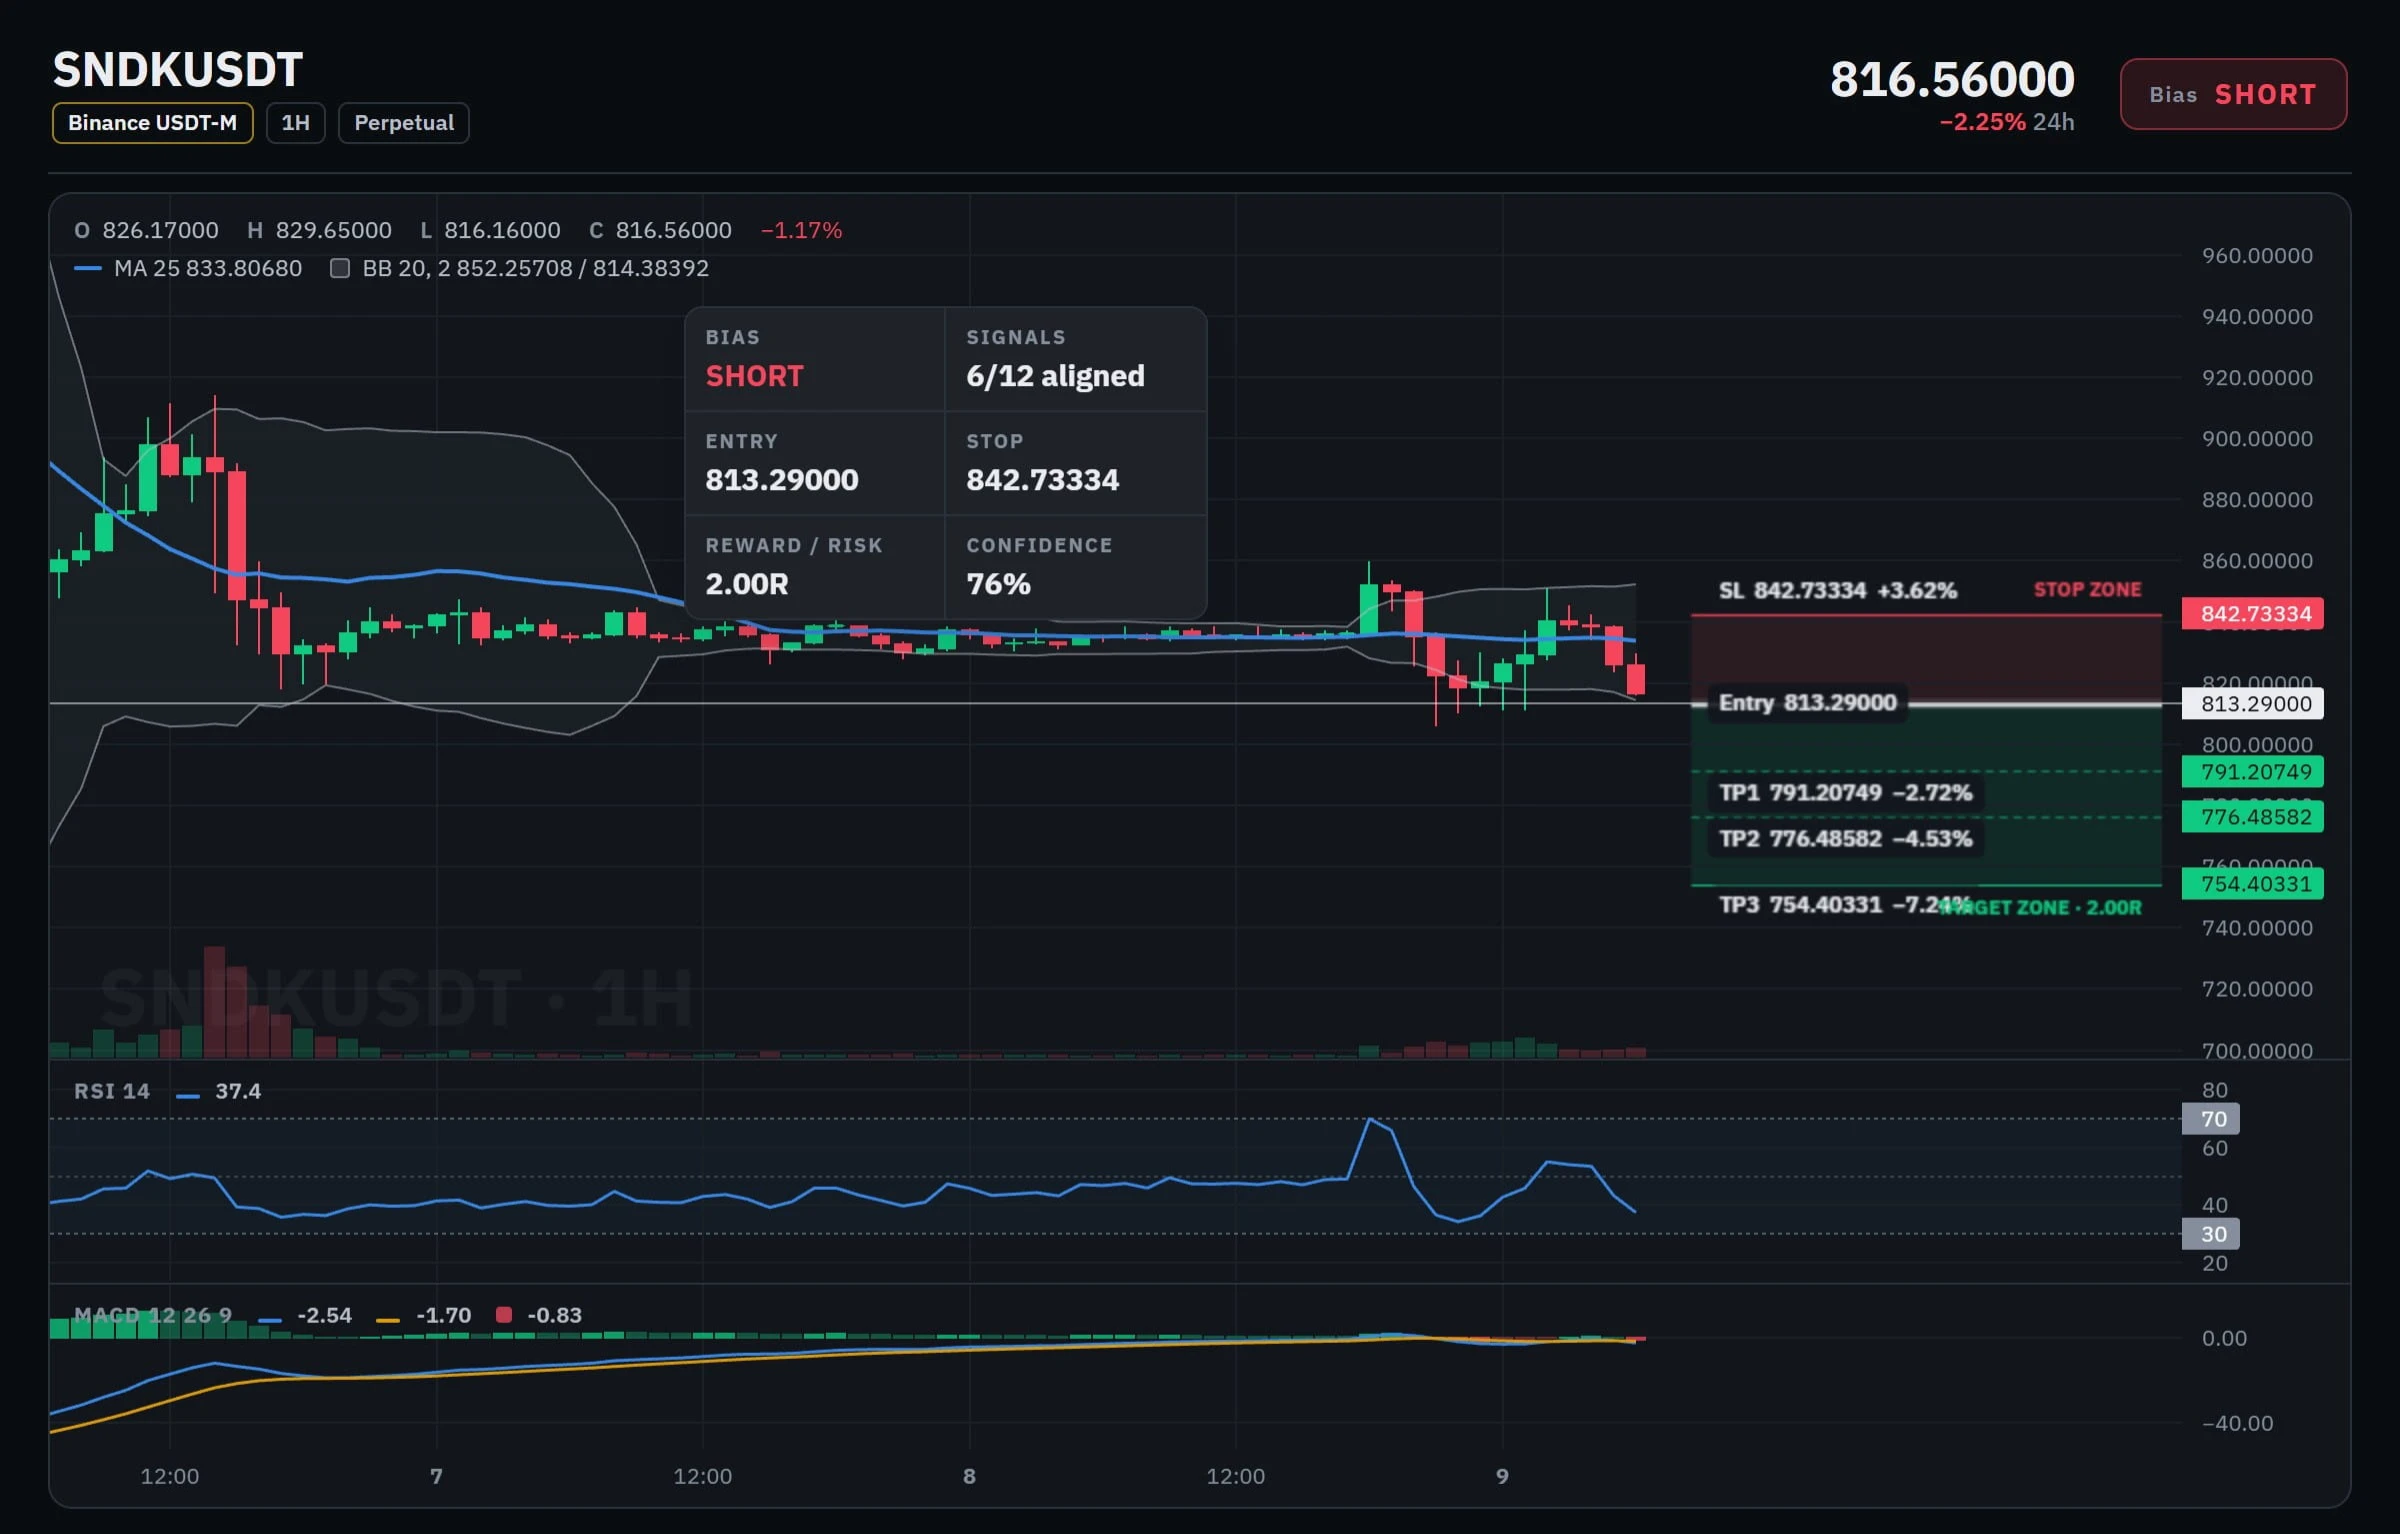
GRAVITY IS TAKING OVER $SNDK Ready to plunge?! 76% high-confidence short setup

$SNDK USDT

Direction: SHORT

Entry Price: $813.29000

🛑 Stop Loss (SL): $842.73334

Profit Targets (TP):
TP1: $791.20749
TP2: $776.48582
TP3: $754.40331

$SNDK ‌
post-image
SNDK+3.53%
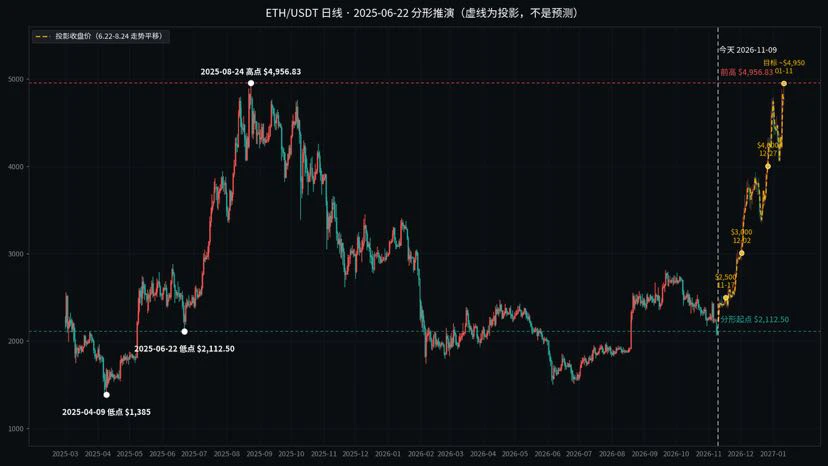
$ETH 11/17 2500 12/2 3000 12/27 4000, accumulate your positions and prepare for the major rally
post-image
ETH-1.26%
Trenches
Libra
L
bade
b
Libra
0xd2...4444
Market Cap
$.
Change
.
24h Vol
$.
Holders
.
牛逼
牛
bade
b
牛逼
0x96...7777
Market Cap
$.
Change
.
24h Vol
$.
Holders
.
BTC
B
bade
b
BTC
C5xp...pump
Market Cap
$.
Change
.
24h Vol
$.
Holders
.
STONK
S
bade
b
STONK
6GmA...UNgx
Market Cap
$.
Change
.
24h Vol
$.
Holders
.
ANSEM
A
bade
b
ANSEM
9cRC...pump
Market Cap
$.
Change
.
24h Vol
$.
Holders
.
With volatility rising, negative funding rates, and a fear index of 29, should you chase longs? My answer: You can lean bullish, but you must think through the worst-case scenario before placing an order.
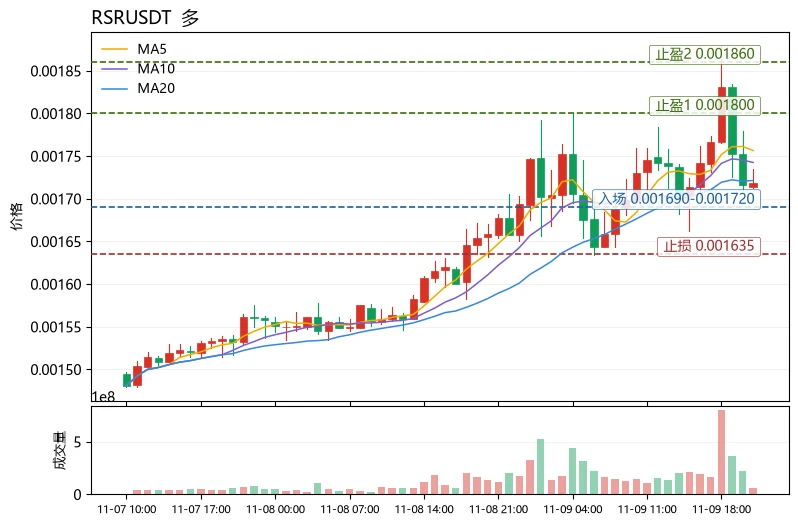
$RSR The current price is 0.001718. MA5 has crossed above MA20, and RSI at 52 is in neutral territory, but the MACD histogram remains negative and the 30-candle range is about 17.29%, indicating a weak bullish structure amid high volatility, not a confirmed trend. The funding rate of -0.2683% means shorts are paying; a short squeeze could trigger a sharp rally, but a rapid plunge is just as
post-image
NVDAB
NVDABNVDAB
Pump.Fun
MC:$3.5KHolders:1
4.36%
RSR-1.93%
WLD-5.61%
11.9 US Session Outlook: XAU & BTC$XAUUSD $BTC

XAUUSD

After rising early in the session, it pulled back from 4130. It is currently consolidating in a narrow range between 4080 and 4100, and has broken above the 4107 resistance zone since this post was written.

Support: 4075-4080 (1h, 4h), 4055-4060 (4h), around 4030 (4h), 3966-3985 (1day)

Resistance: 4142-4150 (1h, 4h), 4190-4217 (4h), 4256-4280 (1day, 1week)

BTC

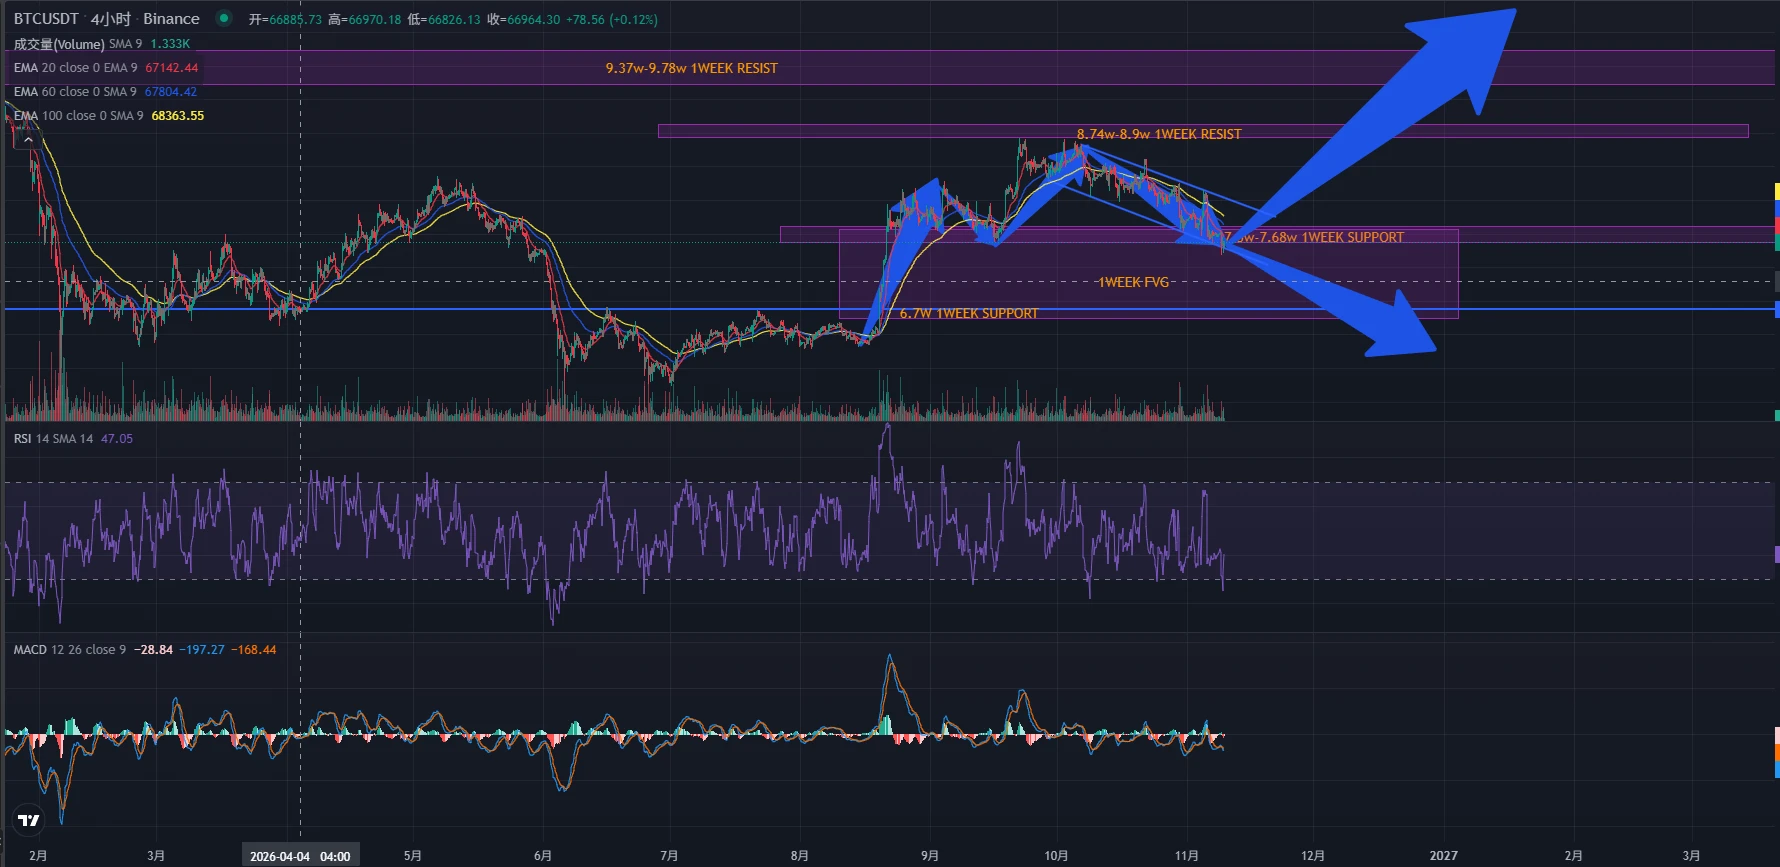
As feared, it happened: the scandal involving Nvidia’s Mr. Huang directly dragged US stocks down today. The pre-market was all red, causing the crypto market to crash along wit
post-image
XAUUSD+1.35%
BTC-0.65%
🔹AI Stocks Plunge, but Tech Giants Say Demand Hasn’t Disappeared! Is This AI Sell-Off an Overreacti
live-cover
LIVE2,639
Today, the market was choppy. In the afternoon, I seized a low-entry long opportunity and publicly shared a long entry around 4095–4100. The setup played out, securing 16 points of profit!$XAU ‌
XAU+0.38%
Jensen Huang's business partner, who once shocked society with an affair
He is Chey Tae-won, chairman of semiconductor giant SK Group
Chey Tae-won was originally married to Roh So-young, daughter of former South Korean President Roh Tae-woo, and was successful in both business and politics
But after he had a mistress and an illegitimate daughter, the couple became embroiled in divorce proceedings
In the latest ruling, his ex-wife Roh So-young was awarded 944 billion won (about NT$22.3 billion)
Making her an ultra-wealthy single woman!
His mistress, Kim Hee-young, also has an interesting backgr
My CPI Trading Playbook: Don’t Guess the Data, Just Trade the “Expectation Gap”

Guys, CPI drops tomorrow night. I’m skipping the lofty macro talk today and getting straight to the point: here’s my personal trading playbook for CPI night.

When faced with a major event like this, many beginners like to guess the data and watch analysts’ forecasts all day. But guessing the data is the dumbest thing you can do. The data is made up by analysts, but market moves are driven by real money. My rule is: don’t guess the data; just trade the “expectation gap.”

My playbook has three steps:

Step one, be
BTC-0.65%
TRON and Cronos Record Sharp Increase in Developer Activity
According to data from @chainspect_app, development activity on both the TRON and Cronos blockchains increased significantly over the past month.
• TRON (TRX): Developer commits rose 15.11%.
• Cronos (CRO): Developer commits rose 13.33%.
TRON currently ranks #28, while Cronos ranks #34 in developer activity.
Notably, development activity continues to expand across both ecosystems. For TRON, this is a positive signal that the team is continuing to build and improve the network, rather than relying solely on the strength of its existin
post-image
Bitcoin ETFs saw a net outflow of $412 millionwith BlackRocks IBIT posting a net outflow of $403 m
live-cover
LIVE2,945
PIEVERSE | Long 🟢 | Bullish | 15-minute, 24 hours: +17.93% | Volume: 36.3M USDT
Long rationale: Price is above EMA200; EMA20/50/200 are in a bullish alignment; RSI14 is 68.0; MACD histogram is positive; ADX14 is 61.7; volume is 1.69 times the average of the past 20 candles; trend pullback/continuation. Entry: 1.7891 Stop loss: 1.63678 Take-profit 1: 1.97949 | Take-profit 2: 2.09373 | Take-profit 3: 2.24605
Entry levels are for reference only; do not chase the price. The strategy is invalidated if the stop-loss level is hit. Technical analysis only; this is not investment advice. $PIEVERSE
post-image
PIEVERSE+0.58%
Me, who wants to go full-time,
after seeing this,
feels like
the sky is falling😭😭😭
post-image
$HANA After today's 25.61% bullish candle, people in the group are already shouting, “The halving rally has started early.” Don't get carried away—let's lay out the real-time data and compare it with history: the current price is 0.0170, the 24h low is 0.0135 and the high is 0.0198, with 67.3M in trading volume. Compared with the mid-stage rallies before the past three halvings, this volume only qualifies as a “sentiment recovery,” not “confirmation of a major uptrend.” In the 3-6 months before each halving, there has historically been a sharp 20%-40% rally, followed by a 30%-50% pullback to s
HANA-3.22%
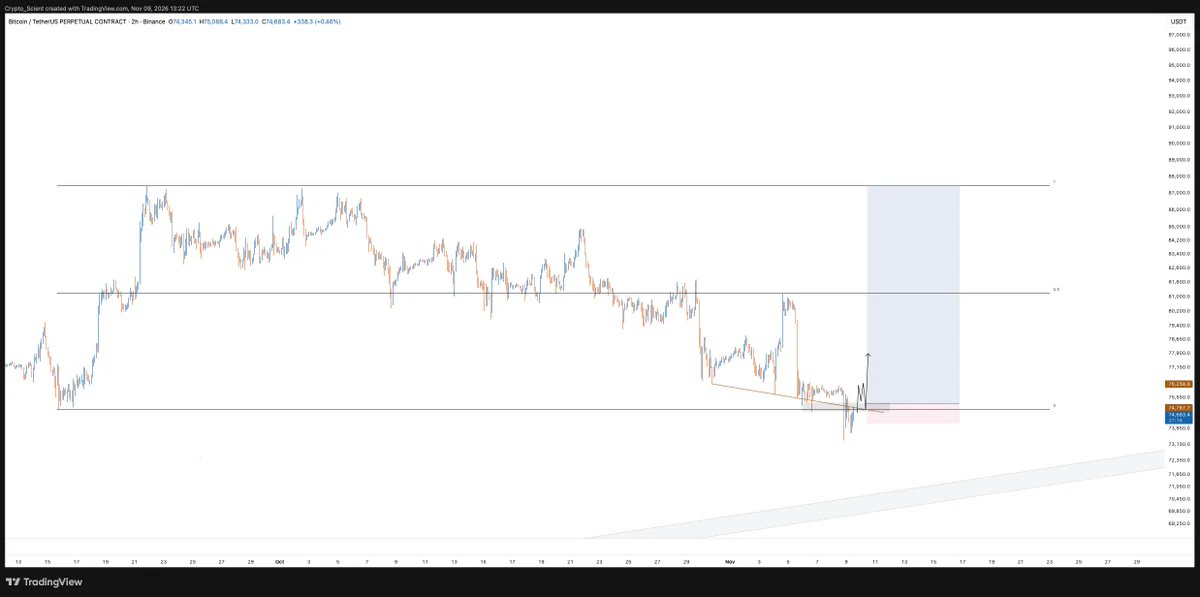
bitcoin:native can offer a nice scalp long if the 75k low is reclaimed on 4h.
Given the trigger it can squeeze quickly to range mid and potentially highs in no time.
#BTCUSDT
post-image
BTC-0.67%
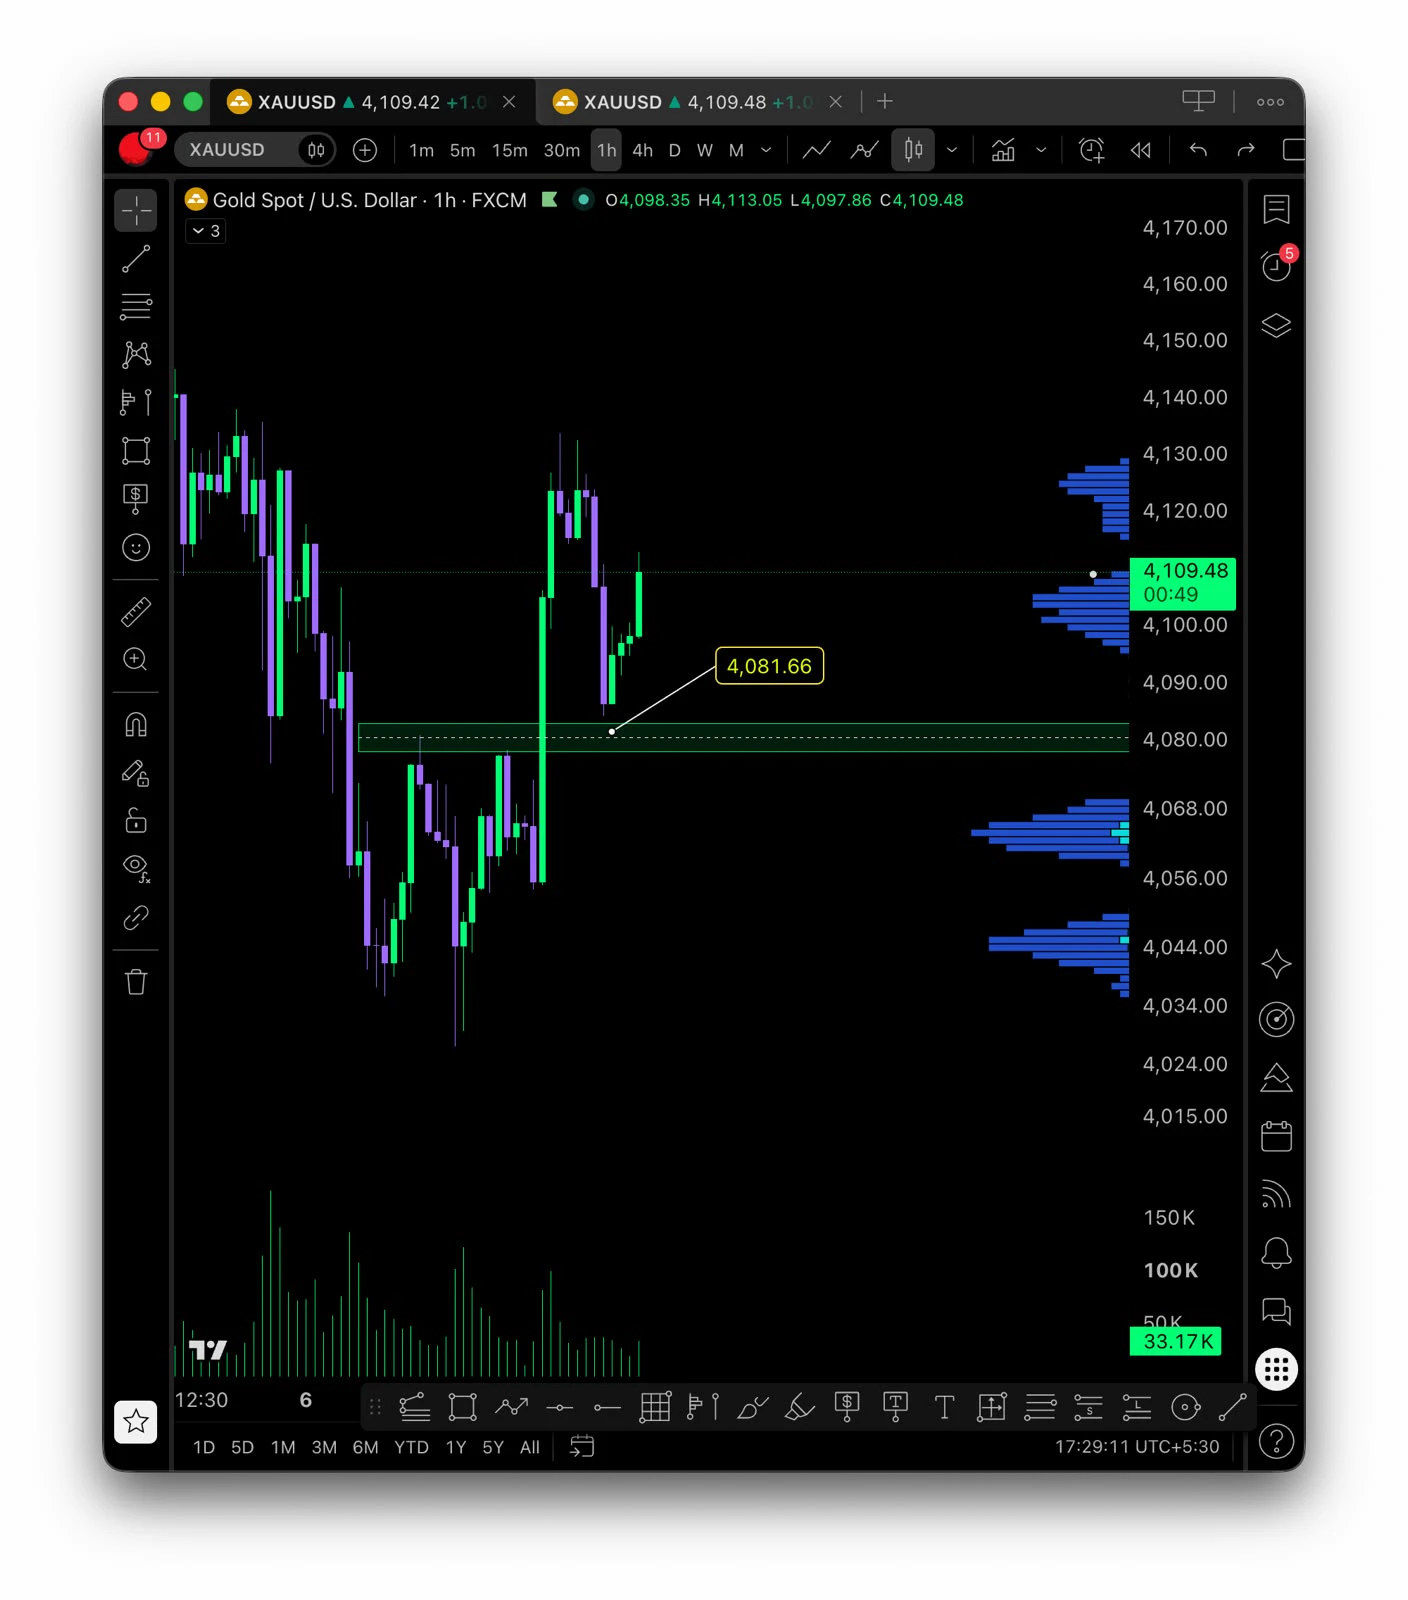
$XAU USD – GOLD TRADE SETUP

Entry Zone: 4,100 – 4,105

Take Profit Levels:

* TP1: 4,120

* TP2: 4,130

* TP3: 4,140

Stop Loss (SL): 4,074

Technical Analysis:

Gold is showing a bullish recovery after bouncing from the 4,080 support zone. Buyers have stepped in, pushing price back toward 4,110. The next important resistance levels are around 4,120 and 4,130.

Confirmation: Look for a successful retest of 4,100–4,105 before entering LONG.

Invalidation: A 1H candle closing below 4,078 weakens the bullish setup.

Educational technical setup based on your screenshot, not a guaranteed trade. Ma
post-image
XAU+0.38%
CL-1.83%
ON+4.50%
ZEC+1.29%
BNB-0.72%
$BTW /USDT Breakdown Is Accelerating — Tonight’s Strongest Setup! 🔥

$BTW /USDT

Trade Direction: SHORT

Entry Price: 1.0674000

Stop-Loss Price: 1.1448799

Profit Targets
TP1: 1.0092901
TP2: 0.9705502
TP3: 0.9124403

$BTW ‌
BTW-7.75%
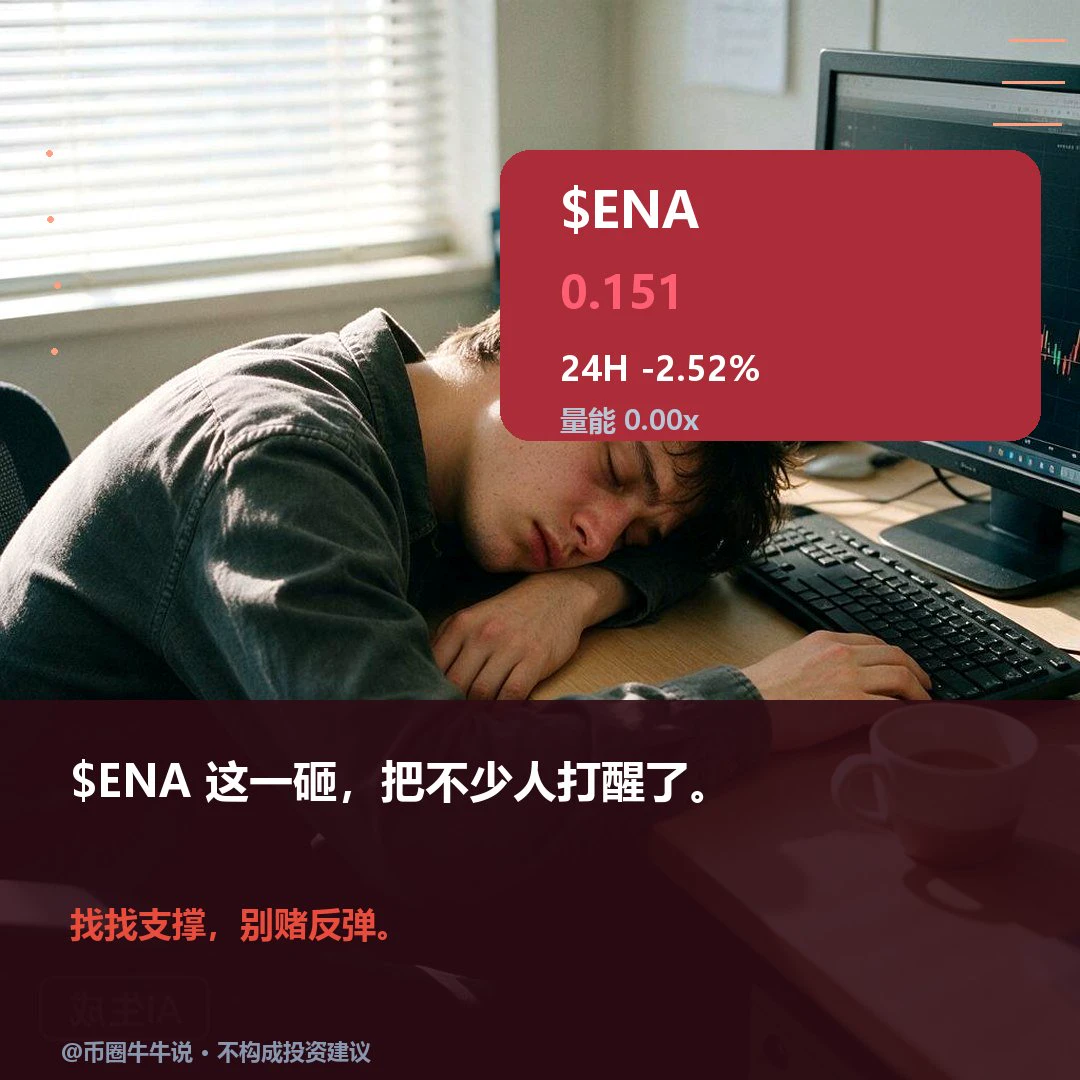
$ENA Currently at 0.151, down 2.5% over 24H. The 1H trend is weak, with EMA20 at 0.1514, RSI at 56.9, resistance at 0.1558, and support at 0.1441; the 4H trend is weak, with EMA20 at 0.1569, RSI at 31.0, resistance at 0.1718, and support at 0.1441. A move higher requires holding above the 0.1558 resistance; a break below the 0.1441 support would weaken the structure. Going forward, monitor whether 0.1558 can be held and whether price can recover after losing 0.1441; a break below 0.1441 with no recovery invalidates the setup. Markets are volatile; for observation only.
post-image
ENA+8.04%
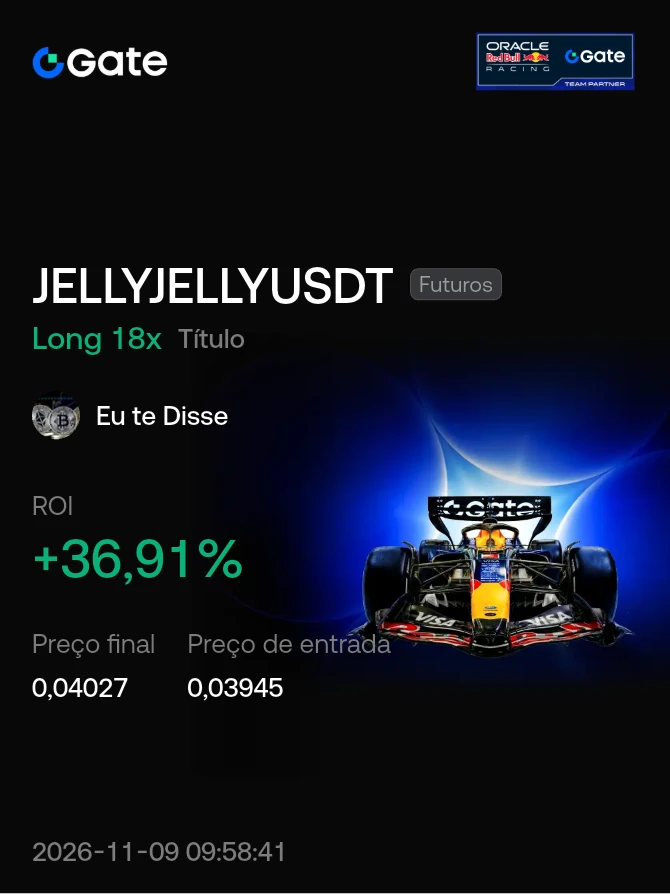
#Share My Holding Returns#
I'm still here
$JELLYJELLY
post-image
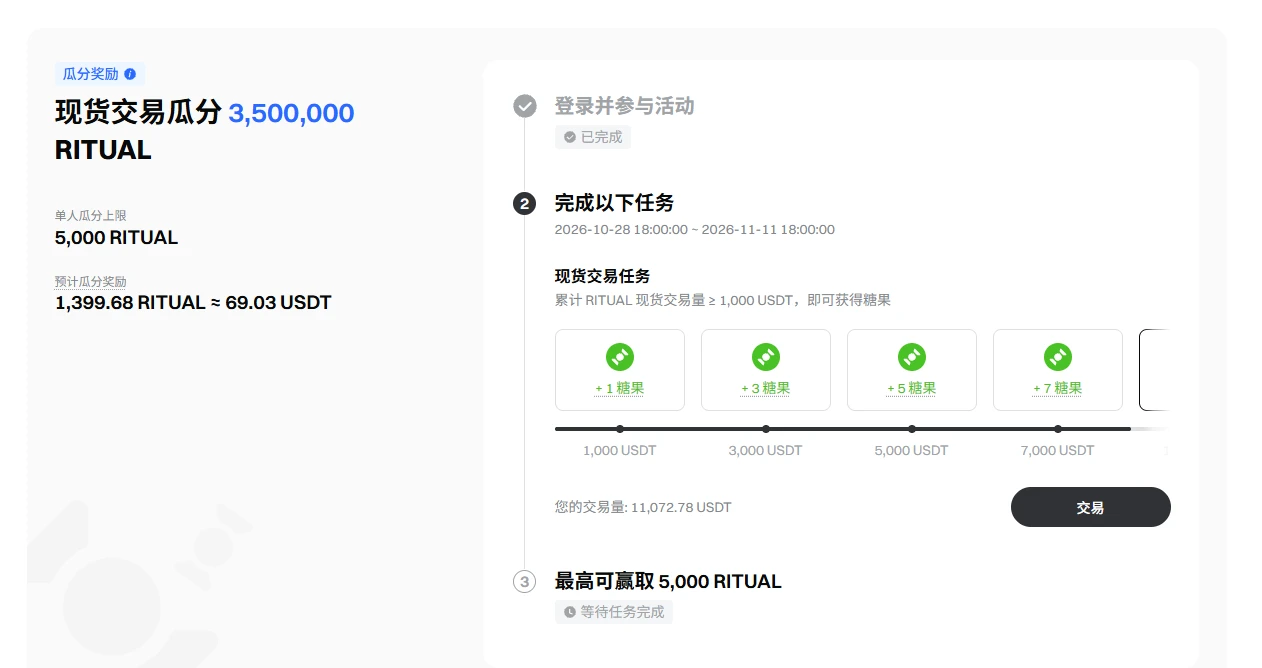
The ritual market-making grid strategy has been running for 20 hours and has easily completed 1,000 trades, with a total trading volume of 10,000. I casually claimed some candy.
However, as trading volume surged this afternoon, the candy rewards dropped quite a bit, which is disappointing.
Feel free to leave a comment or come chat with me in the livestream if there's anything you'd like to discuss~

‍$BTC $SOL $NOS
post-image
BTC-0.67%
SOL-0.77%
NOS-1.40%
Load More

Join 40 M users in our growing community

⚡️ Join 40 M users in the crypto craze discussion

💬 Engage with your favorite top creators

👍 See what interests you

Trending Topics

USCPIDataIncoming

34.28k Views1.95k Discussing

The U.S. October CPI report will be released on November 10 at 8:30 a.m. ET. September CPI came in at 3.7% year over year, and markets will be watching closely for signs that inflation is cooling, especially in core CPI. A softer-than-expected reading could strengthen rate-cut expectations, while hotter inflation may pressure risk assets through higher Treasury yields and a stronger dollar. How do you think this CPI print will move $BTC, U.S. stocks and gold?

RedBullDoublePodiumInBrazil

5.19k Views30.57k Discussing

BTCFlashCrash

135.82k Views66.42k Discussing
View More