Square
Following
Hot
News
Profile

49th

vip
Active for: 8.8y
Peak Tier 6
This is the translated content: Where every year my heart breaks, on a bright moonlit night, at the short pine hill.
3
Following
33
Followers
69
Liked
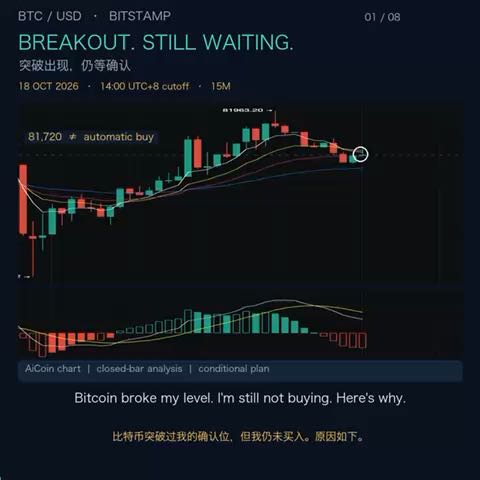
$BTC Bitcoin broke $81,720—so why am I still not buying? Watch my 2-minute breakdown of the confirmation I’m waiting for before going long. $BTC
BTC+0.15%
#BTC突破80000美元,能否站稳新关口
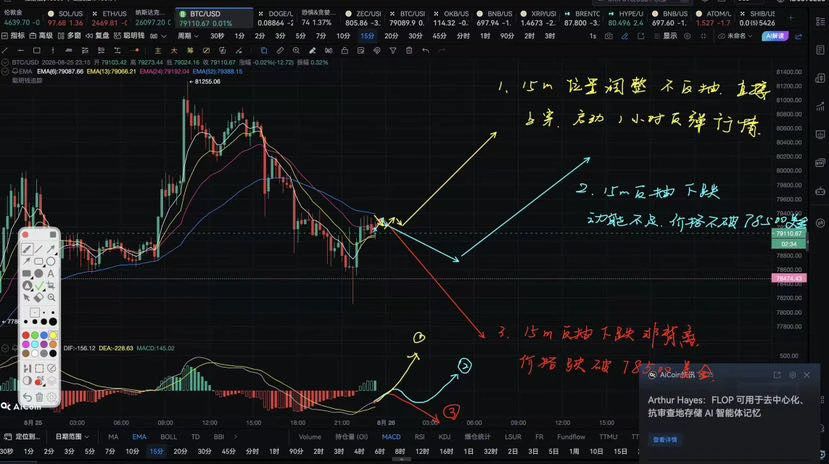
Focus on the current adjustment in BTC's 1-hour chart. The 15-minute chart within the 1-hour timeframe will determine how the 1-hour chart evolves.
1. If the price directly breaks above the zero line at this 15-minute level, the 1-hour chart will initiate a rebound. After the rebound begins, watch how far the rebound strength can take the 1-hour chart.
2. If the rebound momentum is insufficient at this 15-minute level and the price does not fall below $78,500, the 1-hour trend will continue to rebound. Then watch the rebound strength.
3. If the rebound at this 15-minute
post-image
BTC+0.15%
#BTC突破$74000
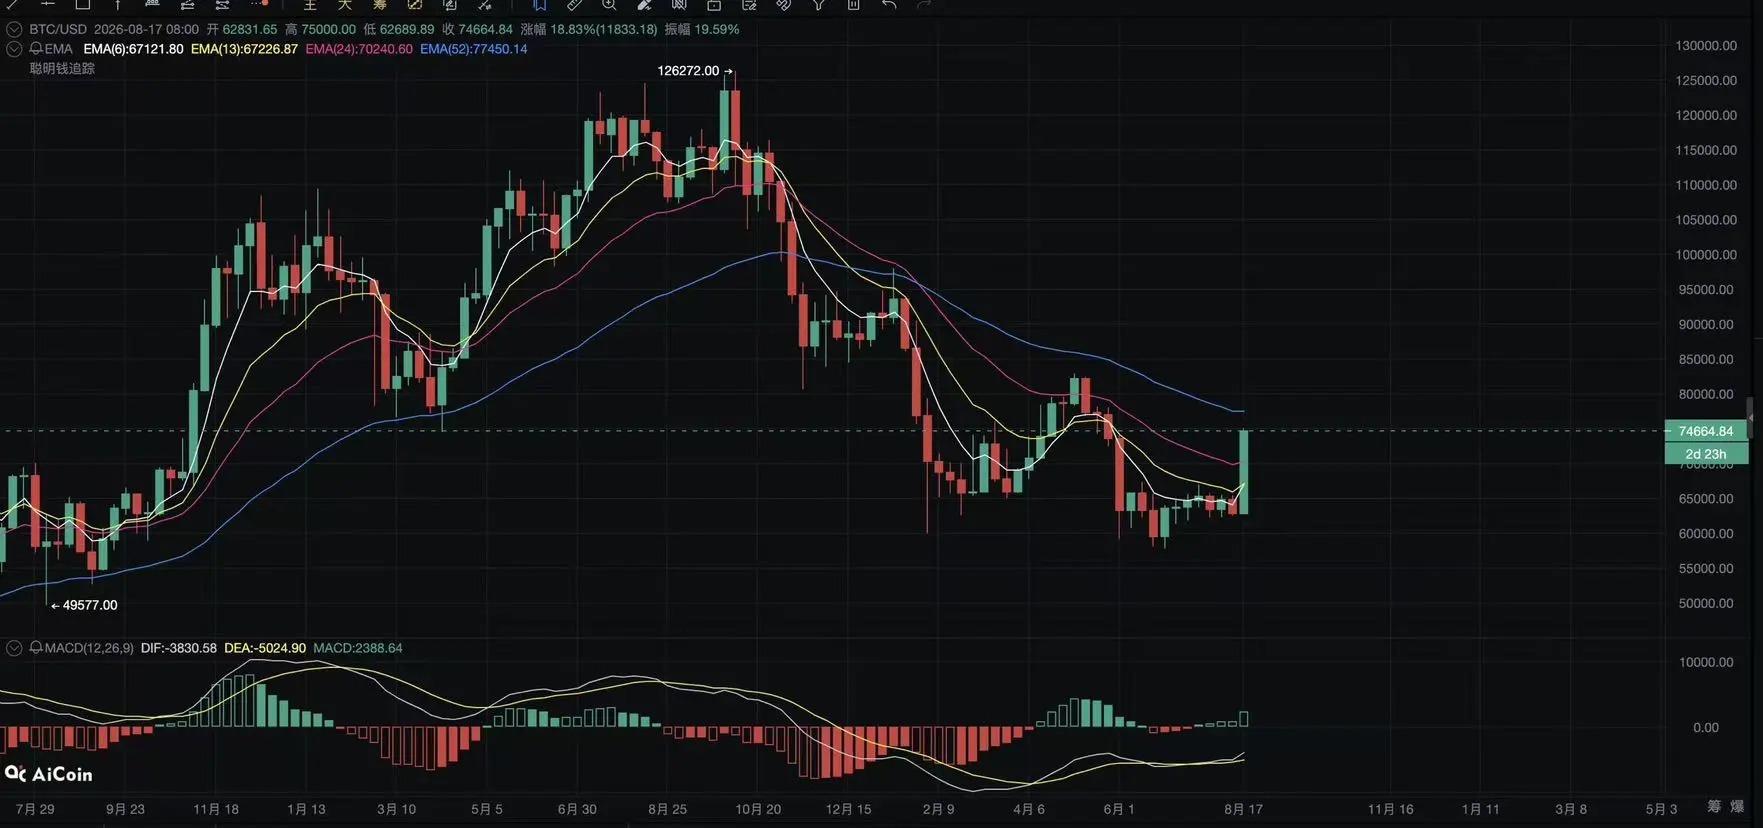
BTC’s price has already reached $75,000, approaching the 5-day EMA52. The next price level is around the weekly EMA52 at $77,400. There are currently substantial short positions at high levels on lower time frames, so for the lower time frames, the price needs to keep rebounding and break above $75,000. When the price approaches $77,400, pay close attention to the high-level short positions on the 1H chart and whether bearish divergence appears on time frames below 1H. If it does, the market will need a brief adjustment.
$BTC ‌
post-image
BTC+0.15%
#BTC升破69000美元日内涨幅6.43%
BTC previously mentioned that if the price broke above $6,4000, the market trend would shift from bearish to bullish. The current rally has reached around the EMA52 price on the 3D chart, with close attention on the pullback in the $69,000-$69,500 price range.
This rally has mainly been driven by short liquidations. The real test is whether forced buying can give way to genuine demand—that is, whether real buying can continue to power the market after the short-squeeze “stampede effect” ends. Also watch the support zone at $67,000-$67,800: as long as it holds, the adjus
BTC+0.15%
$BTC
Market assessment:
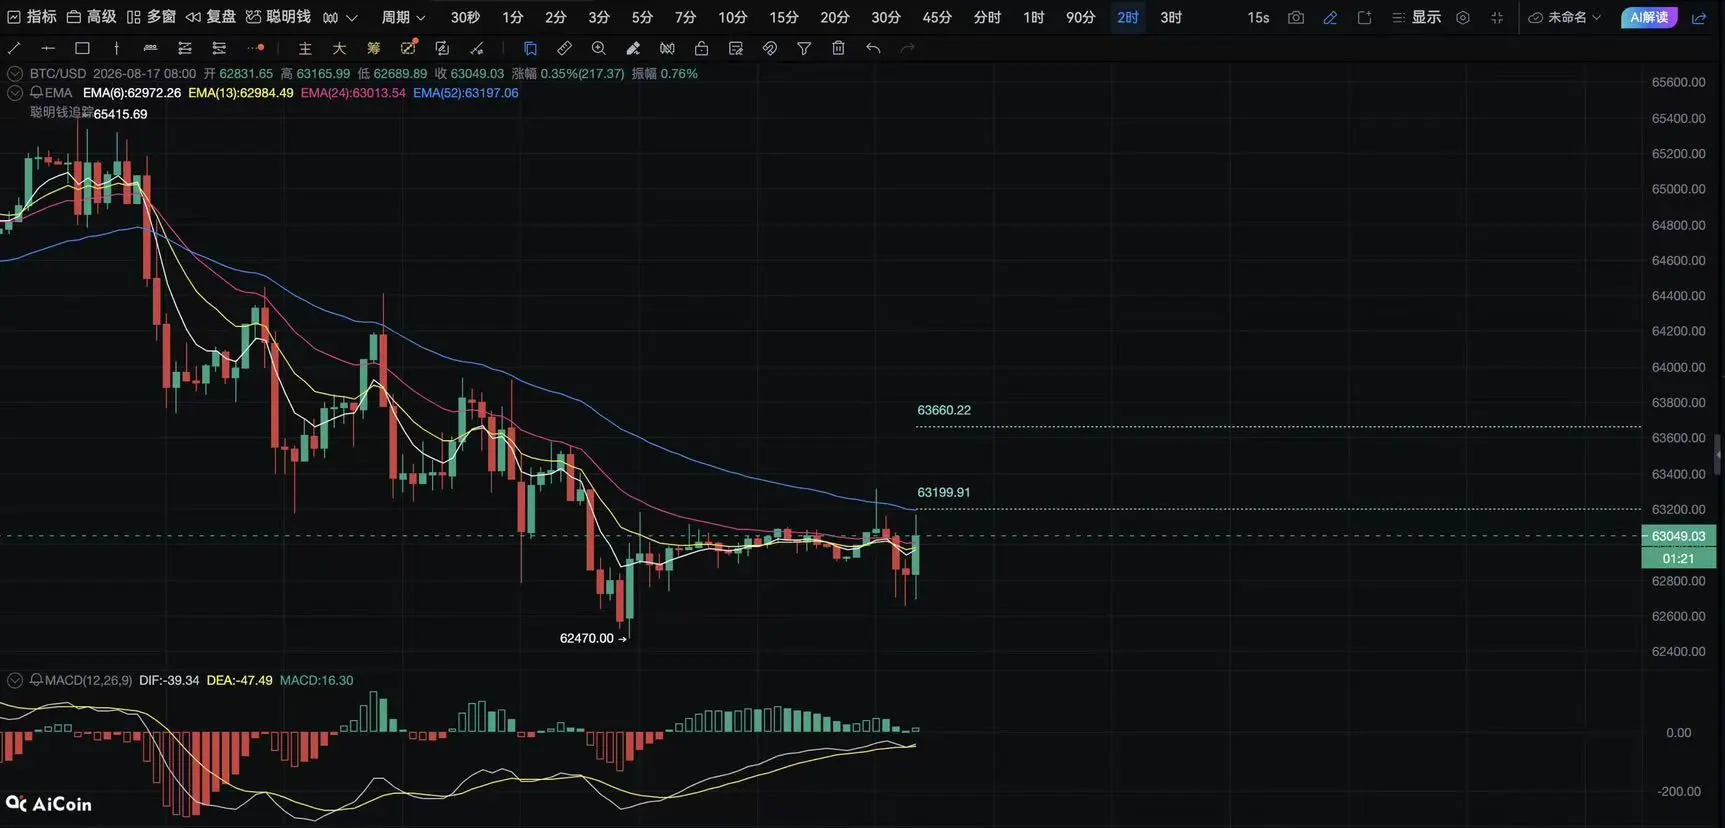
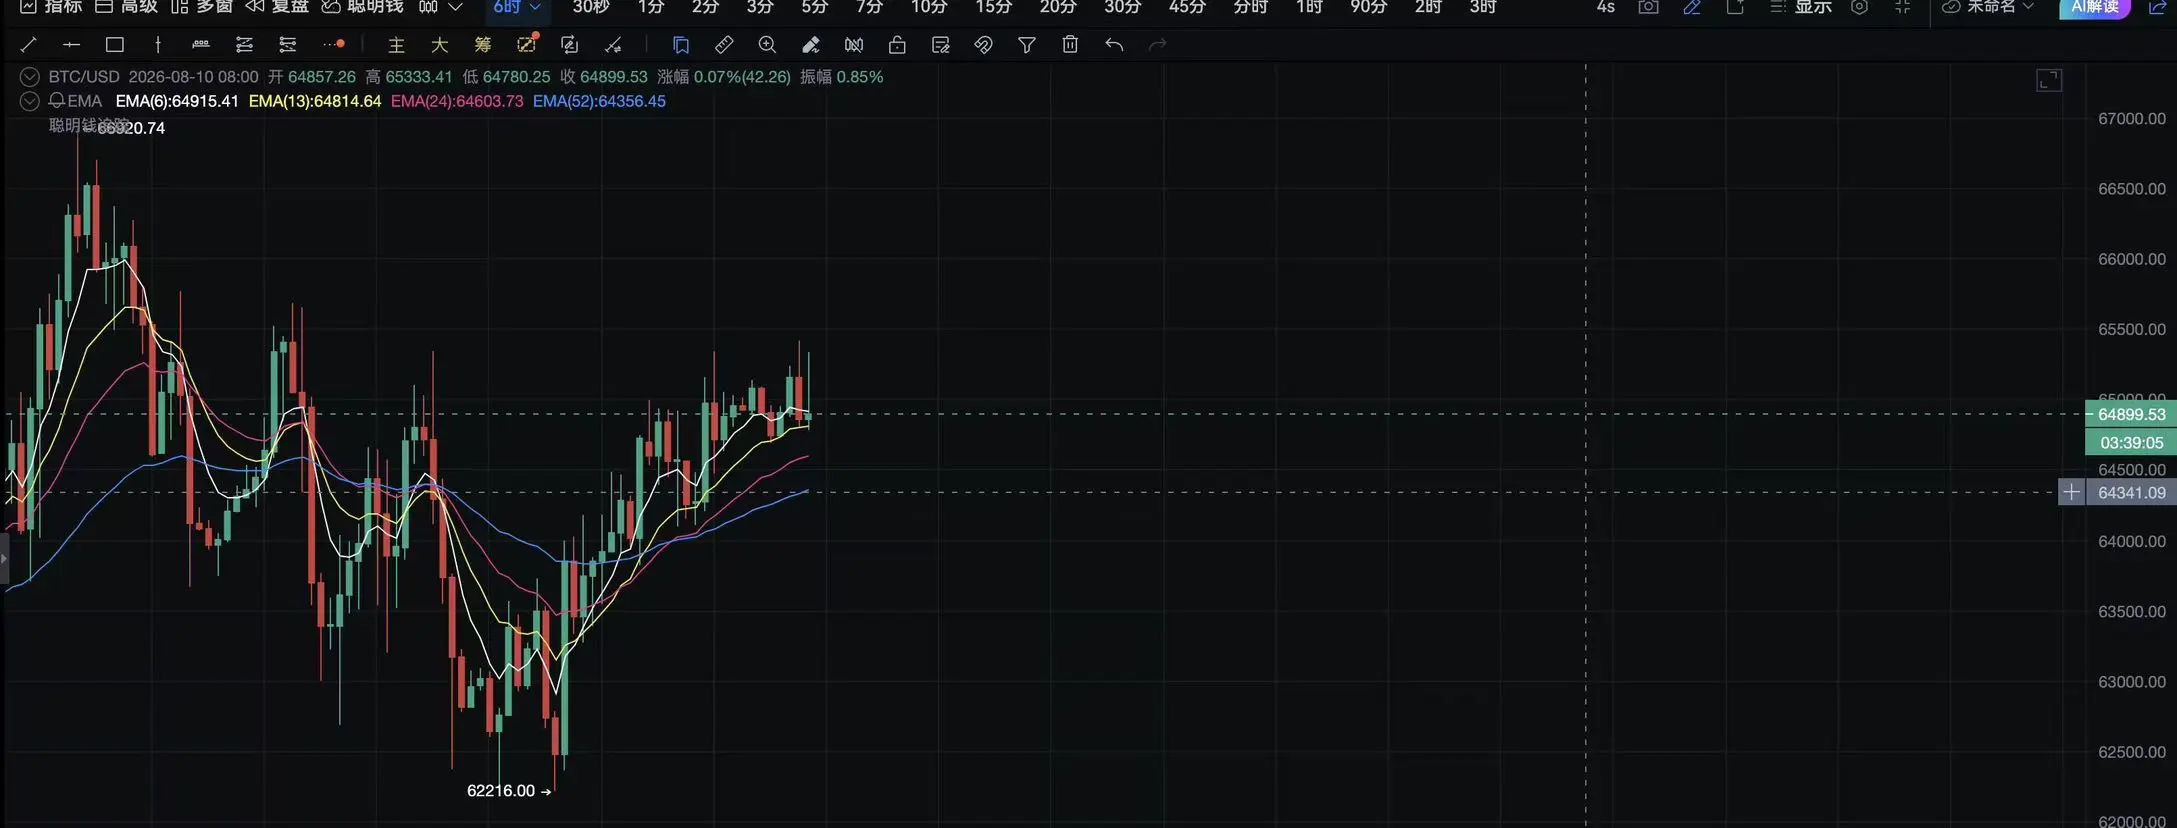
BTC is currently trading in the lower-boundary zone of a large range ($62,500-$66,000). Bullish divergence has emerged on smaller timeframes, but capital flows remain weak, so the two have not yet formed a confluence.
Key trading points:
For longs, wait for a sustained move above $63,200/$64,000; for shorts, wait for a break below $62,500 or confirmation of resistance around $63,300. Do not chase trades in the middle zone.
Core risk control:
If $62,500 breaks, beware of the risk of a rapid decline to $61,000-$60,000; if $64,000 breaks upward, shorts should exit promptl
post-image
BTC+0.15%
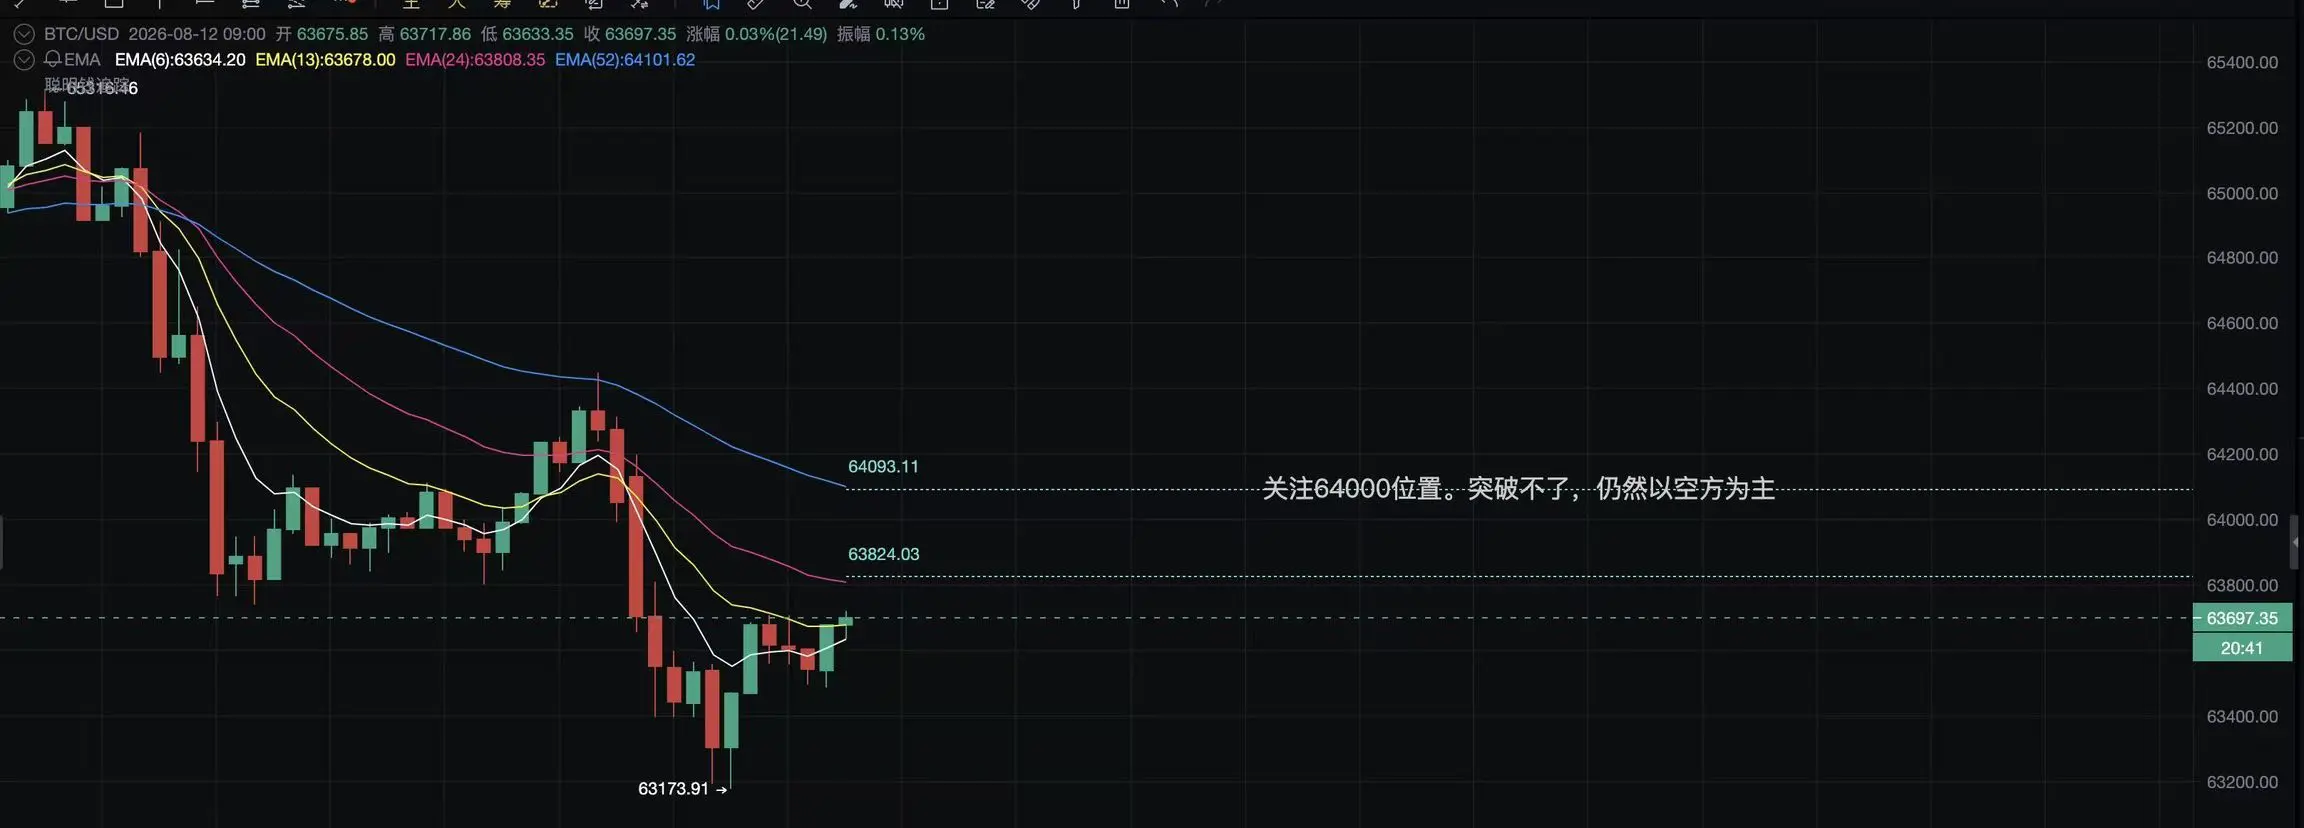
#CPI, $BTC Watch around the $64,000 level.
Pay attention to tonight's CPI data📊.
post-image
BTC+0.14%
#BTC $BTC ‌
BTC is currently engaged in a **“tough battle” at the $65,000 resistance level**. If it breaks through effectively and holds, the rebound could extend to $67,000-$70,000; if it fails, the risk of a pullback will increase, and attention should be paid to the strength of the $64,000 support. Hold as long as it does not break; if it breaks, a shorting opportunity will arise.
post-image
BTC+0.15%
  • 2
  • 1
#btc $BTC
$65,150 - $65,400: Intraday short-term resistance, marking the “ceiling” of the previous daily-chart rebound. A close above $65,150 would be the first strong evidence of a strengthening trend.
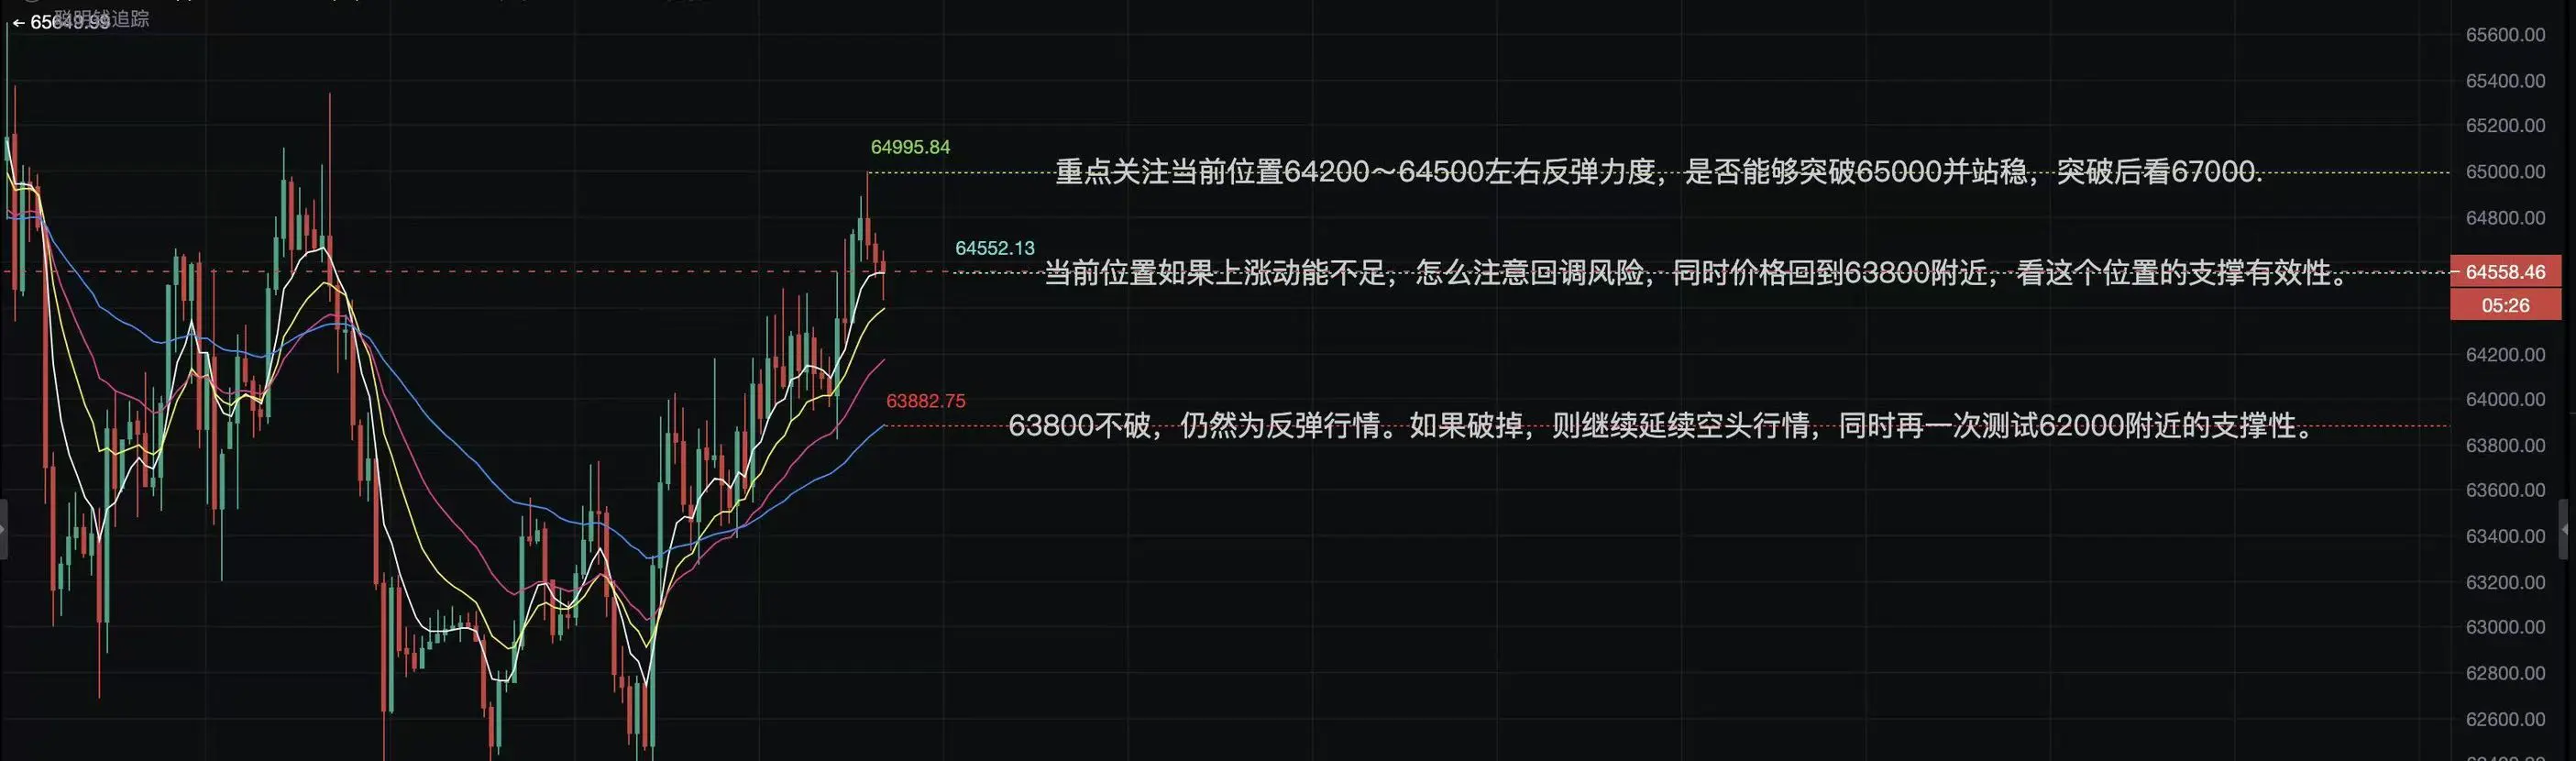
Focus on the strength of the rebound from the current area around 64,200–64,500 and whether it can break above and hold $65,000. After a breakout, watch $67,000. If upward momentum is insufficient, be alert to the risk of a pullback. If the price returns to around $63,800, monitor whether support at this level holds. As long as $63,800 is not broken, the rebound remains intact. If it breaks, t
post-image
BTC+0.15%
$BTC ‌BTC is currently in the “technical rebound” phase under large-scale bearish pressure
1. Buyer support: “buy walls” are lurking below
In the range 2%-20% below $63,000, there are large amounts of passive buy orders placed since early June. This means:
If the price falls back to the $62,000-$62,500 zone, it may trigger buy-side buffering and limit the downside. It is also key support near a pivot point—if it breaks, the bearish trend will accelerate!
At the same time, these orders also suggest that some large capital is waiting to enter at lower prices rather than chasing—indirectly confi
BTC+0.15%
  • 43
$BTC #BTC行情分析
Current market read: BTC is in a “compression and momentum-building” state under large-scale bearish pressure. The market is waiting for a catalyst to determine direction.
Optimal strategy:
Short: wait for a rebound to the $64,000 area, enter after signs of exhaustion appear, and set the stop loss above $65,000. Target $62,200 - $61,774.
Go long (cautious): the market has not yet exited a trending phase. You can test the waters with a small order; if the price holds near $62,200 and shows a “bottom reversal” structure, you can try a small long position.
BTC+0.15%