

Share your thoughts
placeholder
Article
Markets trading as if the war will be announced over this weekend👀
post-image
Nobody is talking about the $SNDK /USDT trap forming right now.

$SNDK /USDT - SHORT

Trade Plan:
Entry: 1732.52 – 1741.46
SL: 1792.80
TP1: 1695.13
TP2: 1667.23
TP3: 1625.37

Why this setup?
Why now? The daily trend is range, but the 1h price is holding at 1736.99 with a 15m RSI at 72.64, which signals exhaustion on the bounce. The 1h ATR of 17.888253 shows enough volatility to reach the entry zone between 1732.52 and 1741.46. A short here targets TP1 at 1695.13 and TP2 at 1667.23, with the invalidation level at 1623.04 acting as the hard line in the sand.

Debate:
Are we hitting TP2 or ge
SNDK+10.68%
Why is everyone suddenly ignoring $ENA /USDT right now?

$ENA /USDT - LONG

Trade Plan:
Entry: 0.16609 – 0.16785
SL: 0.15856
TP1: 0.17328
TP2: 0.17748
TP3: 0.18379

Why this setup?
Why now? The daily trend is bullish and the 1h price is sitting at 0.16699, which means the market has already moved into the entry zone defined by 0.16609 to 0.16785. The 15m RSI is at 58.02, showing room to run before overbought territory while the 1h ATR of 0.003504 tells us the next hourly move could be substantial. If the long setup plays out, the first target is 0.17328 and the second target is 0.17748, wit
ENA+10.19%
$1000 to $100,000 Crypto Trade Challenge Today
live-cover
LIVE899
$SNDK
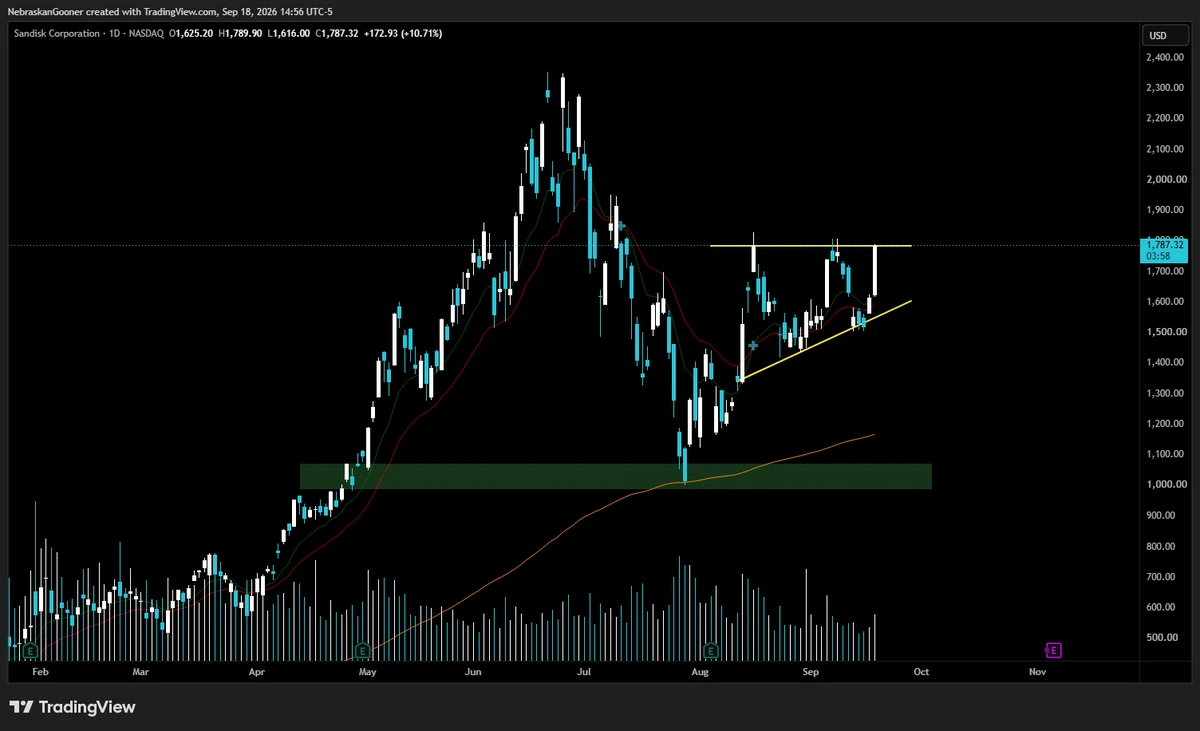
Nice structure here. Watch for a break out.
post-image
SNDK+11.05%
$UNI UNI has rebounded 2.7x from its low, with a smart-money trader’s profit nearing 1,000%
UNI is currently around $8.56, up approximately 26.6% over the past 24 hours and returning to the price range before the “1011” plunge. Compared with the previous swing low of approximately $2.3, it has rebounded approximately 272.1% in total. During the recovery, the UNI long position held by the address starting with 0xf21d has an unrealized profit of approximately $1.13M, making it the address’s most profitable current position. The address holds approximately 265.2k UNI with 10x isolated leverage, a
post-image
UNI+18.07%
$ETH ETHUSD | Rejection Expected From Major Resistance Zone
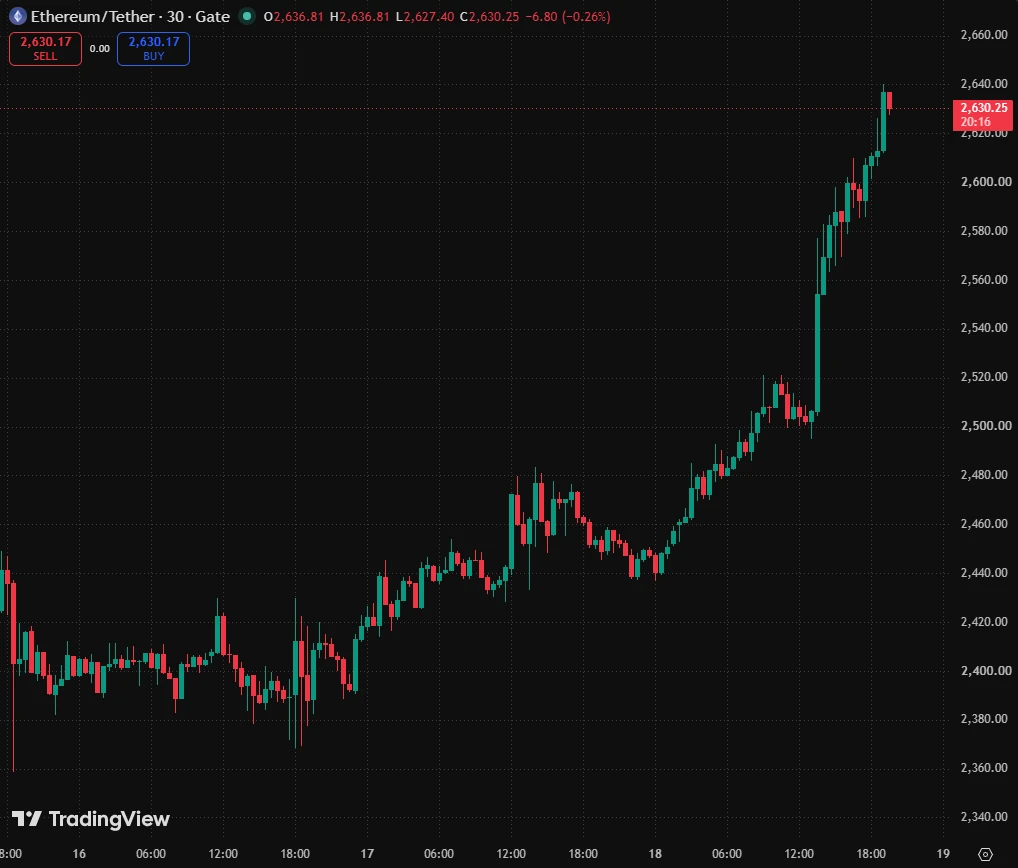
ETH has rallied aggressively into a key resistance area around 2630-2640, where price is testing the upper boundary of the current structure.
The current move appears extended in the short term, and I am monitoring this zone for signs of exhaustion or a liquidity sweep before a potential bearish rotation.
Bearish Scenario: ✅ Resistance: 2630-2640
Target 1: 2555
Target 2: 2485
Target 3: 2365
The overall idea is based on: • Resistance reaction at a significant supply zone
• Price trading near the upper trendline of the structure
• Po
post-image
ETH+7.16%
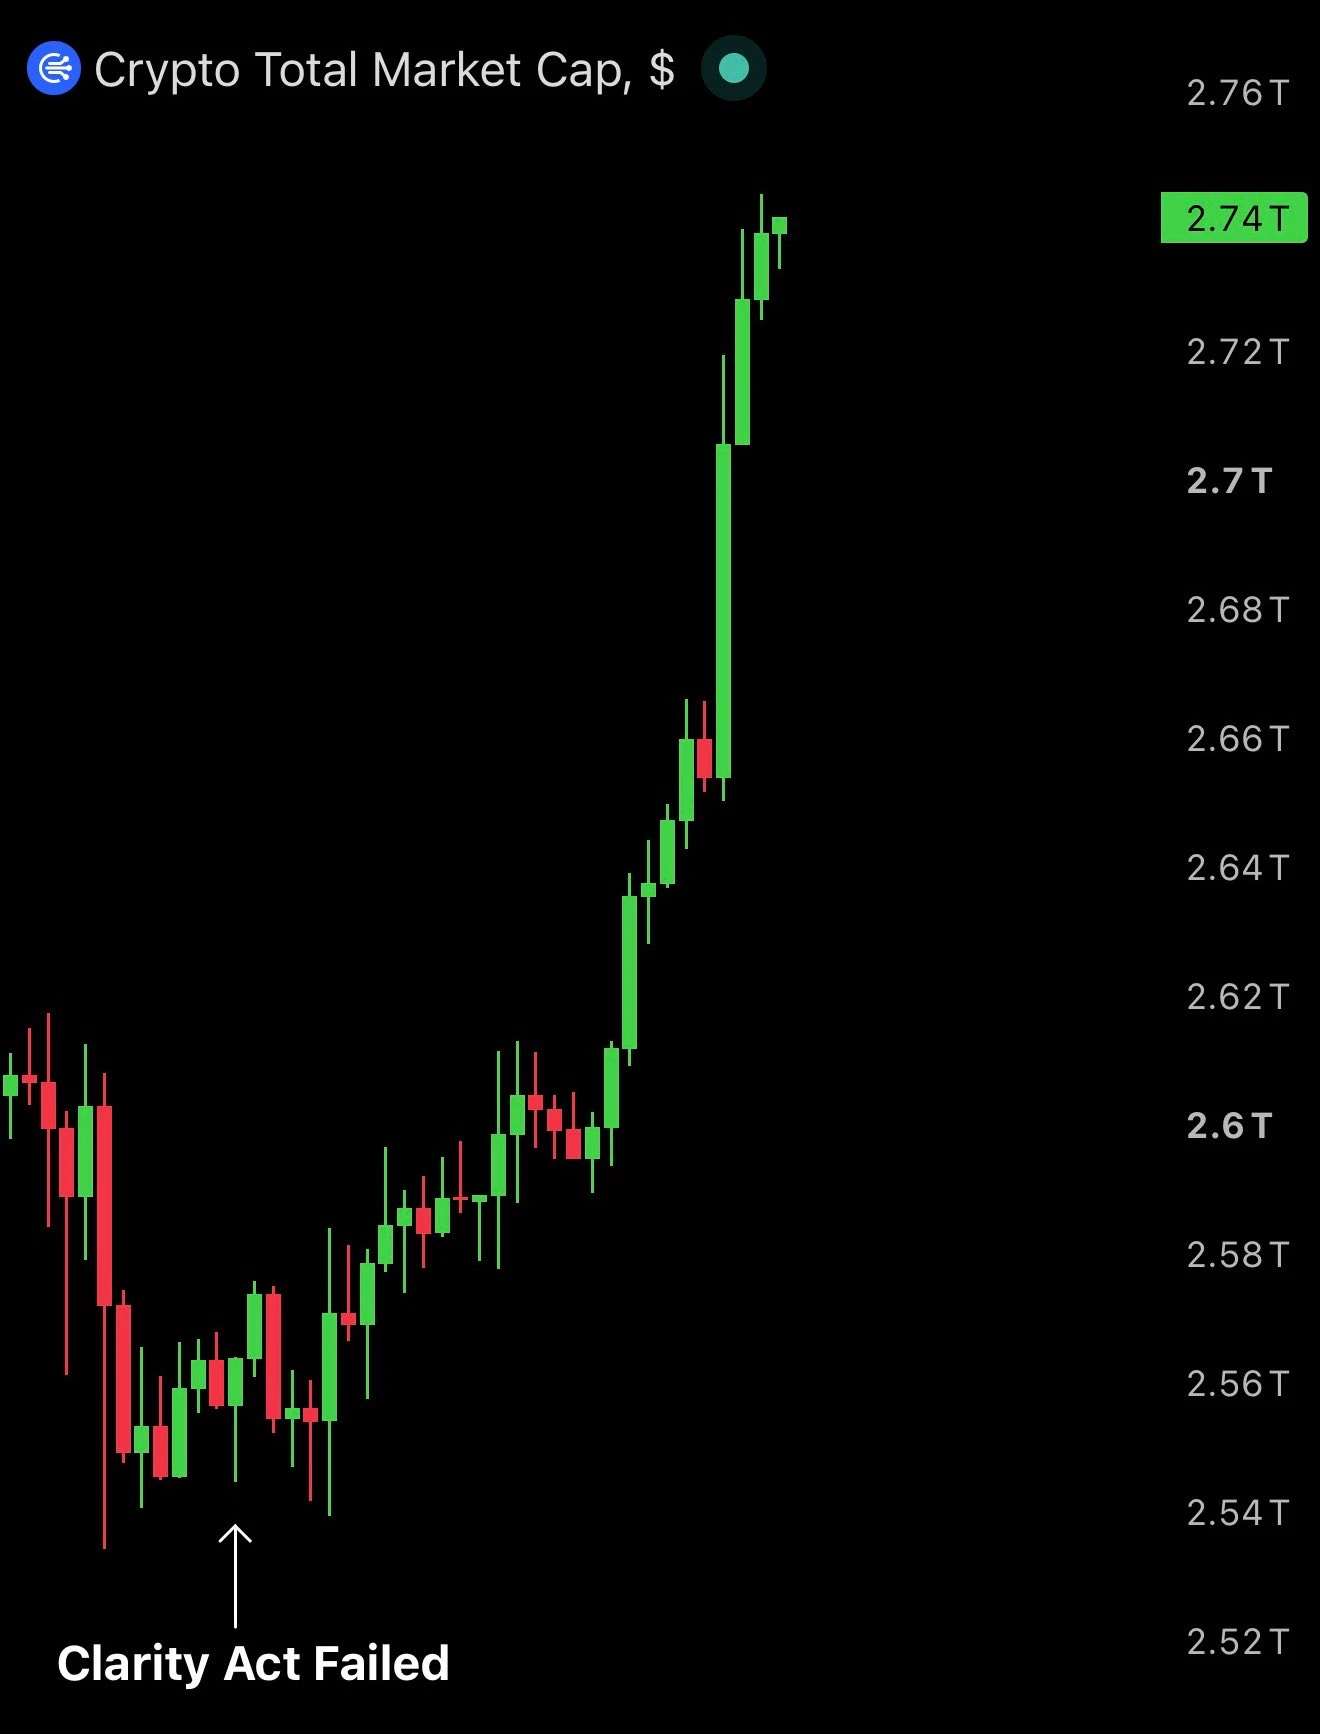
Everyone was worried about the CLARITY Act.
Meanwhile…
Crypto market cap just added $220 BILLION since the Senate setback.
Price action > headlines.
RESPECT THE PUMP. 🫡🚀
post-image
Everyone is calling for a breakout, but the data says short.

$ADA /USDT - SHORT

Trade Plan:
Entry: 0.2216 – 0.2230
SL: 0.2314
TP1: 0.2155
TP2: 0.2110
TP3: 0.2041

Why this setup?
Why now? The 1h price is stuck at 0.2223 inside a daily range, and the 15m RSI is at 69.61, showing that buyers are exhausted while sellers remain in control. The 1h ATR of 0.00291 tells us volatility is tight, so the next move will likely be explosive once a trigger hits. The setup targets TP1 at 0.2155, with a deeper objective at TP2 of 0.2110, both valid only as long as the invalidation level at 0.2086 holds.
ADA+10.33%
Okay , let me eat
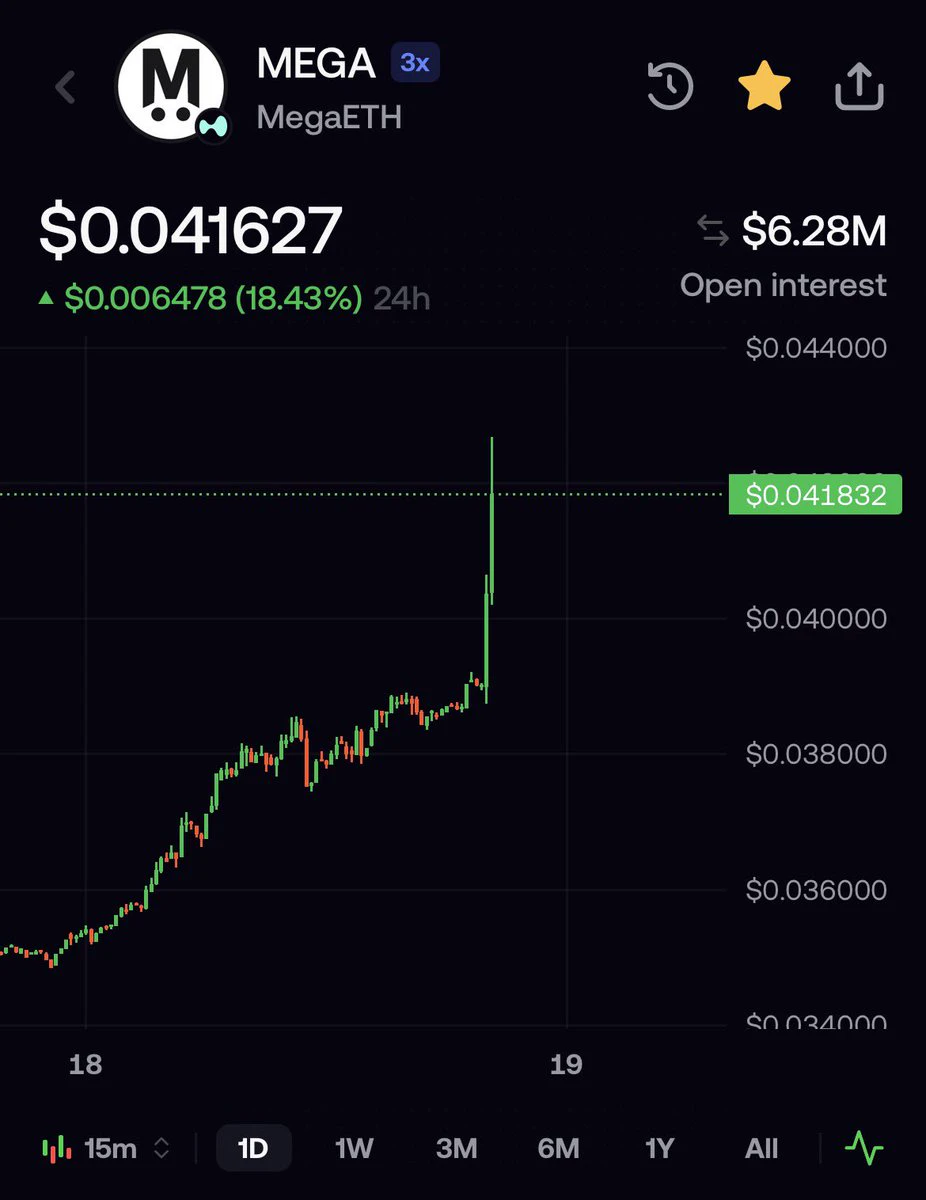
solana:megaA5QDK1qLXtjpvg9oCFMT9d5BCMrVTBddnM5kV pumped 20% after so many days
feeling alive again
post-image
SOL+11.98%
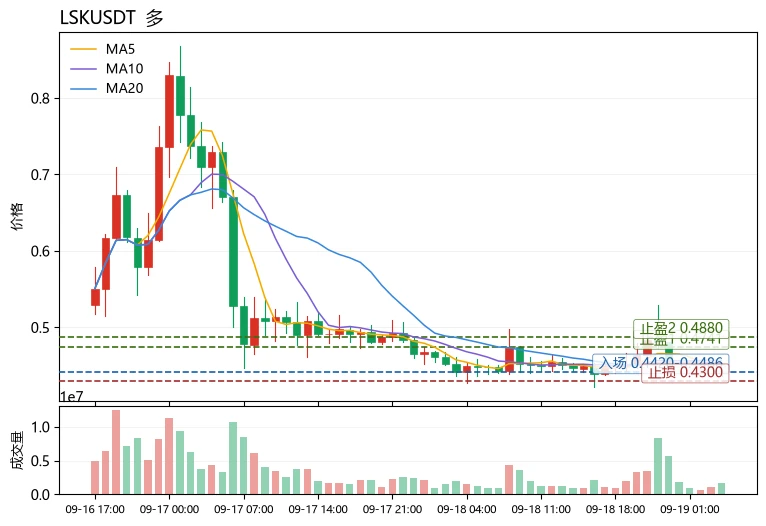
Many people instinctively want to go long when they see a negative funding rate, treating it as a signal that “shorts are giving away money”—this is a typical case of treating a single indicator as gospel. A negative funding rate only means that shorts are paying, not that the price cannot continue falling, especially while the moving averages are still suppressing the price.
$LS Current price is 0.4486, with MA5=0.44812 still below MA20=0.452995, meaning the medium-term moving averages have not yet been reclaimed; RSI=44.4 is neutral to weak, and although the MACD histogram is +0.001579, ind
post-image
LSK+0.25%
AVA-16.71%
ONDO+5.97%
Tong Ge’s 9.19 BTC outlook
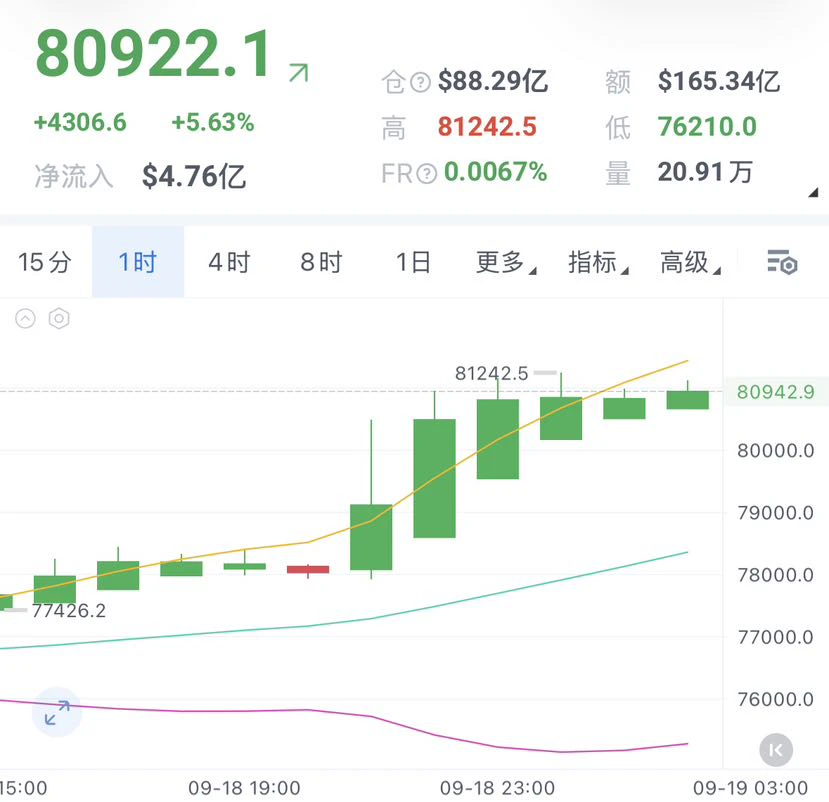
Enter shorts near $BTC 810-815, stop-loss at 820, target 800-795
If it pulls back to around 795-800, watch the buying support and take a small long position, stop-loss at 790, target 810-815.
Current price: 80922. BTC surged from 76210 all the way to 81242, directly reclaiming 80k.
This rally is indeed fierce, but the more rapid the pump, the less we should FOMO into longs.
Reclaiming 80k is a fact, but the 810-815 range above has also been a repeatedly contested area.
So don’t chase highs today; if it cannot break through, continue taking shorts.
If it truly holds a
post-image
BTC+5.74%
Today Market talk
live-cover
LIVE56
Scream for me Amsterdam,
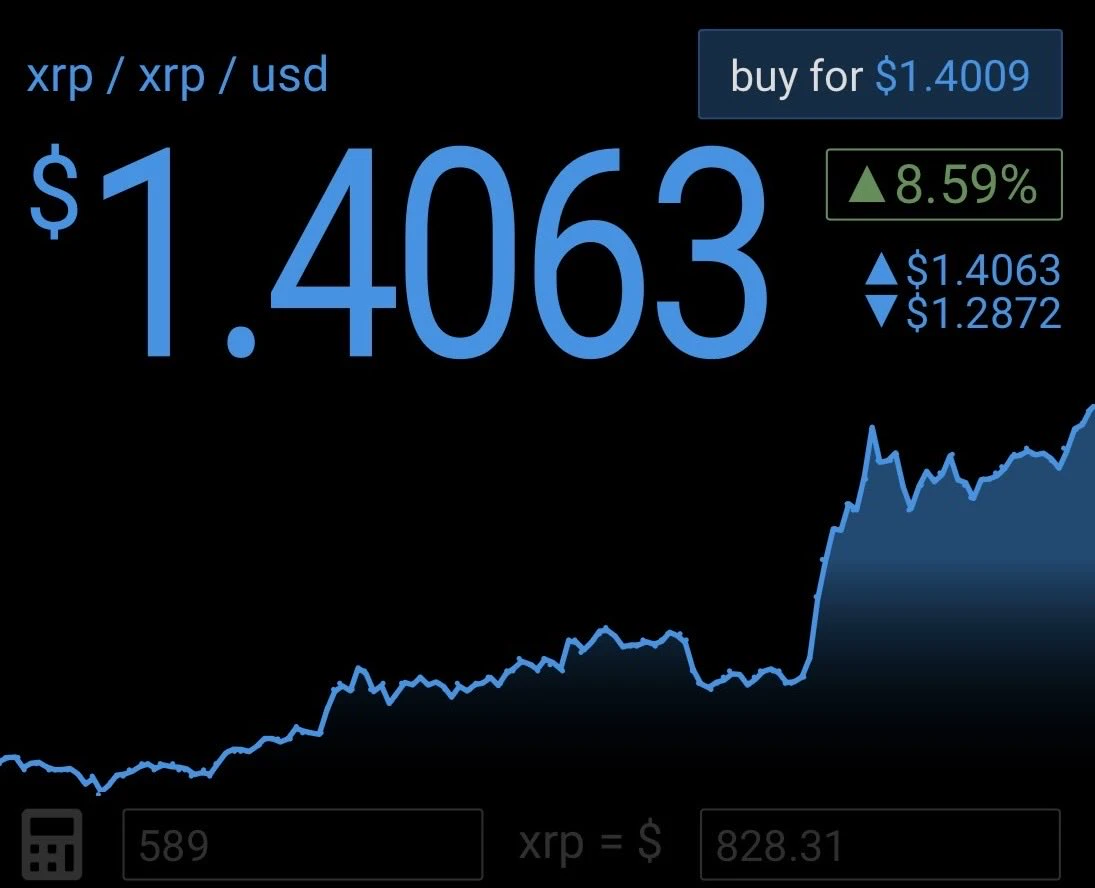
“Say XRP!”
post-image
XRP+7.89%
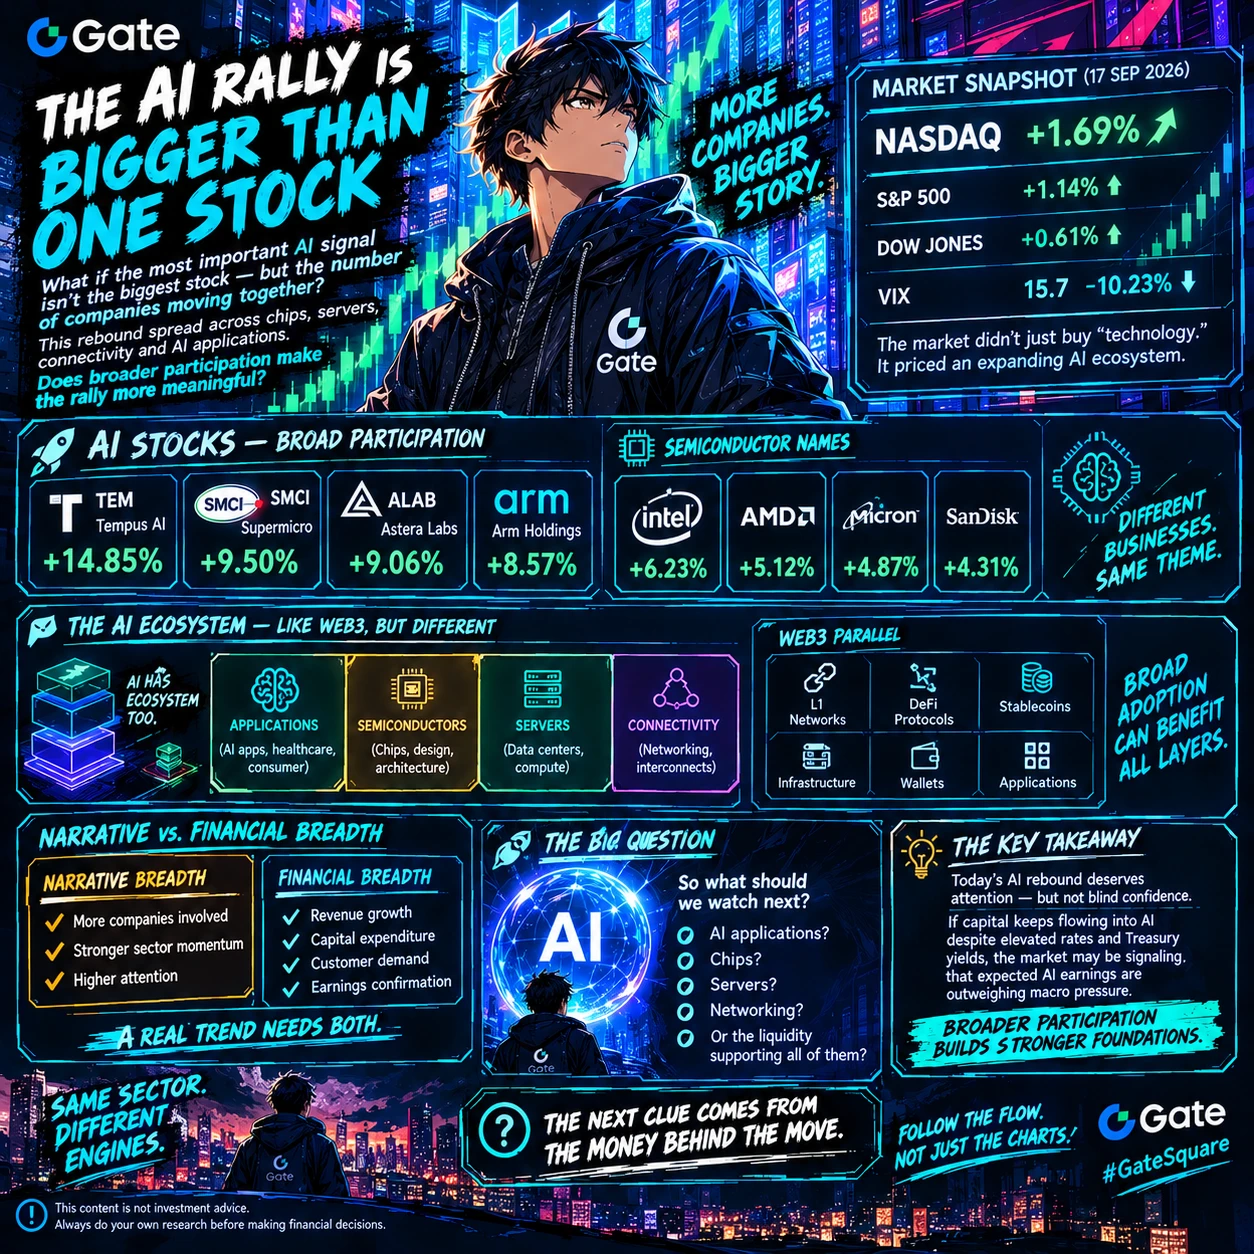
The AI Rally Is Bigger Than One Stock
What if the most important AI signal isn't the biggest stock—but the number of companies moving together?
This rebound spread across chips, servers, connectivity and AI applications.
Does broader participation make the rally more meaningful?
Part 1 established the headline: Nasdaq gained 1.69%.
Now comes the more interesting question—how broad was the AI move?
The latest session showed strong participation across multiple layers of the technology ecosystem. Tempus AI rose 14.85%, Supermicro 9.50%, Astera Labs 9.06% and Arm 8.57%. Semiconductor names also a
post-image
xxx40xxx
AI Rebound: New Cycle or Relief Rally?
The AI trade just came roaring back—but the bigger story may be what happens next.
Nasdaq jumped 1.69% while several AI names gained nearly double-digit percentages.
Is this the beginning of another AI expansion, or simply a powerful relief rally?
September has already reminded investors how quickly the market can change direction.
After a volatile week dominated by inflation concerns, oil prices, Treasury yields and the Federal Reserve's first rate hike since 2023, U.S. equities suddenly regained momentum. The Nasdaq closed 1.69% higher, the S&P 500 added 1.14%, and the Dow gained 0.61%. The VIX also dropped 10.23%, showing a clear reduction in near-term market fear.
But the most interesting part was inside the technology sector.
Tempus AI surged 14.85%, Supermicro gained 9.50%, Astera Labs rose 9.06%, and Arm climbed 8.57%. Semiconductor stocks were particularly strong, with the Philadelphia Semiconductor Index gaining 3.14%.
That creates an important distinction.
The market did not simply buy “technology.” It aggressively repriced companies connected to the AI infrastructure chain.
For Web3 and crypto traders, this is a familiar pattern. Narratives can move first, but sustainable trends require liquidity, participation and fundamental confirmation.
AI now faces the same test.
One strong session proves momentum—not a new market regime.
Over the next four parts, we will examine breadth, liquidity, infrastructure and valuation to determine what this rebound is actually telling us.
The first signal is bullish momentum. The next question is much harder: can the AI trade keep attracting capital after the initial excitement fades?
This content is not investment advice. Always perform your own research before making financial decisions.
$BTC $GT $ETH
#USAIConceptStocksReboundAcrossTheBoard #Gate广场中秋团圆局 #美股AI概念股全线反弹 #GateSquareMidAutumnReunion #JapanRealEstatePowerChipStocksRise

repost-content-media
BTC+5.69%
GT+6.29%
ETH+7.11%
  • 6
  • 1
Follow the AI Infrastructure
The next AI winner may not be the company with the loudest AI story.
It may be the company supplying the infrastructure that makes the entire ecosystem possible.
So where does the real economic value sit beneath the AI boom?
The latest market action provides an important clue.
Arm jumped 8.57%, Astera Labs gained 9.06%, Supermicro rose 9.50%, while semiconductor stocks broadly outperformed. The Philadelphia Semiconductor Index climbed 3.14%.
This tells us something about how the market is viewing AI.
Artificial intelligence is not simply a software trend.
Every AI
post-image
xxx40xxx
The Liquidity Test Behind the AI Rally
The AI narrative is powerful—but even the strongest narrative must answer to liquidity.
The Fed just raised rates while Treasury yields pushed toward 5%.
Can AI stocks continue climbing when capital is becoming more expensive?
This is where the rebound becomes genuinely interesting.
On September 16, the Federal Reserve raised its benchmark rate by 25 basis points to 3.75%–4.00%, its first rate increase since 2023. The latest projections also point toward the possibility of another increase before the end of 2026.
At the same time, the 10-year Treasury yield has moved around the 5% area, keeping pressure on growth-oriented assets.
Normally, this creates a difficult environment for companies whose valuations depend heavily on future growth.
Yet AI stocks bounced aggressively.
That contradiction is the key.
The market appears to be weighing two forces against each other: higher discount rates versus stronger expectations for AI-related earnings and capital expenditure.
This is remarkably similar to crypto.
In Web3, traders watch stablecoin liquidity, exchange flows, funding rates and on-chain activity to understand whether capital is actually entering the ecosystem.
Equity markets have different instruments, but the underlying question is similar:
Is there enough liquidity and conviction to absorb higher risk?
If AI stocks can continue gaining while yields remain elevated, that would suggest investors are assigning substantial importance to AI demand and corporate spending.
If the rally fades as yields rise again, the market may be showing that macro conditions still dominate.
Therefore, the AI story is no longer only a technology story.
It has become a liquidity story.
And that takes us directly to the next question: where exactly is all this AI capital being deployed?
Is AI demand strong enough to overcome higher rates—or will liquidity ultimately determine the next chapter?
This content is not investment advice. Always perform your own research before making financial decisions.
$BTC $GT $ETH
#GateSquareMidAutumnReunion
#USAIConceptStocksReboundAcrossTheBoard #Gate广场中秋团圆局 #美股AI概念股全线反弹 #JapanRealEstatePowerChipStocksRise
repost-content-media
BTC+5.69%
GT+6.29%
ETH+7.11%
  • 8
  • 1
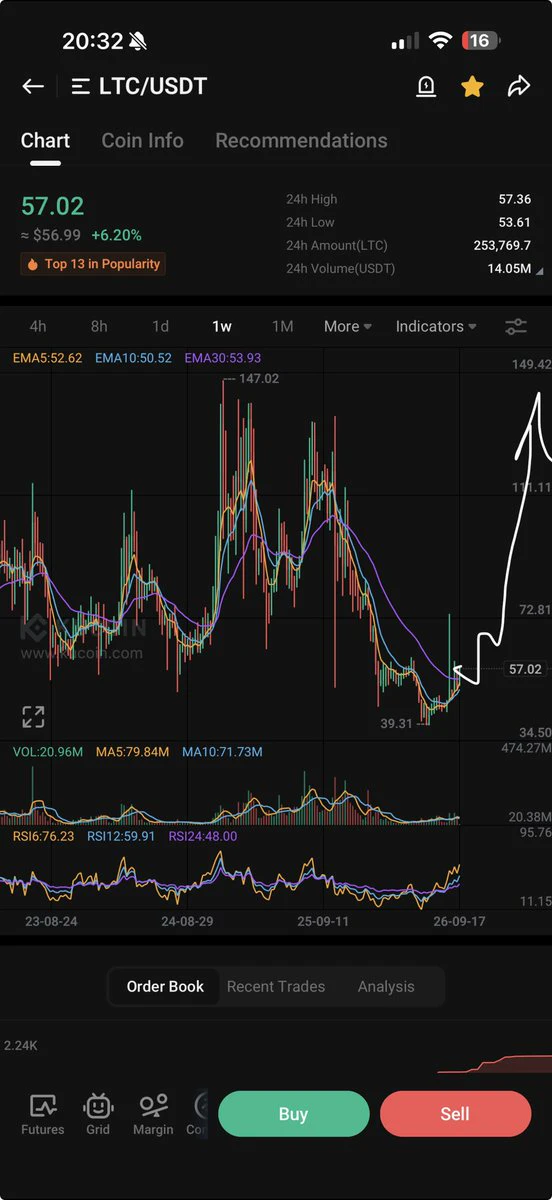
$Ltc all the way!
post-image
LTC+6.11%
$AKE exploding +82% Is AKE consolidating near $0.0383 after a massive vertical rally to retest $0.0395+? Here is my trade setup.
Pair: $AKE /USDT
BUY ZONE / ENTRY:
Entry Range: 0.0345000 - 0.0383500
TARGETS:
TP 1: 0.0394954
TP 2: 0.0435000
TP 3: 0.0480000
STOP LOSS:
SL: 0.0290000
📌 Found this market breakdown helpful? Follow for daily setups, technical analysis, and real-time trade signals
$AKE ‌
AKE+84.75%
  • 5
  • 1
Load More

Join 40 M users in our growing community

⚡️ Join 40 M users in the crypto craze discussion

💬 Engage with your favorite top creators

👍 See what interests you

Trending Topics

JapanRealEstatePowerChipStocksRise

58.65k Views3.58k Discussing

Japan's Nikkei extended gains on Sept 18, with real estate, power, and semiconductor sectors leading. Gate covers over 12,800 global stocks and ETFs, offering one-stop USDT trading across US, HK, Korean, and Japanese markets. [👉 Read more](https://www.odaily.news/en/newsflash/518749)

USAIConceptStocksRally

33.45k Views520 Discussing

GateTopsStockPerpetualCoverage

37.59k Views2.32k Discussing

View More