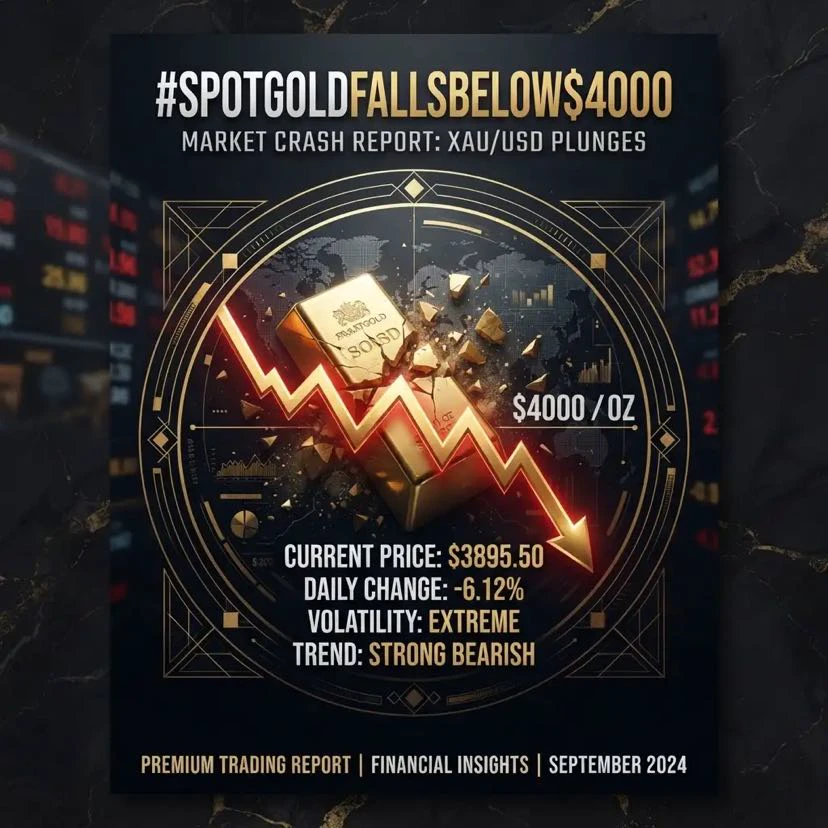
#SpotGoldFallsBelow$4000
🚨 SPOT GOLD FALLS BELOW $4,000 — IS GOLD’S RECORD-BREAKING RALLY FINALLY LOSING MOMENTUM?
Gold has spent months dominating the global financial conversation, reaching extraordinary levels as investors searched for protection against uncertainty, inflation risks, geopolitical tensions and changing expectations for monetary policy.
But now, the market is facing a major psychological moment.
Spot gold has fallen below the $4,000 level.
For investors who watched gold climb aggressively toward historic highs, the move below such a major round number is impossible to ignore.
The immediate question is not simply why gold is falling.
The bigger question is:
Is this only a healthy correction after a massive rally — or is the gold market entering a deeper period of repricing?
🔥 1. $4,000 WAS A MAJOR PSYCHOLOGICAL LEVEL
Round numbers matter in financial markets.
Levels such as $3,000, $3,500 and $4,000 can become important psychological reference points for traders and investors.
When an asset trades above a major round number for an extended period, investors can begin to treat that level as support.
A move below it can therefore change short-term sentiment.
Traders who bought near recent highs may decide to lock in profits, while momentum-focused investors can become more cautious.
That can create additional selling pressure.
However, breaking below $4,000 does not automatically mean that gold's long-term bull market is finished.
Markets frequently move through psychological levels before establishing a new trading range.
The key is what happens next.
📉 2. PROFIT-TAKING CAN ACCELERATE A CORRECTION
Gold's previous rally created substantial gains for investors who entered the market earlier.
When prices rise rapidly, profit-taking becomes increasingly likely.
Institutional investors, funds and traders may reduce exposure after a strong run, especially when momentum begins to weaken.
This creates a classic market dynamic:
Strong rally → stretched valuations → profit-taking → momentum slowdown → increased volatility.
Once the selling begins, technical traders can add to the move.
That does not necessarily mean investors have suddenly become bearish on gold's long-term fundamentals.
Sometimes, the market simply needs to reset after moving too far too quickly.
💵 3. THE U.S. DOLLAR AND INTEREST-RATE EXPECTATIONS MATTER
Gold does not trade in isolation.
One of its most important relationships is with the U.S. dollar and interest rates.
Gold is priced internationally in U.S. dollars, meaning changes in dollar strength can influence demand.
Meanwhile, gold does not generate interest income.
When investors can earn relatively attractive returns from interest-bearing assets, the opportunity cost of holding gold can increase.
Therefore, changes in expectations surrounding monetary policy and interest rates can quickly influence gold prices.
If markets begin expecting tighter financial conditions or fewer rate cuts than previously anticipated, gold can face additional pressure.
On the other hand, expectations for easier monetary policy can provide support.
🌍 4. GEOPOLITICAL RISK REMAINS A KEY FACTOR
One reason gold became so attractive during periods of uncertainty was its traditional role as a defensive asset.
Wars, geopolitical tensions, financial instability and concerns about global economic growth can increase demand for safe-haven assets.
But safe-haven demand can change quickly.
If investors believe geopolitical risks are becoming less severe, some capital can rotate from defensive assets into riskier opportunities such as equities or other growth-oriented investments.
This means gold investors must watch both economic data and geopolitical developments.
🏦 5. CENTRAL-BANK DEMAND IS STILL IMPORTANT
One of the most important structural themes behind gold's long-term strength has been central-bank demand.
Central banks around the world have increased their attention toward gold as part of reserve diversification.
This creates a different type of demand compared with short-term speculative trading.
Retail traders may sell during a correction.
Short-term funds may reduce exposure.
But structural buyers can continue accumulating gold when prices become more attractive.
That is why investors should distinguish between short-term price weakness and long-term fundamental demand.
⚠️ 6. DON'T CONFUSE A CORRECTION WITH A COLLAPSE
This is perhaps the most important message for investors.
A decline below $4,000 may look dramatic because the level is psychologically significant.
But markets do not move in straight lines.
Even the strongest bull markets experience:
Corrections.
Consolidations.
Profit-taking.
Volatility.
The real question is whether gold can establish support after the decline.
If buyers return quickly and the market stabilizes, the move could eventually become another consolidation phase.
But if selling continues aggressively and major technical support levels fail, investors may need to prepare for a deeper correction.
🔎 7. WHAT SHOULD GOLD INVESTORS WATCH NOW?
There are several indicators that could determine gold's next major move.
First — the U.S. dollar.
A stronger dollar can create additional headwinds for gold.
Second — bond yields.
Rising yields can increase competition for non-yielding assets.
Third — central-bank purchases.
Continued structural demand could help limit deeper declines.
Fourth — inflation expectations.
Persistent inflation can strengthen gold's defensive appeal.
Fifth — geopolitical risk.
Any major escalation could quickly revive safe-haven demand.
Sixth — technical support.
After losing $4,000, traders will closely monitor whether buyers defend lower levels.
🚀 THE BIGGER MARKET MESSAGE
Gold falling below $4,000 is more than a simple price movement.
It is a reminder that even the strongest-performing assets can experience sharp corrections.
Investors who became comfortable with gold continually reaching new highs now have to deal with a different market environment.
The easy part of a bull market is buying when momentum is obvious.
The difficult part is managing risk when momentum changes.
For traders, this means avoiding emotional decisions.
A falling price does not automatically mean “sell.”
A previous record high does not automatically mean “buy.”
The market must be evaluated through a combination of fundamentals, liquidity, macroeconomic conditions, positioning and technical structure.
🔥 FINAL TAKE
Spot gold falling below $4,000 is a major psychological event, but it is not enough by itself to declare the end of gold's long-term story.
The next few sessions could be extremely important.
If buyers defend lower levels, gold may eventually stabilize and begin building a new base.
If selling pressure continues, the market could enter a deeper correction as traders reassess valuations and expectations.
For investors, the strategy should remain simple:
Don't chase the rally.
Don't panic during the correction.
Watch the dollar.
Track interest rates.
Monitor central-bank demand.
Respect technical levels.
And manage risk.
Gold has already shown the world how powerful a sustained rally can become.
Now the market is showing the other side of the story:
Even record-breaking assets can fall — and the next opportunity often appears when investors understand the difference between panic and genuine trend reversal.
📊 What do you think?
Will gold reclaim $4,000 quickly, or are we entering a deeper correction?
Share your view below and stay connected for more global market, commodities, stocks and crypto analysis.
#SpotGold #GoldMarket #PreciousMetals #DYOR @Gate_Square
🚨 SPOT GOLD FALLS BELOW $4,000 — IS GOLD’S RECORD-BREAKING RALLY FINALLY LOSING MOMENTUM?
Gold has spent months dominating the global financial conversation, reaching extraordinary levels as investors searched for protection against uncertainty, inflation risks, geopolitical tensions and changing expectations for monetary policy.
But now, the market is facing a major psychological moment.
Spot gold has fallen below the $4,000 level.
For investors who watched gold climb aggressively toward historic highs, the move below such a major round number is impossible to ignore.
The immediate question is not simply why gold is falling.
The bigger question is:
Is this only a healthy correction after a massive rally — or is the gold market entering a deeper period of repricing?
🔥 1. $4,000 WAS A MAJOR PSYCHOLOGICAL LEVEL
Round numbers matter in financial markets.
Levels such as $3,000, $3,500 and $4,000 can become important psychological reference points for traders and investors.
When an asset trades above a major round number for an extended period, investors can begin to treat that level as support.
A move below it can therefore change short-term sentiment.
Traders who bought near recent highs may decide to lock in profits, while momentum-focused investors can become more cautious.
That can create additional selling pressure.
However, breaking below $4,000 does not automatically mean that gold's long-term bull market is finished.
Markets frequently move through psychological levels before establishing a new trading range.
The key is what happens next.
📉 2. PROFIT-TAKING CAN ACCELERATE A CORRECTION
Gold's previous rally created substantial gains for investors who entered the market earlier.
When prices rise rapidly, profit-taking becomes increasingly likely.
Institutional investors, funds and traders may reduce exposure after a strong run, especially when momentum begins to weaken.
This creates a classic market dynamic:
Strong rally → stretched valuations → profit-taking → momentum slowdown → increased volatility.
Once the selling begins, technical traders can add to the move.
That does not necessarily mean investors have suddenly become bearish on gold's long-term fundamentals.
Sometimes, the market simply needs to reset after moving too far too quickly.
💵 3. THE U.S. DOLLAR AND INTEREST-RATE EXPECTATIONS MATTER
Gold does not trade in isolation.
One of its most important relationships is with the U.S. dollar and interest rates.
Gold is priced internationally in U.S. dollars, meaning changes in dollar strength can influence demand.
Meanwhile, gold does not generate interest income.
When investors can earn relatively attractive returns from interest-bearing assets, the opportunity cost of holding gold can increase.
Therefore, changes in expectations surrounding monetary policy and interest rates can quickly influence gold prices.
If markets begin expecting tighter financial conditions or fewer rate cuts than previously anticipated, gold can face additional pressure.
On the other hand, expectations for easier monetary policy can provide support.
🌍 4. GEOPOLITICAL RISK REMAINS A KEY FACTOR
One reason gold became so attractive during periods of uncertainty was its traditional role as a defensive asset.
Wars, geopolitical tensions, financial instability and concerns about global economic growth can increase demand for safe-haven assets.
But safe-haven demand can change quickly.
If investors believe geopolitical risks are becoming less severe, some capital can rotate from defensive assets into riskier opportunities such as equities or other growth-oriented investments.
This means gold investors must watch both economic data and geopolitical developments.
🏦 5. CENTRAL-BANK DEMAND IS STILL IMPORTANT
One of the most important structural themes behind gold's long-term strength has been central-bank demand.
Central banks around the world have increased their attention toward gold as part of reserve diversification.
This creates a different type of demand compared with short-term speculative trading.
Retail traders may sell during a correction.
Short-term funds may reduce exposure.
But structural buyers can continue accumulating gold when prices become more attractive.
That is why investors should distinguish between short-term price weakness and long-term fundamental demand.
⚠️ 6. DON'T CONFUSE A CORRECTION WITH A COLLAPSE
This is perhaps the most important message for investors.
A decline below $4,000 may look dramatic because the level is psychologically significant.
But markets do not move in straight lines.
Even the strongest bull markets experience:
Corrections.
Consolidations.
Profit-taking.
Volatility.
The real question is whether gold can establish support after the decline.
If buyers return quickly and the market stabilizes, the move could eventually become another consolidation phase.
But if selling continues aggressively and major technical support levels fail, investors may need to prepare for a deeper correction.
🔎 7. WHAT SHOULD GOLD INVESTORS WATCH NOW?
There are several indicators that could determine gold's next major move.
First — the U.S. dollar.
A stronger dollar can create additional headwinds for gold.
Second — bond yields.
Rising yields can increase competition for non-yielding assets.
Third — central-bank purchases.
Continued structural demand could help limit deeper declines.
Fourth — inflation expectations.
Persistent inflation can strengthen gold's defensive appeal.
Fifth — geopolitical risk.
Any major escalation could quickly revive safe-haven demand.
Sixth — technical support.
After losing $4,000, traders will closely monitor whether buyers defend lower levels.
🚀 THE BIGGER MARKET MESSAGE
Gold falling below $4,000 is more than a simple price movement.
It is a reminder that even the strongest-performing assets can experience sharp corrections.
Investors who became comfortable with gold continually reaching new highs now have to deal with a different market environment.
The easy part of a bull market is buying when momentum is obvious.
The difficult part is managing risk when momentum changes.
For traders, this means avoiding emotional decisions.
A falling price does not automatically mean “sell.”
A previous record high does not automatically mean “buy.”
The market must be evaluated through a combination of fundamentals, liquidity, macroeconomic conditions, positioning and technical structure.
🔥 FINAL TAKE
Spot gold falling below $4,000 is a major psychological event, but it is not enough by itself to declare the end of gold's long-term story.
The next few sessions could be extremely important.
If buyers defend lower levels, gold may eventually stabilize and begin building a new base.
If selling pressure continues, the market could enter a deeper correction as traders reassess valuations and expectations.
For investors, the strategy should remain simple:
Don't chase the rally.
Don't panic during the correction.
Watch the dollar.
Track interest rates.
Monitor central-bank demand.
Respect technical levels.
And manage risk.
Gold has already shown the world how powerful a sustained rally can become.
Now the market is showing the other side of the story:
Even record-breaking assets can fall — and the next opportunity often appears when investors understand the difference between panic and genuine trend reversal.
📊 What do you think?
Will gold reclaim $4,000 quickly, or are we entering a deeper correction?
Share your view below and stay connected for more global market, commodities, stocks and crypto analysis.
#SpotGold #GoldMarket #PreciousMetals #DYOR @Gate_Square