Share your thoughts
placeholder
Article
Financial News, Crypto Updates, Real-World Strategies
live-cover
LIVE1,464
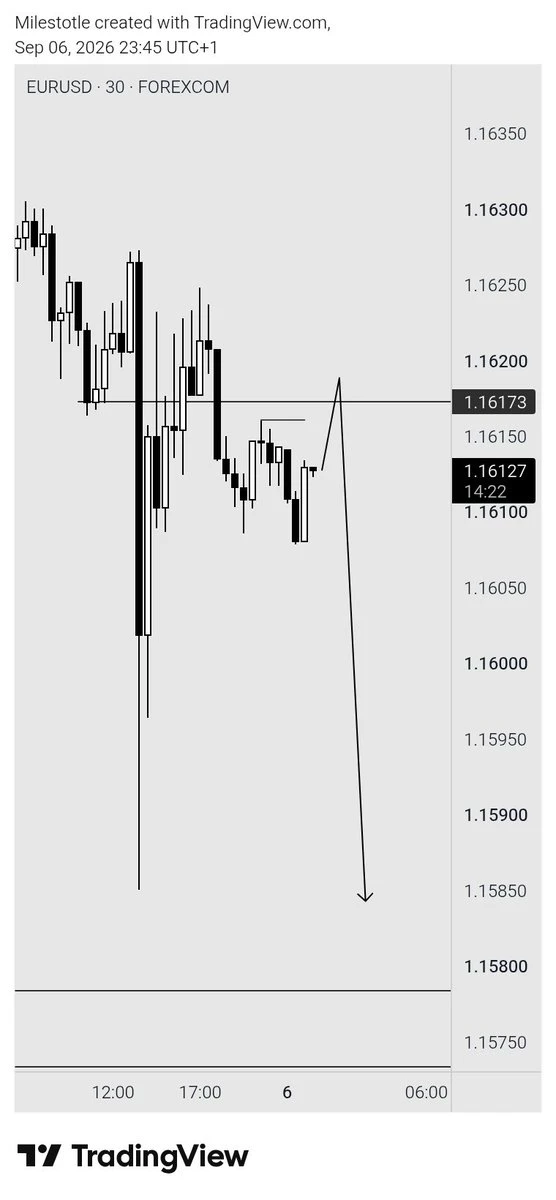
I was just glancing through $EURUSD and found this unfolding, looks nice so I have to see how it plays out.
#eurusd
post-image
EURUSD0.00%
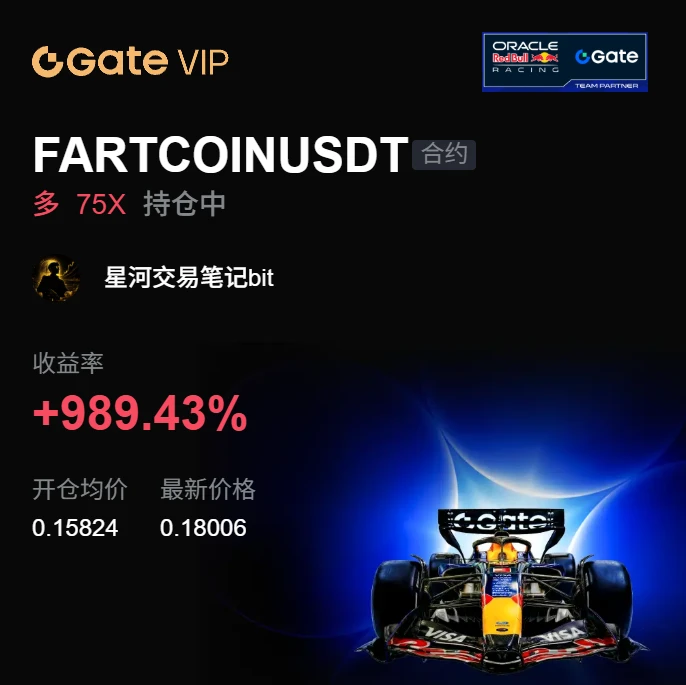
After $FARTCOIN rallied, I didn’t exit my entire position. I took 80% in profits first and moved the protective stop on the remaining position above breakeven. Just now, a quick pullback took out the remaining position, locking in the profits smoothly.

The entry reason was simple: on the hourly timeframe, price pulled back to the previous high without continuing lower, and instead reclaimed the area above the moving average on rising volume. This was a textbook pullback confirmation. After going long, I kept my stop loss below the lower boundary of the small range.

After the pullback took
post-image
FARTCOIN+3.49%
SNDK+1.12%
ZEC+19.99%
Most traders missed NEAR's 84% short signal because the 1D trend screamed bullish.

$NEAR /USDT - SHORT

Trade Plan:
Entry: 2.4312 – 2.4610
SL: 2.6323
TP1: 2.3065
TP2: 2.2134
TP3: 2.0737

Why this setup?
- The 4h timeframe is flipping bearish against the daily uptrend—this is the classic “bull trap” setup.
- RSI 15m at 55 shows weak momentum, not enough fuel to break 2.4610 resistance.
- Entry zone 2.4461 with TP1 at 2.3065 gives a 5.7% move before the daily trend reasserts.
- ATR 1h (0.0597) means volatility is compressed—breakouts are violent. Why now? Price is stalling under supply
NEAR+11.44%
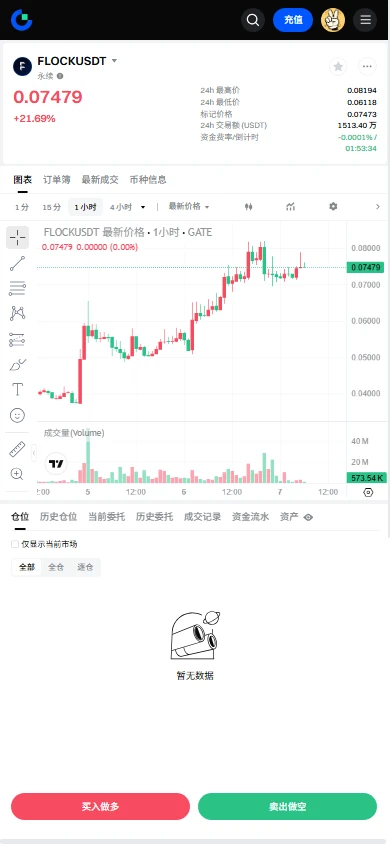
$FLOCK Signal】1H pullback support + negative funding rate short squeeze, long setup
$FLOCK After spiking to 0.08205 on the 1H chart, the price fell sharply to the current 0.07301 and has briefly stabilized above 0.0728. RSI has fallen to 59.68 on the 1H chart, while the 4H chart remains elevated at 69.09. The 1H MACD has formed a death cross, with the histogram at -0.0001, indicating weak downward momentum. Order-book depth imbalance is 8.64%, with dense bids below 0.0728. The funding rate is -0.0168%, with shorts paying to hold positions; OI is stable.
🎯 Direction: Long
⚡ Entry/limit order
post-image
FLOCK+17.89%
Everyone is focused on Bitcoin’s weekly close $BTC
, while I’m focused on taking profits in altcoins 💲🤑
The idea of all coins forming a new bottom has become a distant dream
You took the bait, my bear-market friend... you took the bait 😘
post-image
BTC+0.29%
Everyone’s staring at $ETH /USDT’s range—but the 4h clock just started ticking for the quiet exit.

$ETH /USDT - SHORT

Trade Plan:
Entry: 2492.99 – 2499.19
SL: 2525.89
TP1: 2473.74
TP2: 2458.85
TP3: 2436.50

Why this setup?
Why now? The 1D says “range,” but the 4h frame is whispering SHORT with 55% conviction. Price is parked at 2496, right on the entry ref. ATR (12.41) is thin—volatility is coiled. RSI 15m at 51.7 shows zero momentum, meaning longs aren’t committed. The path of least resistance is down to TP1 (2473) then TP2 (2458), unless we invalidate above 2470.67—wait, that’s the inva
ETH+1.06%
$1000 to $100,000 Crypto Trade Challenge Today
live-cover
LIVE1,613
@jukan05 @Alex_Intel_
post-image
A hand that trembled slightly when setting the stop-loss a few days ago—this morning I realized that was unnecessary filial piety. 😂

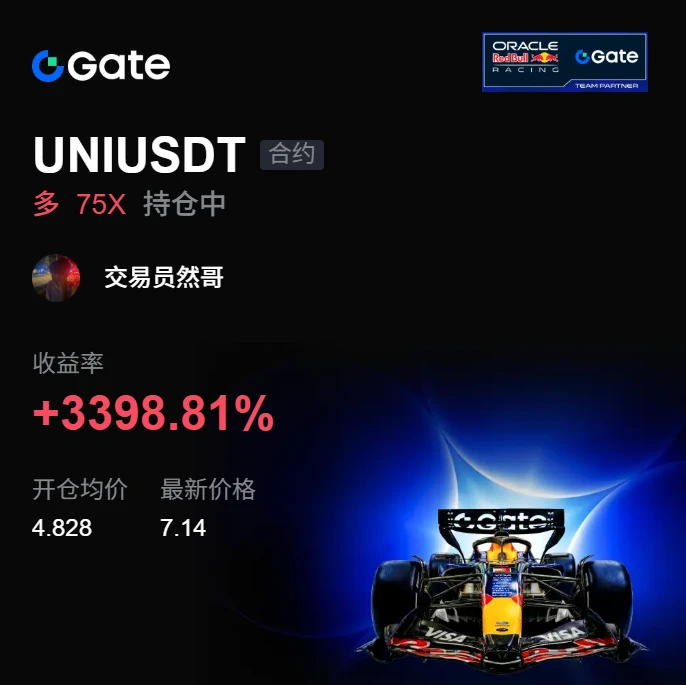
A few days ago before bed, I set my watch level near 4.828. The pullback held, and buying pressure clearly strengthened. If you don’t enter on a signal like this, what are you waiting for? I pressed confirm and closed the app. When I opened the charts this morning, $UNI had already reached 7.141, and my position’s return had rolled straight up to +3400.28%. This move really wasn’t luck; it was positive feedback from the structure. Feeling good, brothers. 🎯

post-image
UNI+1.21%
ADA+0.77%
ZEC+19.99%
This return has me feeling both thrilled and apprehensive, afraid the market will come to its senses tomorrow and blacklist me.

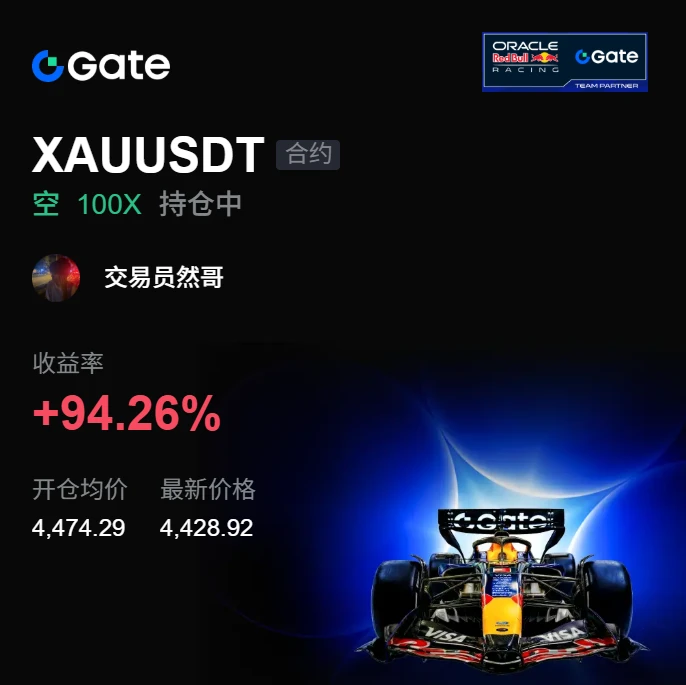
A few days ago before bed, $XAU made another push upward. When it approached 4474.29, my heart skipped a beat: I couldn't chase the long; the rebound was weak and volume hadn't followed through. No matter how I looked at it, it seemed like a bull trap. At that point, I placed another short order, set the stop-loss above, and shut down my computer to sleep. When I opened my eyes this morning, the price had already slid to 4428.93, and the return had jumped straight
post-image
XAU-0.10%
SNDK+1.12%
LAB-3.96%
$ARB Signal】1H pullback to EMA20 + 4H bullish continuation
$ARB 1H pullback to EMA20, current price 0.18475; the 4H MACD histogram at 0.0032 is narrowing. Order book imbalance is -4.41%, 1H RSI 55.35 is neutral, funding rate is 0.0065%, OI is stable, and short-term leverage is not crowded. The 1H MACD negative histogram is contracting, with price consolidating between 0.1805-0.1850.
🎯Direction: Long
⚡Entry/Limit Order: 0.1841957 - 0.1847500
🛑Stop Loss: 0.1755125
🚀Target 1: 0.1986063
🚀Target 2: 0.2055344
🛡️Trade Management:
- Execution Strategy: After reaching Target 1, reduce the positio
ARB+4.20%
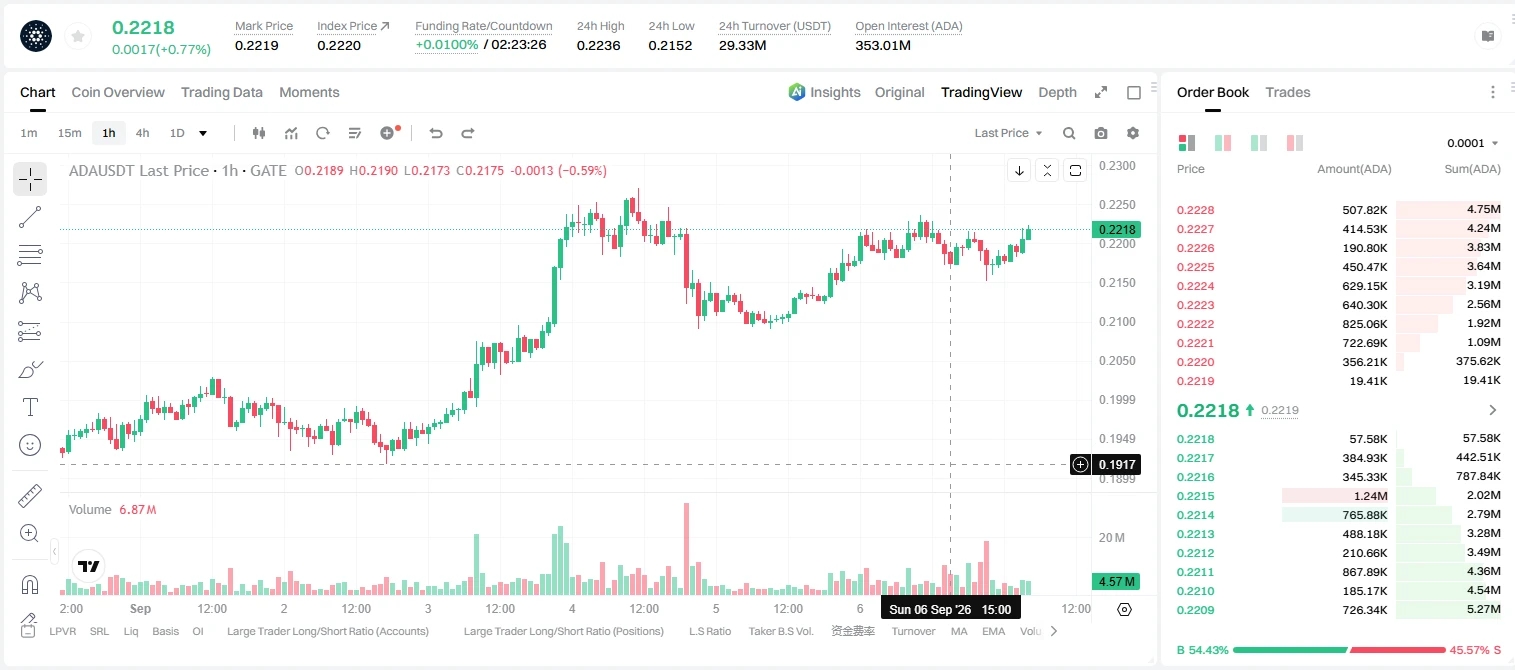
Everyone is staring at ADA’s green 15-min RSI, but the 4h tape just whispered something darker.

$ADA /USDT - SHORT

Trade Plan:
Entry: 0.2212 – 0.2224
SL: 0.2274
TP1: 0.2176
TP2: 0.2148
TP3: 0.2105

Why this setup?
Why now? The daily trend is range-bound, which means mean reversion is the game. RSI(15m) at 63 is a local overheat, not a breakout signal. ATR(1h) is thin at 0.0023, so the short squeeze fuel is low. We’re sitting at 0.2218 with a clear invalidation at 0.2133. If we reject 0.2224, the path to TP1 (0.2176) and TP2 (0.2148) is a straight line down. The 55 confidence score says "p
post-image
ADA+0.77%
Everyone’s chasing $MU /USDT longs while the 4h quietly flips—are you early or early exit?

$MU /USDT - SHORT

Trade Plan:
Entry: 1019.67 – 1021.43
SL: 1029.04
TP1: 1014.18
TP2: 1009.93
TP3: 1003.57

Why this setup?
- 1D is *range*, not breakout—so the 1020.55 reference is a midpoint trap, not a launchpad.
- RSI 15m at 55.1 shows weak bounce fuel; momentum stalls right under the entry zone.
- ATR 1h (3.54) is tight—when it expands, it’s usually down from here.
- Why now? Price is sitting at the exact SHORT trigger with SL at 1029.04, giving a 2.3R to TP2 at 1009.93 before the daily ra
MU+0.50%
Name that token $______
#memecoins
post-image
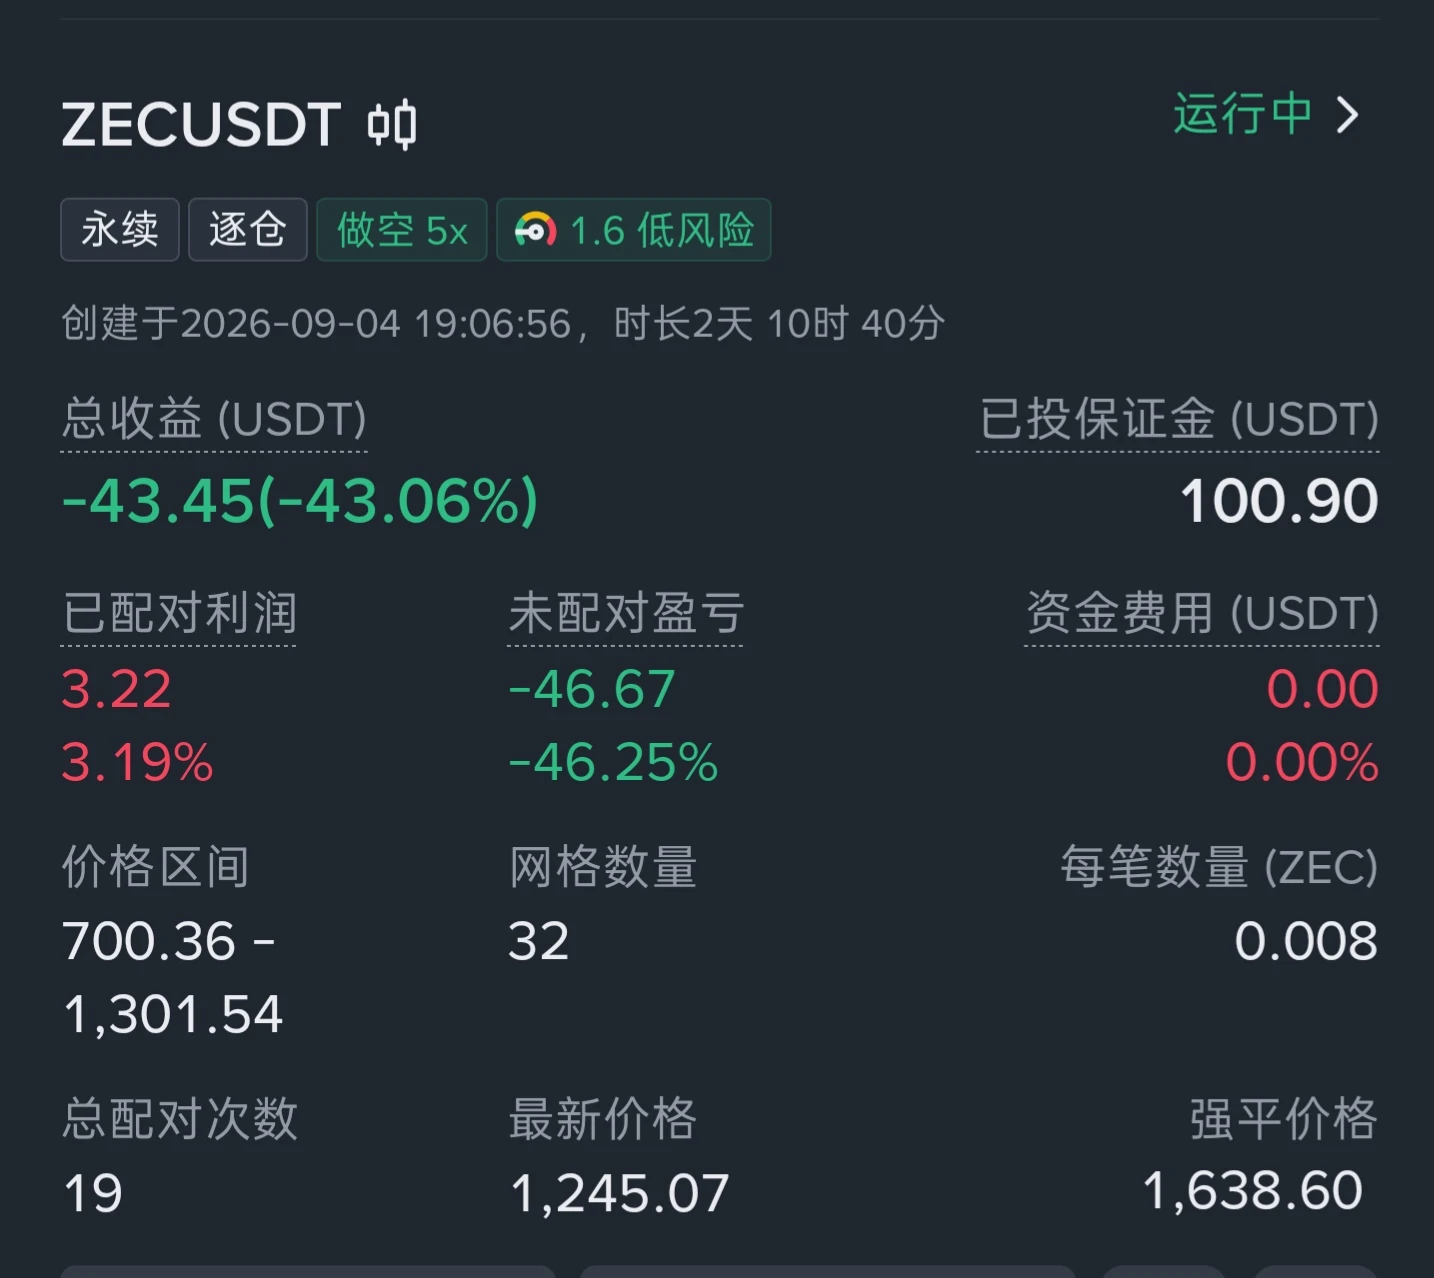
Privacy leader #ZEC pumped again 🥲 The good news is that it’s up 6x since we entered ✌️ The bad news is that the short grid entered at 10XX is at an unrealized loss 🥲 You really can’t short it even a little! Market maker, are you still pumping because you want to surpass Bitcoin? $ZEC
post-image
ZEC+19.99%
  • 1
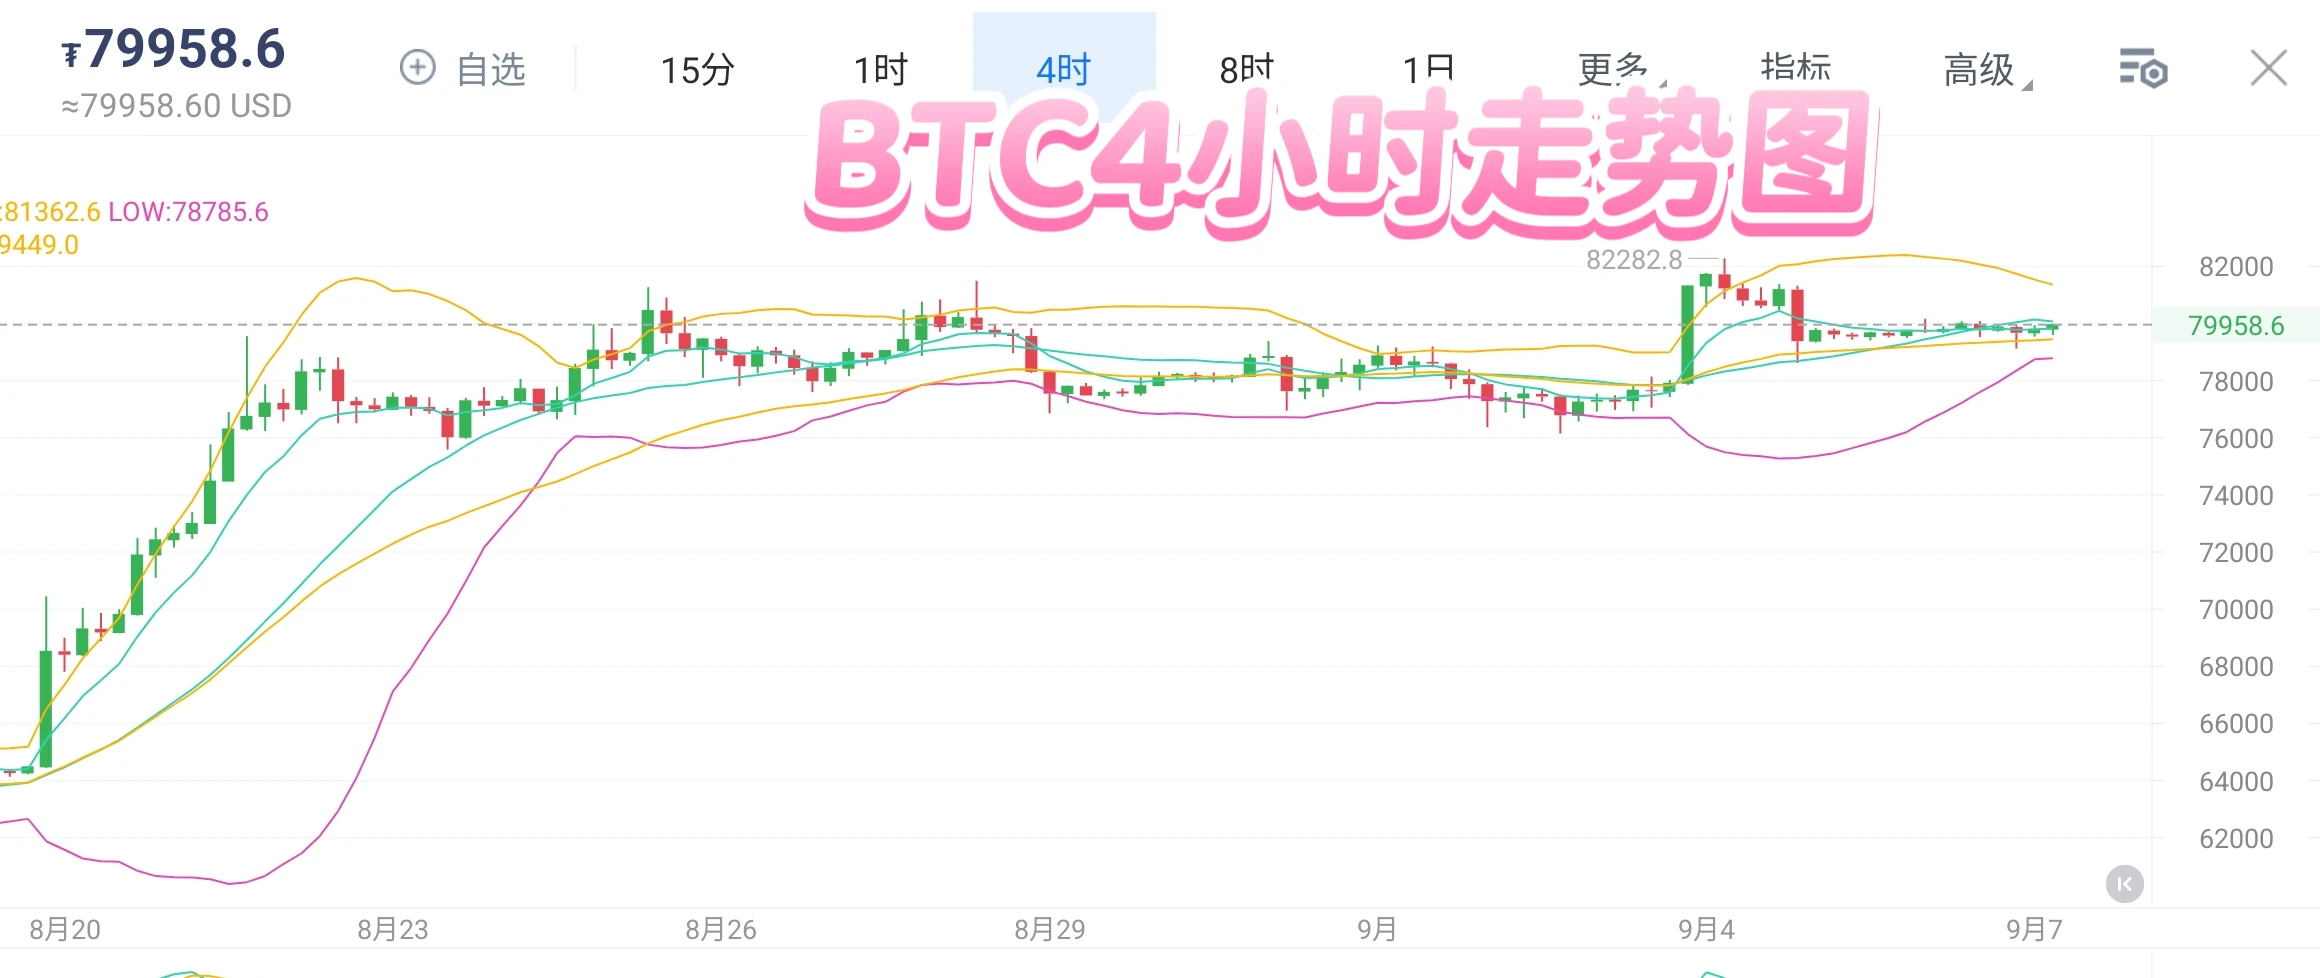
BTC and bears/bulls battle again at the $80,000 level
Bitcoin started this rally from its mid-August low of 62,681, rising sharply on expanding volume and reaching a high of 82,282.8, up more than 30%. After the surge, it pulled back. The current price is 79,958, fluctuating and consolidating repeatedly around the $80,000 level.

4-hour chart breakdown:
The Bollinger Bands are still opening upward overall. The middle band is at 80,074, with the current price pulling around the middle band, indicating intense competition between bulls and bears at this level. The upper band at 81,362 is the fi
post-image
BTC+0.27%
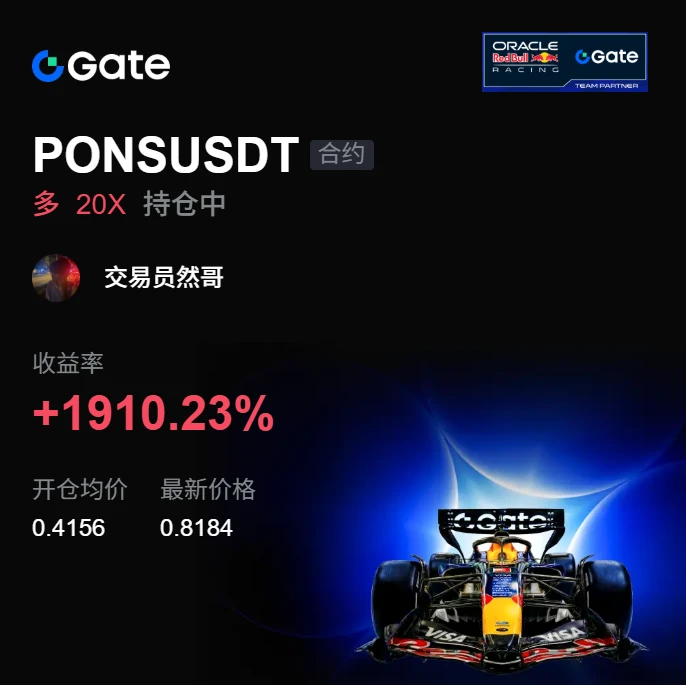
A few days ago, I was still calculating whether I had enough money for instant noodles this month; this morning, I was already wondering whether to add sausage 🍜
A few days ago, when the market had just plunged in the afternoon, I saw $PONS get slammed down and immediately bought back up. The buying support was exceptionally strong. This wasn't weakness—someone was quietly accumulating amid the plunge. I directly made my long signal clear around 0.4156, without the slightest hesitation.
Looking at the market again now, the price has climbed to 0.8206. This kind of move feels amazing—I stayed
post-image
PONS-11.63%
LAB-3.96%
BNB-2.59%
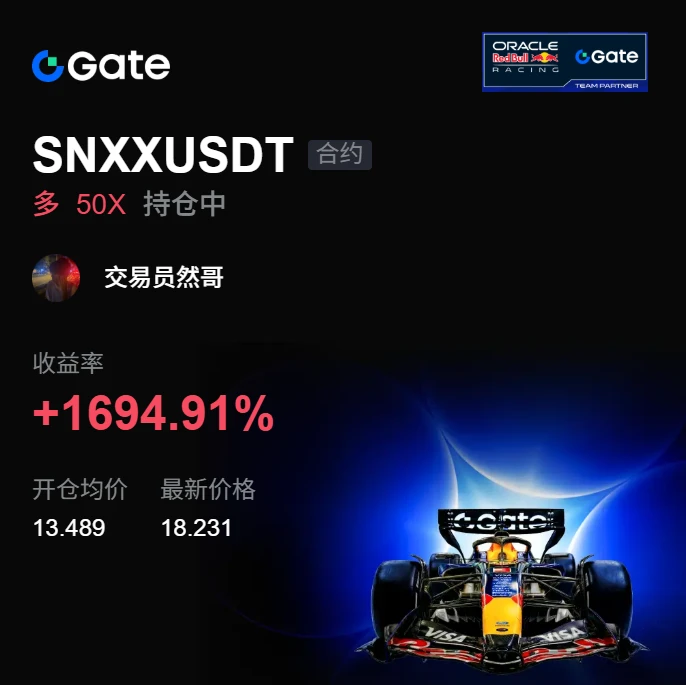
This return has me feeling nervous, worried the market might come to its senses tomorrow and blacklist me.
With the screen glowing green, $SNXX consolidated around 13.489. No matter how I looked at it, it seemed ready to break down. But I noticed that every dip was met with buyers, while volume was quietly cooperating; it was moving sideways at the bottom without breaking down—this structure wasn’t bearish, so I should be watching for longs instead. Once the market stabilized a little, I opened a long.
I didn’t expect it to surge straight to the current 18.223, with unrealized gains of +1693.
post-image
SNXX+2.53%
ETH+1.06%
LAB-3.96%
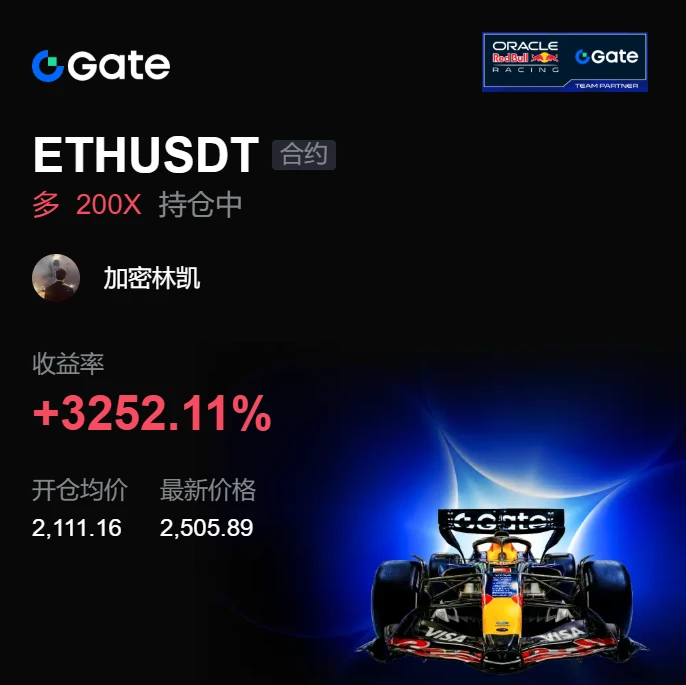
I did nothing—just went to the restroom, and when I came back, the candlestick chart had already done the work for me 💨 Before bed last night, I was still thinking about my position. The judgment at the time was simple: it was forming a base without breaking down, and someone would always buy the dip, so there was no need to scare myself. So I didn’t tinker with anything, set my stop-loss, and closed the app.

Then I opened the market this morning, and 2505.95 gave me a direct surprise. This move up from 2111.16 went even more smoothly than I expected. Calculated out, the +3252.19% gain is a
post-image
ZEC+19.99%
SOL+2.40%
Load More

Join 40 M users in our growing community

⚡️ Join 40 M users in the crypto craze discussion

💬 Engage with your favorite top creators

👍 See what interests you

View More