Square
Following
Hot
News
Notifications
Profile
Share your thoughts
placeholder
Article
Short $WLD . Ideal entry range: 0.3422 - 0.3482. Target: 0.3304 - 0.3186. Stop-loss: 0.3586. WLD seems allergic to green candles; bears are firmly in control, waiting for a retest. Note: The 1-hour RSI is oversold, increasing the risk of a brief, sharp short squeeze or liquidity sweep. Don’t go all in, mate. Size your position according to your account balance.
post-image
WLD-5.61%
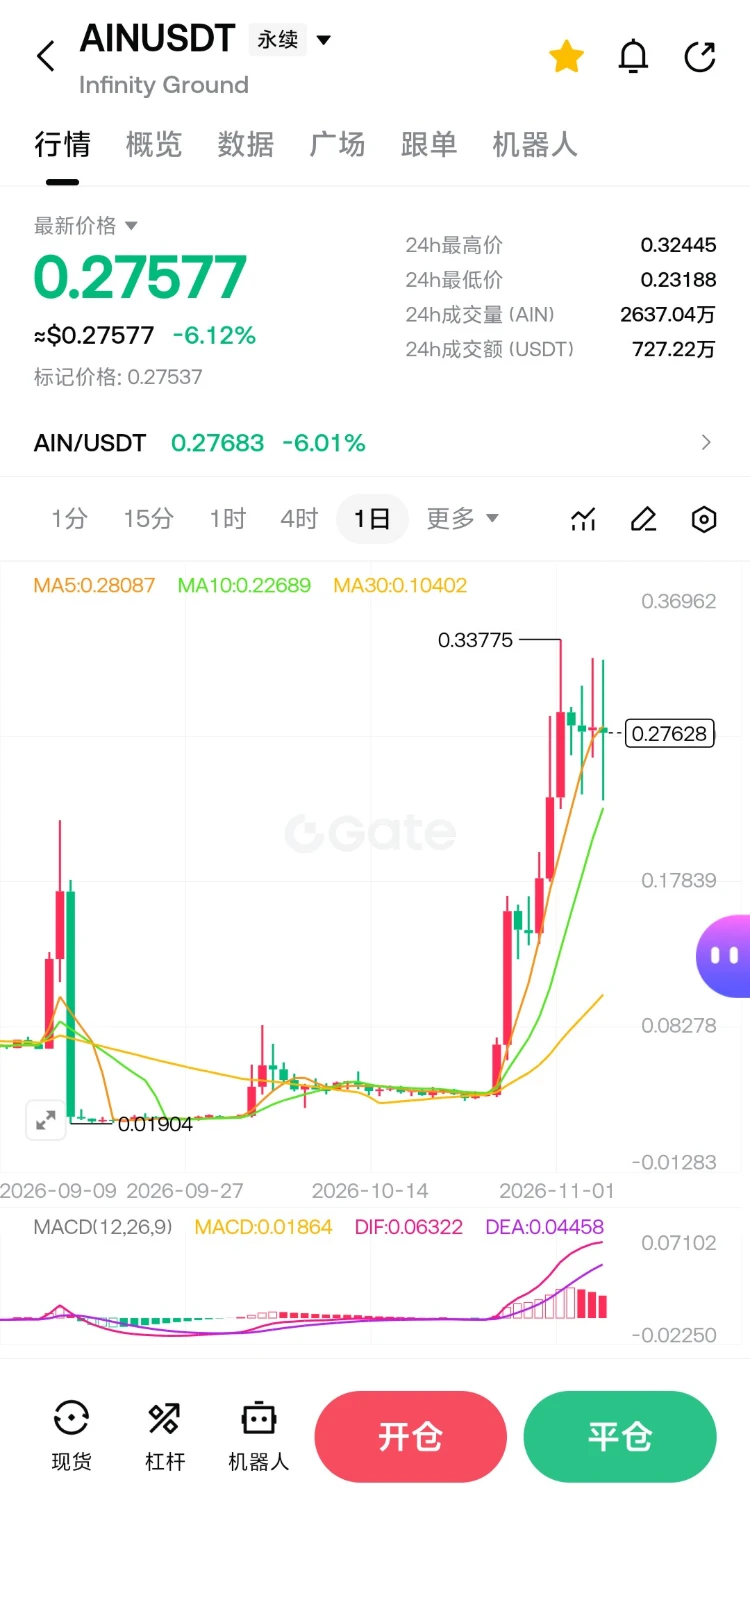
Super-strong altcoin, shorted around 0.32 and logged ✍️; it’ll probably still surge tomorrow
post-image
  • 1
Trenches
ZIG
Z
bade
b
ZIG
0x8c...1145
Market Cap
$.
Change
.
24h Vol
$.
Holders
.
BTC
B
bade
b
BTC
C5xp...pump
Market Cap
$.
Change
.
24h Vol
$.
Holders
.
HIGH
H
bade
b
HIGH
7ymF...high
Market Cap
$.
Change
.
24h Vol
$.
Holders
.
STONK
S
bade
b
STONK
6GmA...UNgx
Market Cap
$.
Change
.
24h Vol
$.
Holders
.
CORLA
C
bade
b
CORLA
0xba...7777
Market Cap
$.
Change
.
24h Vol
$.
Holders
.
Future fest is not here to play this time around🔥 momentum is already building and I can See party announcements happening already . I’m so ready #FutureFest26
Something to ponder.
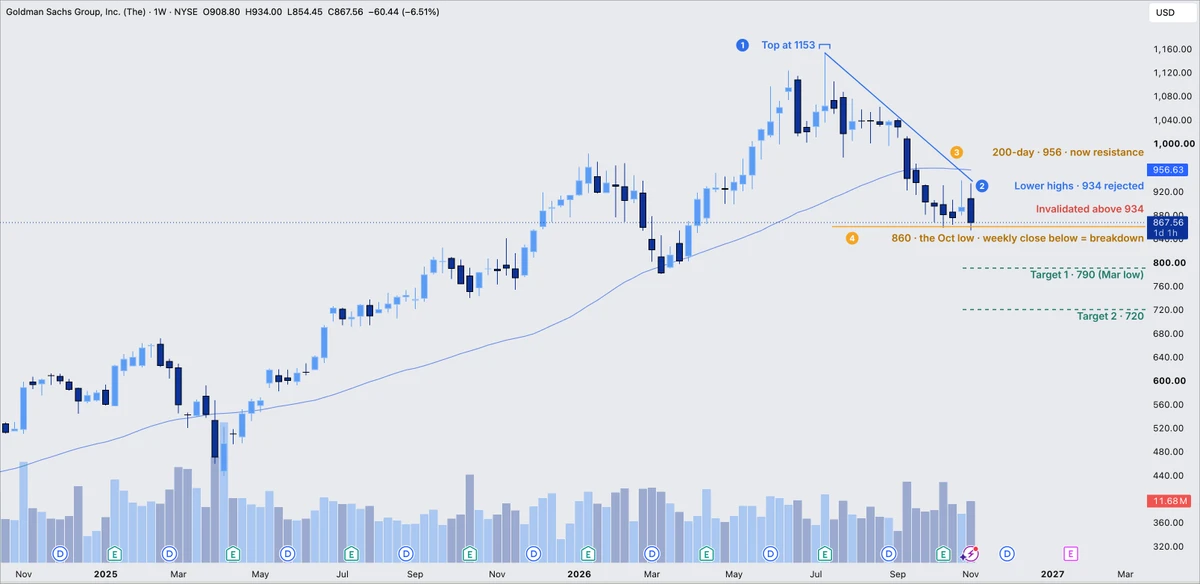
AI names were brutally crushed today, which makes me wonder one thing. Do they start coming after financials and healthcare next?
This would be interesting considering how well some of these names have held up relative to the broader market.
$GS is now sitting at a major inflection point, right below the key $860 weekly level.
Worth keeping a close eye on for another leg lower if it fails to reclaim that level.
post-image
GS-6.44%
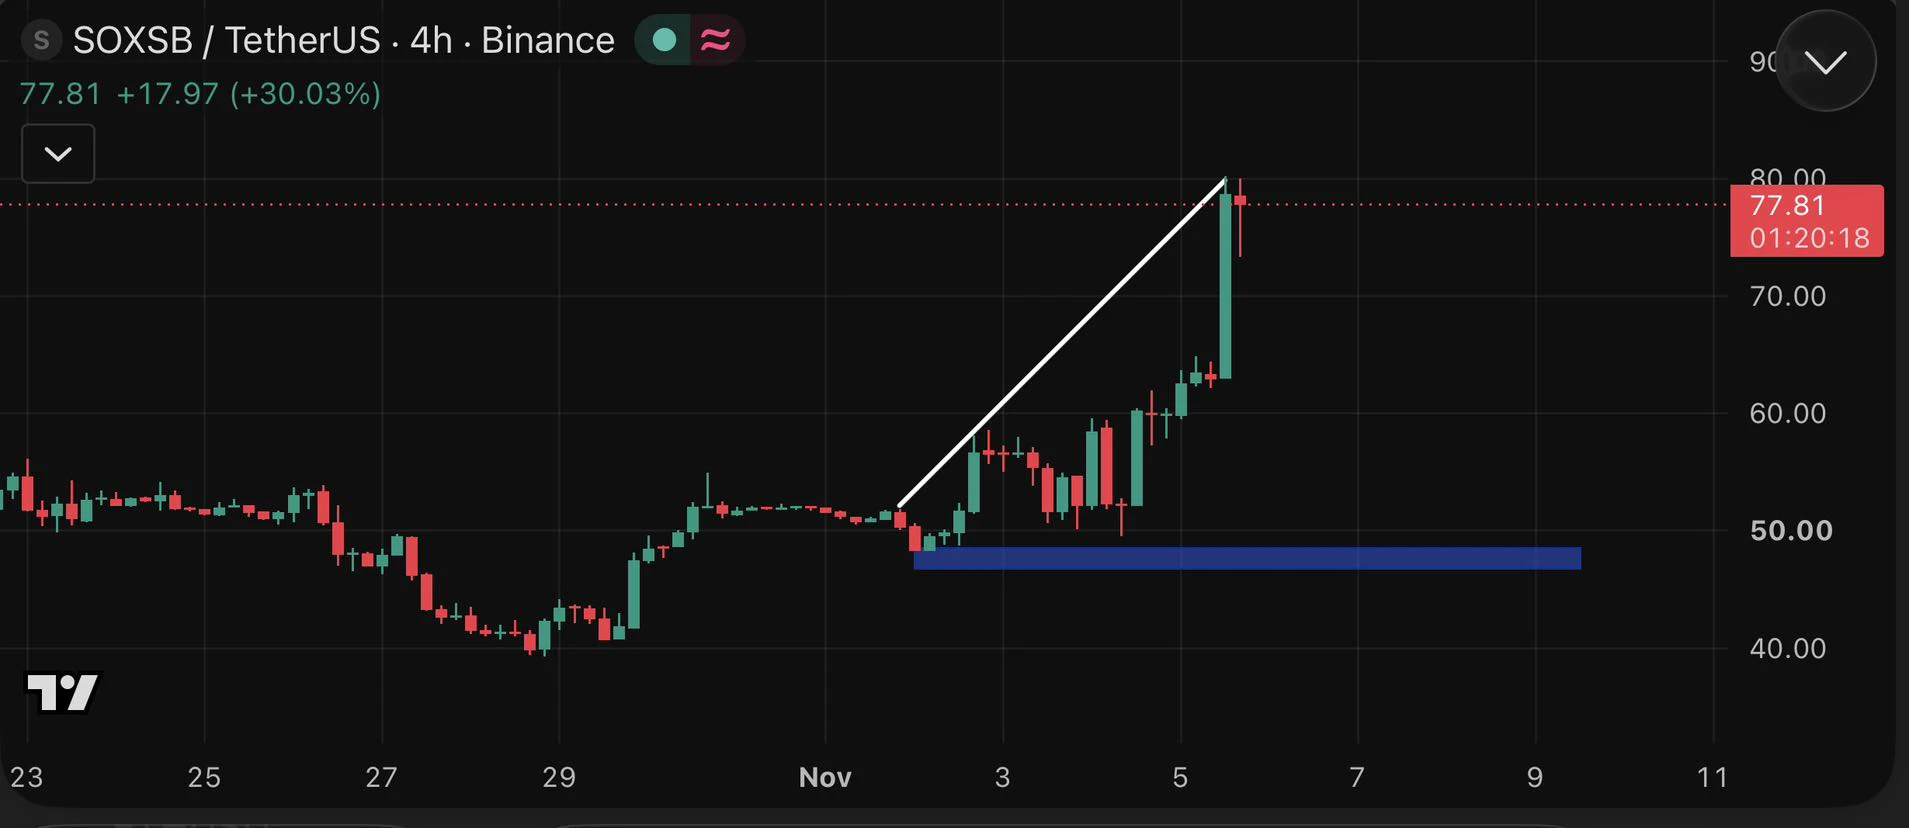
$SOXS is gaining attention after a strong 30% rally!

I’m watching the $70–$73 zone for a possible pullback and buying opportunity.

Targets: $80 | $85 | $90

If buyers defend support, another upward move could follow. Losing $70 may weaken the bullish setup.

I’m waiting for a clean entry instead of chasing the pump.

#SOXSB #Crypto #Trading
post-image
SOXS+1.46%
  • 3
  • 1
🔹Chip Stocks Are Falling, but Demand Hasnt Weakened? With Democratic Regulatory Expectations Shakin
live-cover
LIVE89
$ETH Ready for a rebound? Bulls are once again targeting 2365. Long entry plan: 2255 - 2265; Take-profit 1: 2300; Take-profit 2: 2330; Final target: 2365; Stop-loss: 2200. ETH faced strong selling pressure near 2450, but buyers are trying to push the price back up around 2250. As long as the 2200 support holds, I remain bullish on a rebound to 2300 – 2365. If the price breaks below 2200, this plan will weaken. Bulls still have hope... Let's see if buyers can take control again. Trade ID: $ETH
post-image
ETH-1.26%
A-Share and Hong Kong Stock Markets Weaken in Pre-Market Trading! ChangXin
live-cover
LIVE43
Guys, $XRP is dropping again! After facing resistance near $1.2458, sellers remain in control. If it breaks below again, $XRP could fall toward $1.20. Entry zone: $1.2320 – $1.2400Target levels: $1.2250 / $1.2100 / $1.2000Stop-loss: $1.2500
post-image
XRP-1.15%
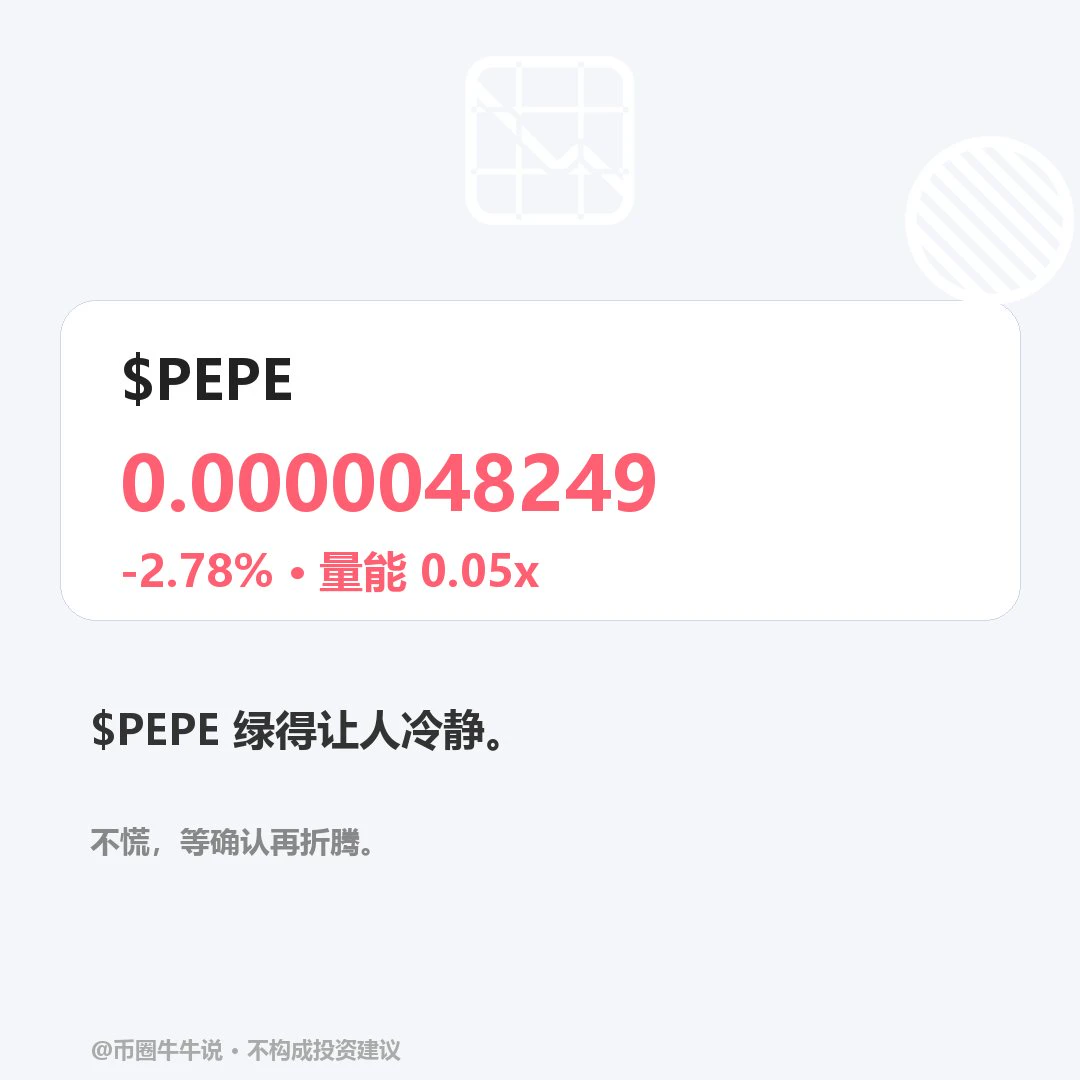
$PEPE Currently at 0.0000048249, down 2.78% over 24H (0.000004629–0.000005104). The 1H outlook is weak: RSI is 40.45, and the current price is below the EMA20 at 0.0000048721. The 4H outlook is weak: RSI is 47.34, and the current price is below the EMA20 at 0.0000048859. The 1H volume ratio is 0.05. If the price holds above the 0.000005104 resistance level, watch for continuation; if it breaks below the 0.000004629 support level, the short-term outlook weakens. In a later review, check whether the price can hold above 0.0000051 and whether it can recover after losing 0.00000463. Volume is only
post-image
PEPE+0.97%
$SOL ‌ Potential for a continued decline following a minor rebound. Trend: Strongly bearish; selling pressure remains dominant. Support: 88.76 – 88.41. Resistance: 90.70 – 94.14. MACD: Negative; bearish momentum persists. Conclusion: SOL may retest the 88.76 level. If this support is breached, the decline could extend further. A stronger bullish signal would emerge only if the price manages to break back above 90.70.

Note: Crypto and stock transactions carry the risk of loss. Please conduct your own research (DYOR) before trading. This information is for general purposes only and does not co
post-image
SOL-0.74%
  • 3
Retail investor: I take profits every time I'm up 25%. Lock it in, never go broke taking gains.
Me: Look at that 5 year chart. How many "25% moves" are on it?
Retail investor: A few... but they kept going after.
Me: Right. So every time you locked in 25%, the thing kept running & you were out. Then you paid taxes on the gain, so you need your next pick to work just to catch back up to taxes paid.
Retail investor: I mean I have to sell sometime.
Me: Do you? Here's what the wealthy actually do. They don't sell their best shares. Ever. They get their cash a different way.
Retail investor: Which i
Sanders calls for a pause on AI data centers. The U.S. is hitting the brakes, but China won’t wait. In this tech race, whoever stops falls behind. It’s that simple. If you think I’m talking nonsense, take a screenshot and save it.
post-image
  • 6
Crypto investors often focus on the candlestick patterns on their screens. But have you ever considered the invisible hand that moves those candles?

Sometimes, the source of the biggest market movement isn't hidden in the Bitcoin chart or the news feed of an altcoin. The real scenario is often written in the shadow of macroeconomic labels. Right now, we're looking at one of those shadows: the Dollar Index (DXY).

The data on the chart is quite clear: the DXY is at 101.62 today, with a modest increase of 0.09%. However, this small green candle shouldn't mislead investor psychology. Because the
post-image
BTC-0.67%
ETH-1.26%
XAU+0.38%
XAG+0.47%
NAS100-7.02%
  • 9
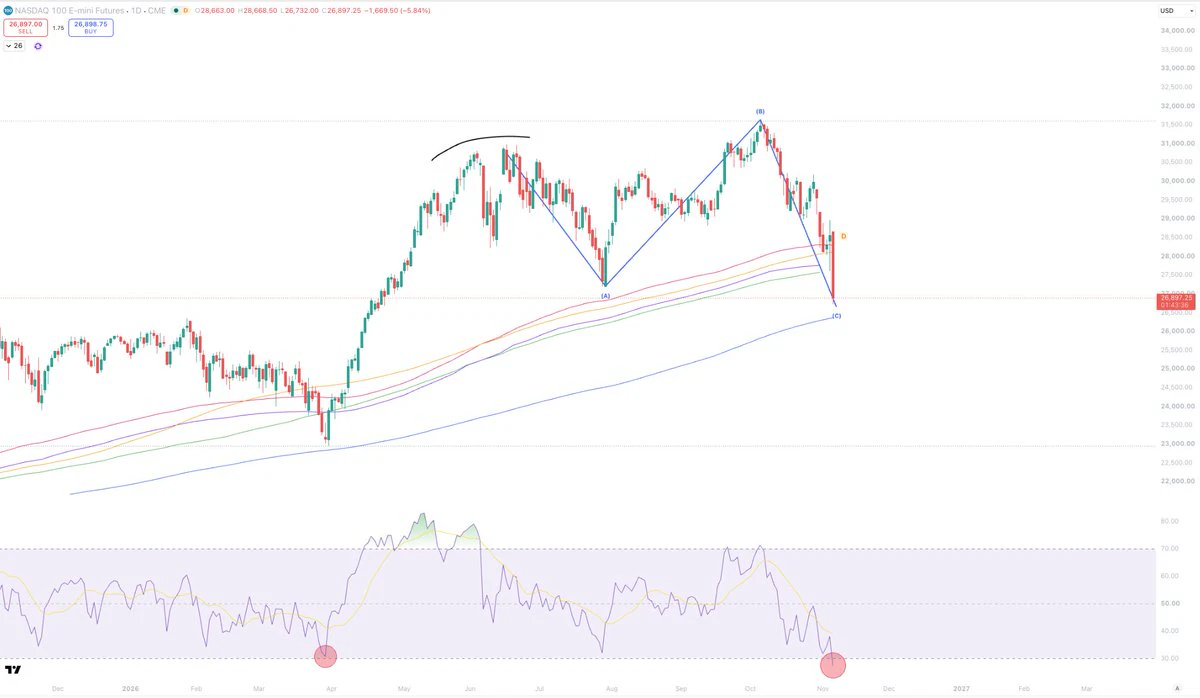
I think you could bid this Nasdaq nuke pretty comfortably.
Scary headlines out there but this looks like a pretty textbook expanded flat.
The VIX up 64% today which historically a buy signal.
And the lowest Daily RSI reading in 17 months.
These kinds of RSI readings are very uncommon in equities.
post-image
NDAQ-2.63%
$GVZ ‌$XAU ‌
With the price of gold trading at $4,093, many investors in the market are focused solely on the charts, asking, "Is it heading up or down?" Yet, the true dynamic driving gold lies much deeper—hidden within the complex equation of the bond markets.

To view gold merely as a "safe haven" is to overlook the macroeconomic realities of 2026. Three fundamental factors are currently shaping gold: real yields, bond interest rates, and market volatility. Let’s break down this equation, step by step.

📉 The Pressure of Real Yields: Gold’s Invisible Chain

By its very nature, gold is an
GVZ+2.87%
XAU+0.38%
  • 7
  • 3
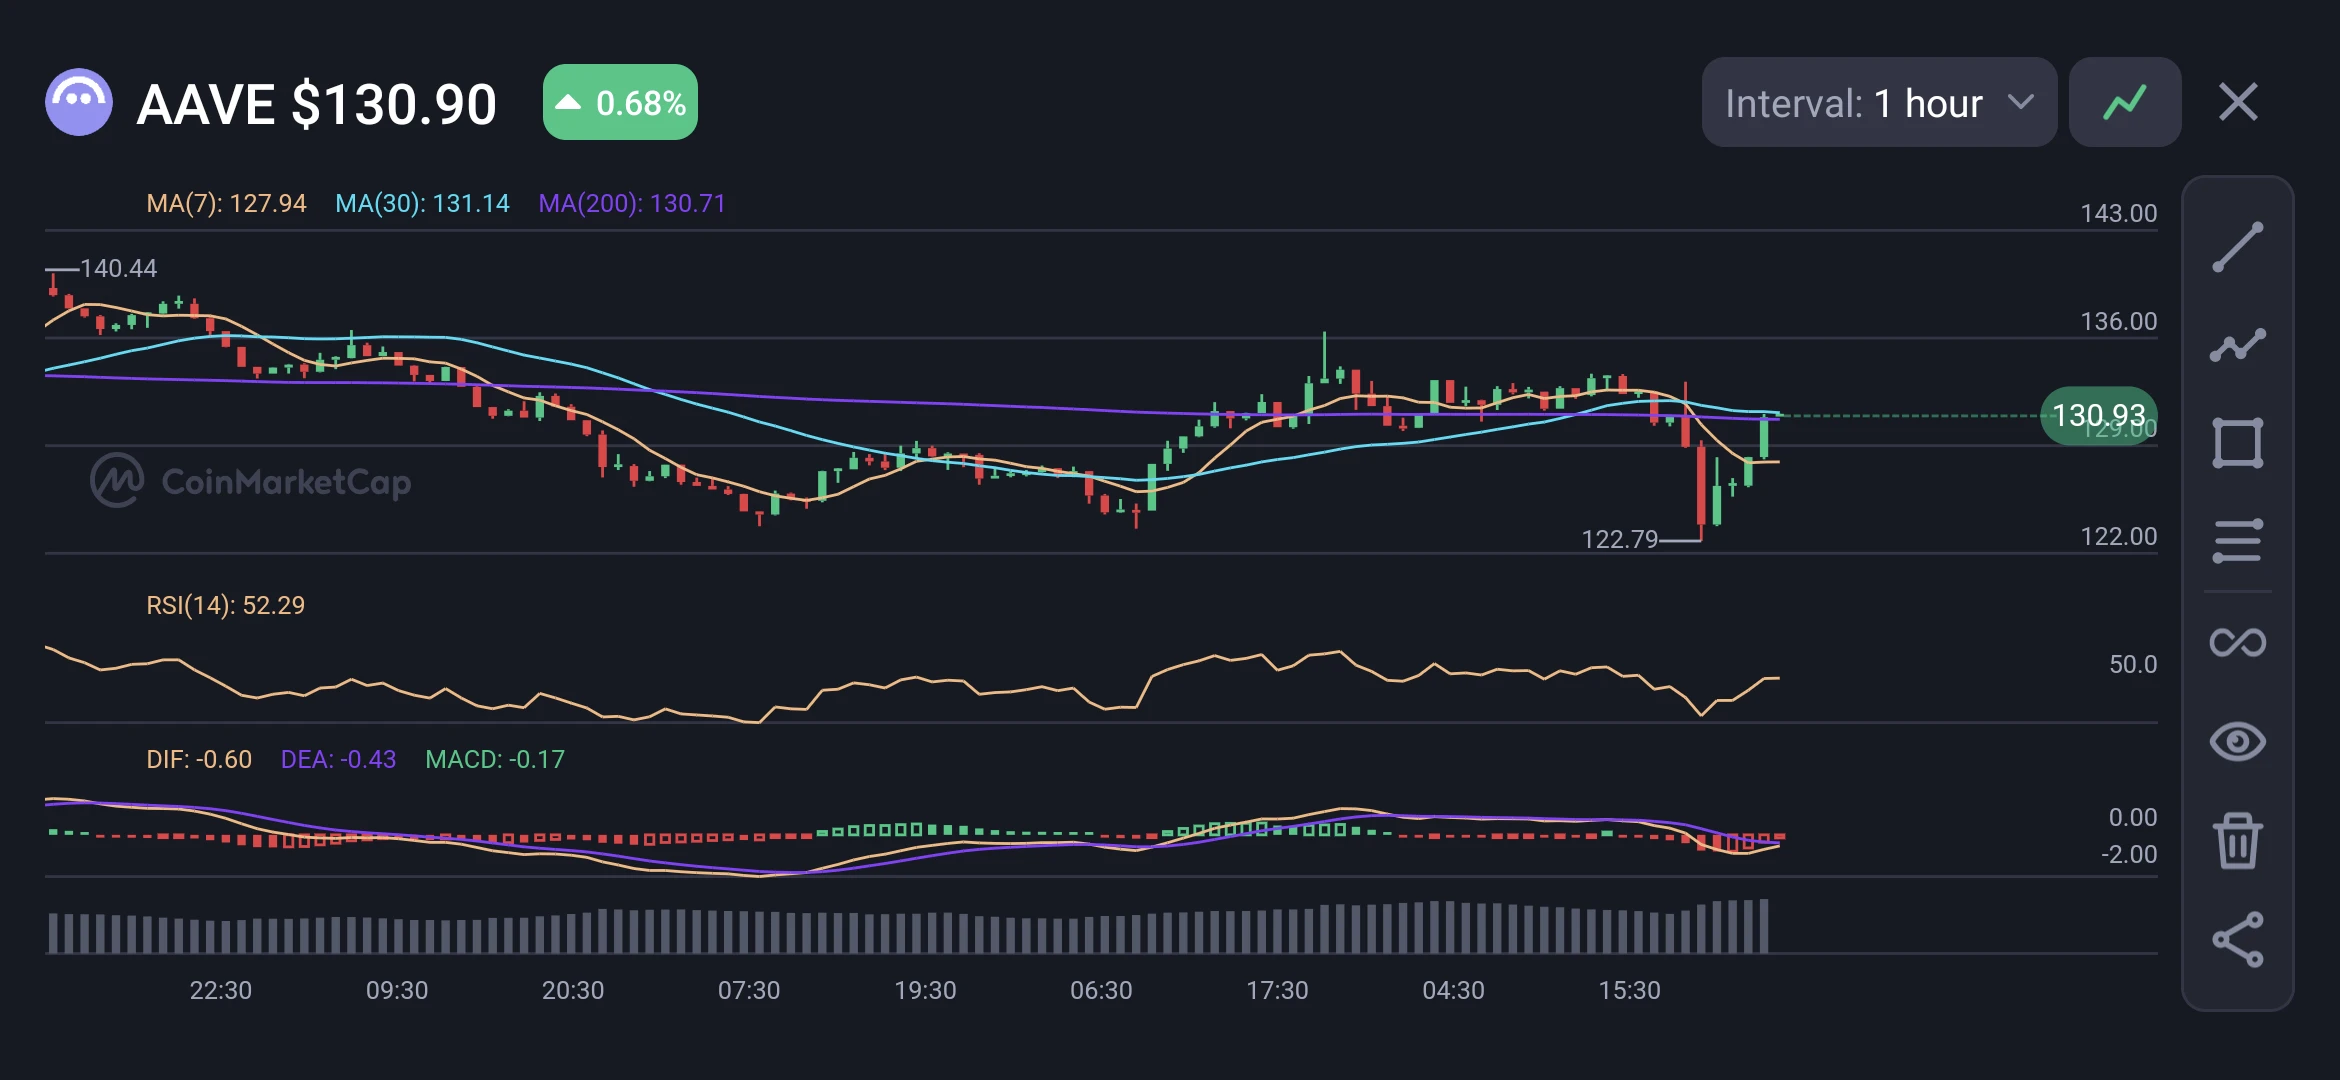
#aave
Technical Overview (1-Hour Chart)
​AAVE is trading at $130.90, rebounding sharply off a local panic low at $122.79. The recovery has brought price back into a critical multi-moving-average cluster:
​Moving Averages: Price is testing overhead resistance formed by the MA(200) at $130.71 and MA(30) at $131.14, while holding above the short-term MA(7) at $127.94.
​Momentum: RSI(14) sits at 52.29, resetting into neutral territory. MACD histogram has shrunk to -0.17, signaling fading bearish momentum as DIF (-0.60) converges toward DEA (-0.43) for a potential bullish crossover.
​Trade S
post-image
AAVE-1.22%
  • 1
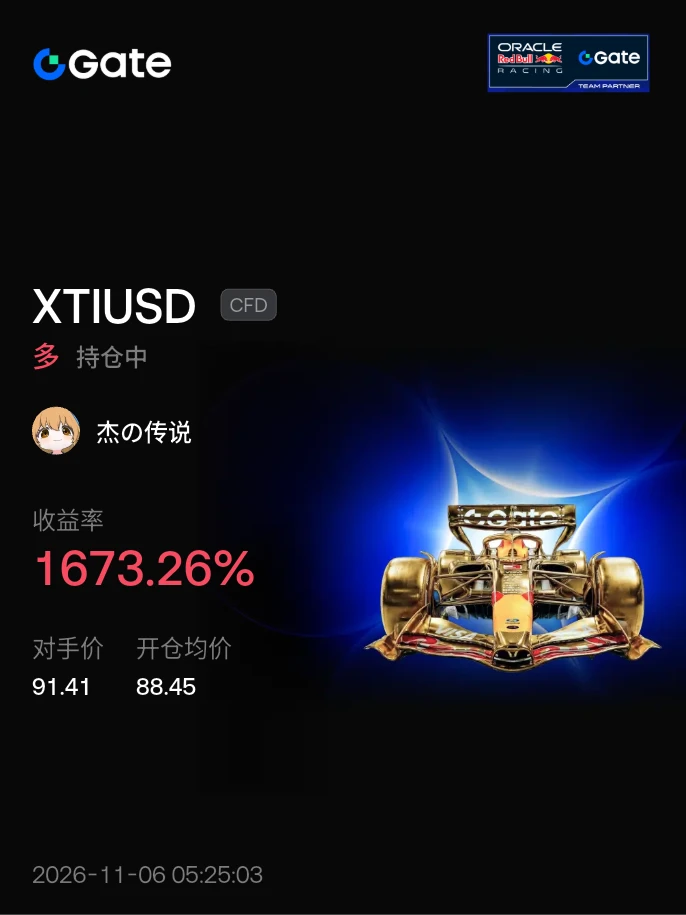
#晒出我的持仓收益 Almost at take-profit; already halfway there.
post-image
Democrats take both chambers, Jeffries officially goes after the speaker’s gavel, and Mississippi and Alaska are still counting—historians see it this way: whenever power changes hands, markets move on expectations first; once the dust settles, the trade is over. What do you think?
post-image
  • 10
Load More

Join 40 M users in our growing community

⚡️ Join 40 M users in the crypto craze discussion

💬 Engage with your favorite top creators

👍 See what interests you

Trending Topics

GateLaunchesPoSECProofOfSecurity

8.29k Views545 Discussing

Beyond Proof of Reserves, Gate has introduced PoSEC, a new Proof of Security framework focused on how user assets are stored and protected. By disclosing the distribution of assets across cold storage and hot wallets, users can directly understand Gate’s storage structure and risk coverage under extreme scenarios. Gate’s latest cold storage coverage ratio stands at 104.58%, meaning cold-storage assets alone are sufficient to cover all user assets. PoR verifies whether reserves are sufficient, while PoSEC shows how assets are stored and how risks are covered — together forming a more complete asset security framework. Share your results and experience! [👉 Learn more](https://gate.com/proof-of-security)

BTCBackAbove80K

132.11k Views41.58k Discussing

DemocratsWinBothChambers

29.06k Views535 Discussing

View More