Square
Following
Hot
News
Notifications
Profile
Share your thoughts
placeholder
Article
crypto market update
live-cover
LIVE2,236
BTC-0.67%
ETH-1.26%
USDC+0.01%
NEAR+1.17%
DOGE-0.22%
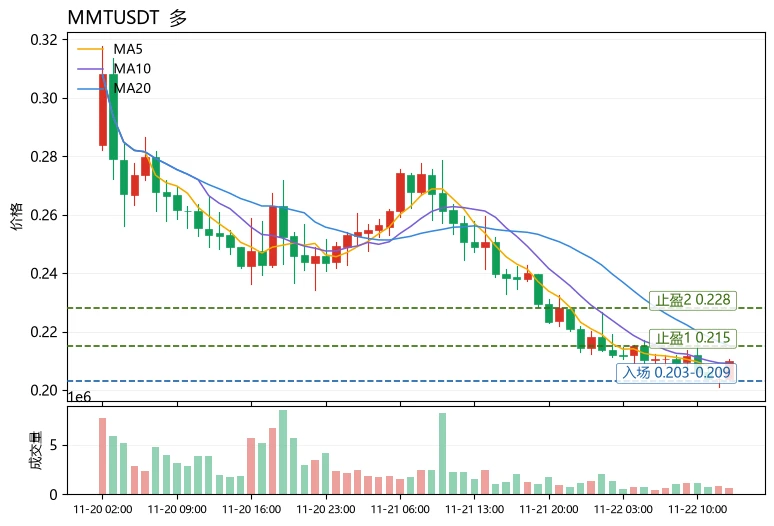
$MMT The short opportunity is right on the table—the needle at the top is the signal
Bottom line: $MMT The parabolic rally from around 0.30 has been completely erased, with a single-day drop of nearly 20%, almost nothing but red candles on the chart, sellers fully in control, and support levels breaking one after another. This isn’t a normal pullback; it’s a typical accelerated decline after a pump and dump.
My short setup:
- Entry zone: 0.2100 – 0.2160 (the current breakdown area is the entry window)- First target: 0.1950- Second target: 0.1800- Third target: 0.1650- Stop level: 0.2300
Why
post-image
MMT-2.35%
Trenches
IDOL
I
bade
b
IDOL
0x3b...ab07
Market Cap
$.
Change
.
24h Vol
$.
Holders
.
JAGENT
J
bade
b
JAGENT
0x8e...ae15
Market Cap
$.
Change
.
24h Vol
$.
Holders
.
PIEVERSE
P
bade
b
PIEVERSE
0x0e...25a9
Market Cap
$.
Change
.
24h Vol
$.
Holders
.
FIONA
F
bade
b
FIONA
B34n...pump
Market Cap
$.
Change
.
24h Vol
$.
Holders
.
CLAUDIA
C
bade
b
CLAUDIA
2j5S...W2ZM
Market Cap
$.
Change
.
24h Vol
$.
Holders
.
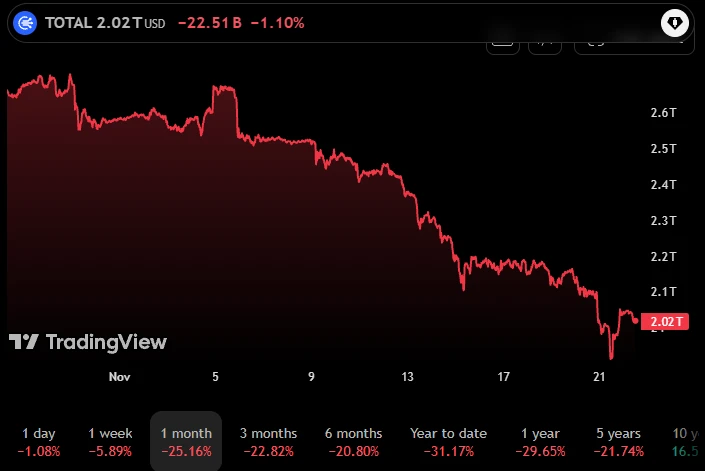
#Gate股票畅聊季 A Logical Breakdown of the Deep Correction in U.S. AI Stocks: Panic Pricing, Expectations Mismatch, and Diverging Long-Term Value

The U.S. stock market has recently experienced sharp volatility. Over the past 45 days, the S&P 500 and core AI assets have suffered significant pullbacks, with market capitalization losses reaching as much as $6 trillion. Market sentiment is currently at an extreme fear level. Drawing on recent market conditions and the perspectives of leading institutions, this report breaks down the four core factors behind the latest selloff: AI capital expenditure,
SPYX+0.01%
AMZN-3.90%
MSFT-2.61%
NVDA-13.84%
AMD-13.27%
  • 3
  • 1
"Just one more dip before up only"
post-image
  • 1
$MMT has fallen harder than its peers amid extreme fear—is it unfairly sold off or a continuation of the downtrend? The answer leans toward the latter, with a short-term recovery: it is the weakest in relative strength (24h -17.74%, 37% amplitude, far exceeding $APT ’s 11.89% and $RARE ’s 25.62%), but the MACD histogram has turned positive and RSI at 38.5 has not broken below 30, indicating that bearish momentum is fading. This is an oversold bounce window for a highly volatile asset, not a trend reversal.
Price-wise, the current price of 0.21 is above MA5 (0.20706) and below MA20 (0.21513);
post-image
MMT-2.35%
APT-1.51%
RARE-0.89%
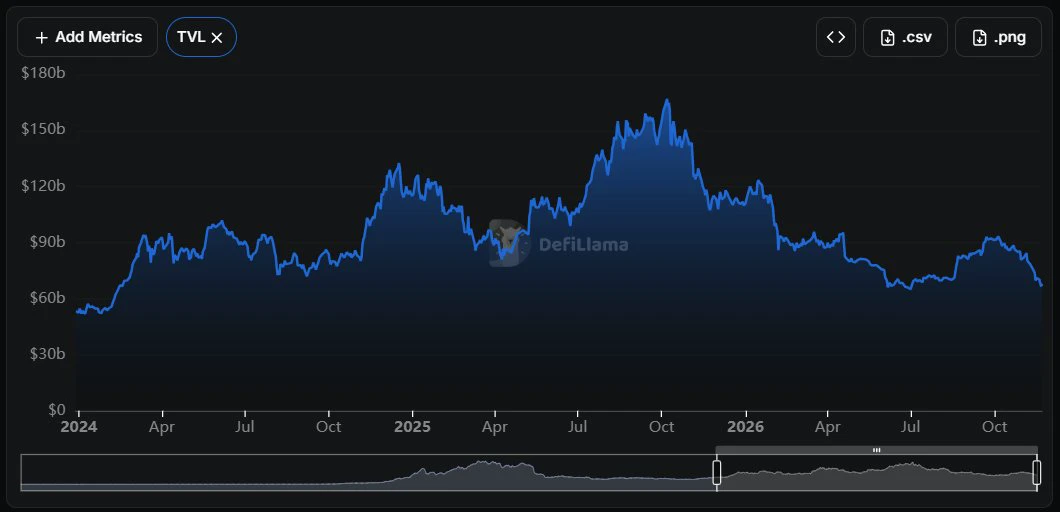
nearly $100B wiped out from DeFi TVL
down from $166B to $67B in just over a year
post-image
$CAP U After an approximately 4-month rally, it surged more than 760% from a low of $0.015 to a high of $0.131. However, the current price structure shows signs of a bearish reversal. After several sharp swings, the price has been unable to sustain its previous upward momentum. Selling pressure is becoming increasingly evident, and the current price level could trigger a major correction.
$CAP – Short entry: $0.098 – $0.103 Stop loss: $0.113 Take profit 1: $0.080 Take profit 2: $0.075 Take profit 3: $0.068 Take profit 4: $0.055
post-image
CAPU
CAPUCapu
Pump.Fun
MC:$2.8KHolders:1
0%
CAP+8.34%
Jim Simons’ Quant Machine: A Sneak Peek at Renaissance Technologies’ Algorithmic Edge
Jim Simons' Renaissance Technologies is famous for its mysterious, math-driven trading algorithms, and their current smaller allocations of 1.66% in UTHR (United Therapeutics) and 1.60% in PLTR (Palantir) reveal a very specific, data-backed strategy. The inclusion of PLTR highlights their quant models finding value in big data and AI-driven government contracts, while UTHR shows their algorithms spotting fundamental value in the biotech sector. The takeaway here is that unlike retail traders who chase hype, q
post-image
UTHR-0.88%
PLTR-6.45%
$AKE Which comments to delete
post-image
AKE+6.07%
November 22, 2026 11:47【Lao Fan · BTC/ETH Outlook】Bearish; wait for a rebound to short
BTC: 4-hour, daily, and weekly trends are all down, with price below the 4h MA20/50/200. Scale into shorts on a rebound to 60,300–60,759, stop-loss at 61,900, targets at 57,711 / 55,900; invalidated if a 4h candle closes above 60,984.
ETH: Moving in sync. Scale into shorts on a rebound to 1,690–1,703, stop-loss at 1,745, targets at 1,579 / 1,535; invalidated if a 4h candle closes above 1,716.
Keep risk per trade below 1% of the account; don't go all-in or max out leverage.
For record-keeping only; not invest
BTC-0.65%
ETH-1.23%
ICNT | Short 🔴 | Bearish | 15m 24h: -9.91% | Volume: 34.1M USDT Short rationale: Price is below EMA200; EMA20/50/200 are bearishly aligned; RSI14 is 39.3; MACD histogram is negative; ADX14 is 15.8; volume is 0.66 times the 20-candle average; trend pullback/continuation. Entry: 0.342 Stop-loss: 0.355789 Take-profit 1: 0.324764 | Take-profit 2: 0.314422 | Take-profit 3: 0.300633 Entry price is for reference only; do not chase trades. The strategy is invalidated if the stop-loss is hit. This is a technical analysis strategy only and does not constitute investment advice. $ICNT
post-image
ICNT-10.32%
BlackRock’s Trillion-Dollar Blueprint: Why the Asset King Is Betting on NVIDIA and Treasury Bonds
BlackRock, the world’s largest asset manager, is balancing extreme growth with extreme safety, holding 3.70% in NVIDIA (NVDA) and 3.26% in SHYG (High Yield Corporate Bond ETF). This is a masterclass in barbell investing: they are riding the AI wave with NVDA to capture explosive upside, while simultaneously holding high-yield bonds to generate steady income and protect against equity drawdowns. For crypto and stock traders, this shows that even the biggest bulls are hedging their bets; you should
post-image
BLK-3.02%
NVDA-13.84%
  • 4
$EVAA It plunged, and I'm finally in profit. That damn market maker looks ready to push it back up again. The long position hasn't been reduced, and the market maker's position is still open. I took profit on my short and got out; I'll wait for it to go back up before shorting again
post-image
EVAA-0.49%
Live Crypto Market Watch | BTC, ETH & Altcoins
live-cover
LIVE1,852
BTC-0.65%
MU-13.88%
SKHYV-0.98%
META-5.82%
AMD-13.27%
Anthropic has $237 billion…
Damn, they're rich
post-image
ANT-8.68%
Bitcoin traded down to $55,100 on Saturday morning, its lowest price since September 2024, and finished the day around $60,100.
Everyone wants one reason. There are seven, and they all piled on this week.
1. The Fed is hiking. Hot October inflation has traders fully pricing a December rate increase, and Fed Governor Waller floated 50 basis points.
2. Cash pays again. Two-year Treasuries yield around 4.7%, so sitting still earns close to 5%.
3. The AI trade cracked. Anthropic opened at $111.50 on Thursday and closed Friday at $88.91. Nvidia and AMD each fell more than 13% in a day. The Nasdaq d
post-image
BTC-0.67%
ANT-8.68%
NVDA-13.84%
AMD-13.27%
MSTR-9.49%
Join the Gate 2026 Annual Gala: register to get 100 boost points and vote for your favorite stars of the year. For every 100 boost points you use, you get 1 draw chance(s) for a shot at surprise prizes. https://www.gate.com/competition/Annual-Gala?ref_type=165&ch=9940&ref=BVVEVQ9c
post-image
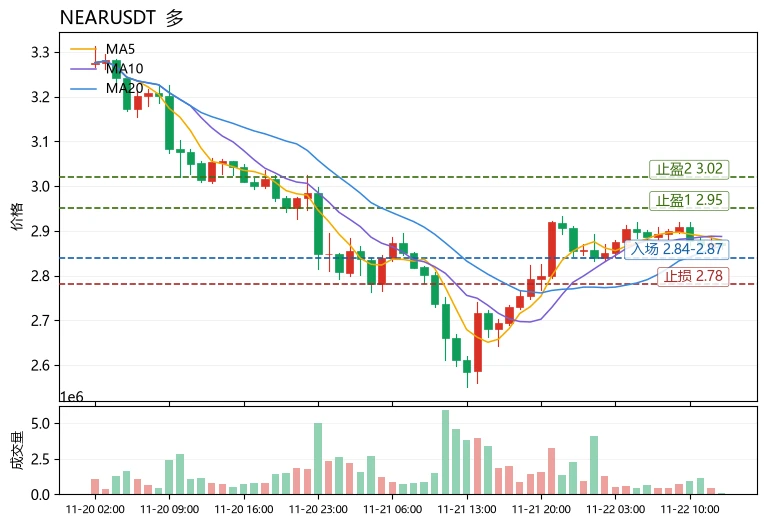
The most unusual detail in today's market is that the Fear & Greed Index has plunged to 11, in the extreme fear zone, yet $NEAR has rallied +10.22% against the trend, with its funding rate at +0.0068%—the only positive one in the market. Shorts are piling in amid the panic, while longs are paying to hold positions; funds are clearly leaning toward the long side. The price is above MA5 (2.8788) and MA20 (2.8661), the MACD histogram is holding bullish at +0.003905, and the RSI is only 50.9, showing no overbought conditions. The Bollinger upper band at 2.9495 still leaves room to run; however, t
post-image
NEAR+1.17%
SUI-1.05%
APT-1.51%
$BNB — Buyers are pushing to break through the price again 🚀BNB showed strong recovery momentum around $543. If buyers continue to control the situation and the price breaks through nearby resistance, we may see further gains toward the next resistance area. Trading strategy: long 📈Entry price: 541.50 – 544.00Take profit 1: 548.00Take profit 2: 551.00Take profit 3: 556.00Stop loss: 534.00
post-image
BNB-0.76%
Im touching grass niggas
post-image
  • 1
Load More

Join 40 M users in our growing community

⚡️ Join 40 M users in the crypto craze discussion

💬 Engage with your favorite top creators

👍 See what interests you

Trending Topics

BTCReboundFaces60KTest

2.1M Views30.1K Discussing

BTC rebounded from around $55,300 on November 21, briefly reclaiming $60,000 before pulling back to around $59,300. The $60K level is back in focus as traders assess whether the recovery can last. Is this rebound a sign of stabilization or a short-lived recovery? Would reclaiming and holding $60K be enough, or do you need confirmation from trading volume and fund flows?

PCEAndGDPDataNextWeek

257.8K Views2.6K Discussing

GateDirectIPOPhase3ANTAllocates92100Shares

811.6K Views5K Discussing

View More