
Square
Following
Hot
News
Notifications
Profile
Share your thoughts
placeholder
Article
What brand are those little cookies? I want to try them and see how good they are.
post-image
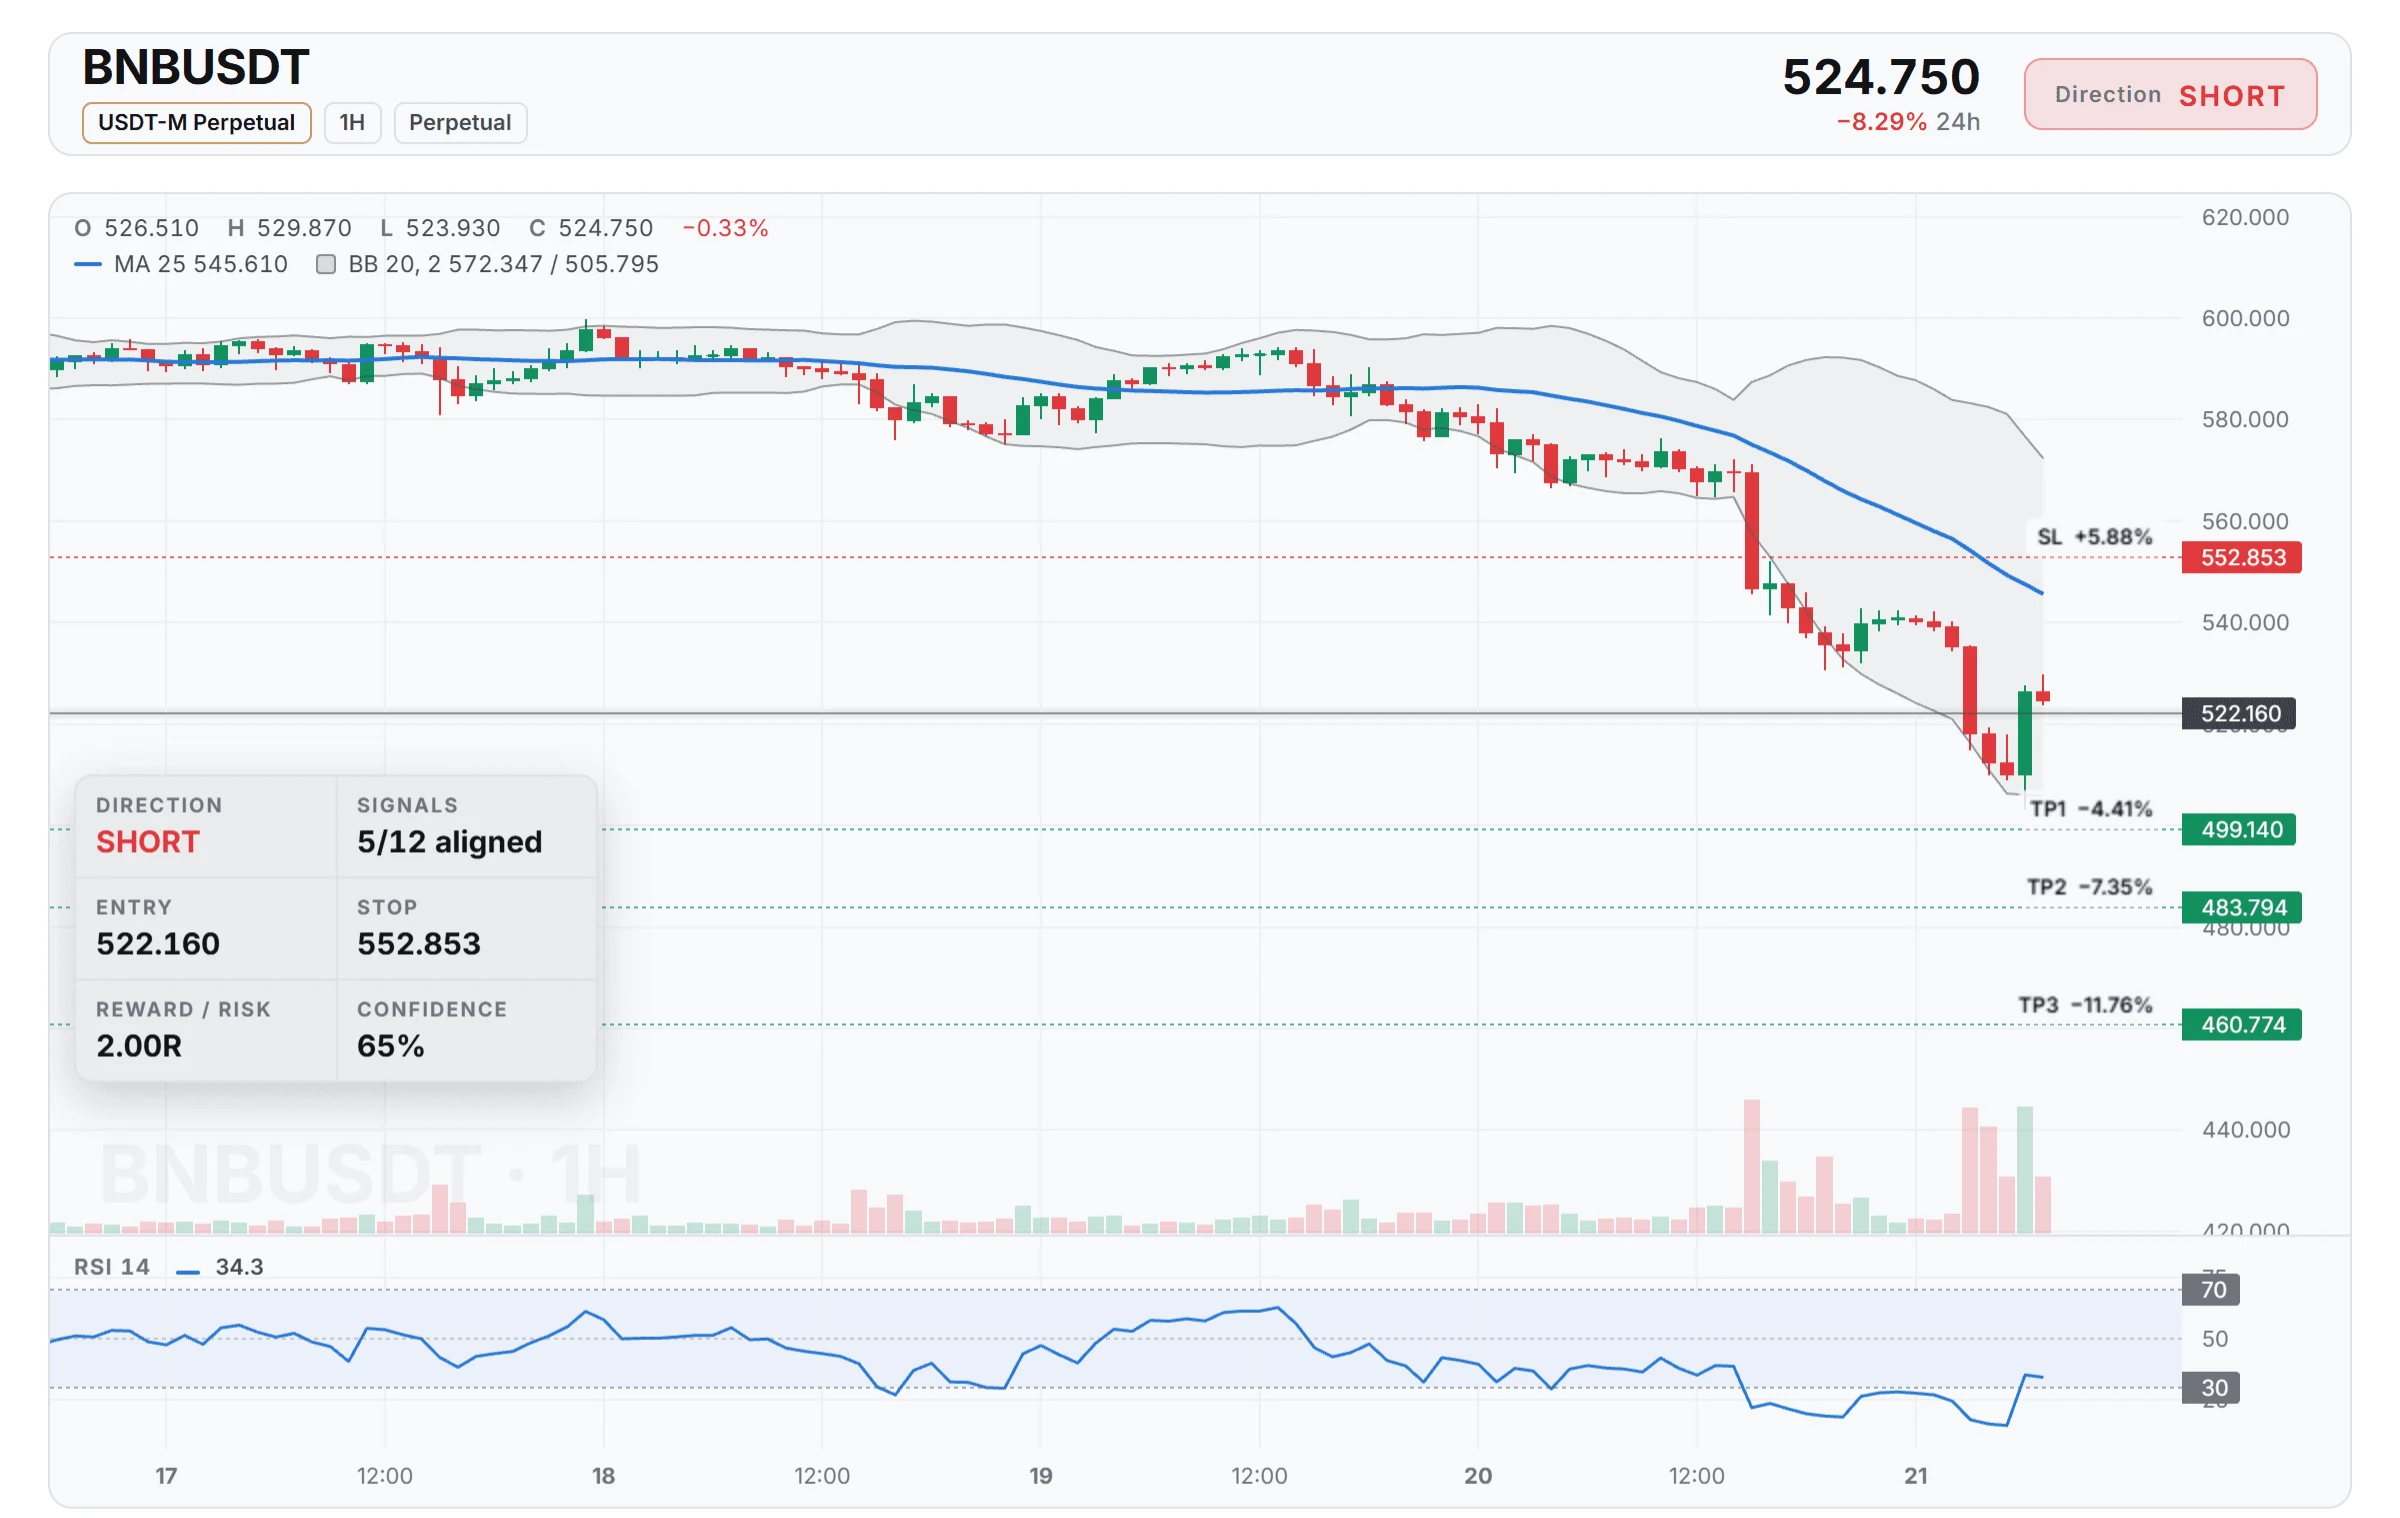
$BNB /USDT SHORT SETUP SHARP BREAKDOWN

$BNB /USDT
Direction: SHORT

Entry: 522.160
Stop Loss: 552.853

🎯 Targets:
TP1: 499.140
TP2: 483.794
TP3: 460.774

$BNB ‌
post-image
BNB-0.72%
Trenches
FIONA
F
bade
b
FIONA
B34n...pump
Market Cap
$.
Change
.
24h Vol
$.
Holders
.
PIEVERSE
P
bade
b
PIEVERSE
0x0e...25a9
Market Cap
$.
Change
.
24h Vol
$.
Holders
.
mihao
m
bade
b
mihao
4Cxj...pump
Market Cap
$
Change
.
24h Vol
$.
Holders
.
CLAUDIA
C
bade
b
CLAUDIA
2j5S...W2ZM
Market Cap
$.
Change
.
24h Vol
$.
Holders
.
IDOL
I
bade
b
IDOL
0x3b...ab07
Market Cap
$.
Change
.
24h Vol
$.
Holders
.
Looking at the market this morning, $RARE was up 20%, with a turnover of 78 million. Compare yesterday’s low of 0.0119 with today’s high of 0.0154, and there actually wasn’t much changing hands in between. The real anomaly isn’t this bullish candle, but the trading volume: the price rose 20.12%, yet turnover was only a little higher than usual, failing to keep pace with the price move.
It’s like an old car with its foot on the gas: the speed picks up, but the RPM doesn’t. There are three possible explanations. First, selling pressure was light to begin with, so even a little buying could push
RARE-0.89%
  • 1
#HYPE
I’m even saving my cigarette money to add to my position—see you in three years
post-image
HYPE+0.24%
  • 2
#Gate股票暢聊季 Nasdaq drops 5.28% in a single day, wiping out its gains for the year; Nvidia plunges 23% in a week as the AI boom faces a repricing

At Friday’s close, the Philadelphia Semiconductor Index fell 10.73% in a single day. Anthropic shares briefly dropped to $83.05 on their second day of trading, just 5 cents above their $83 offering price from the day before; they held at $88.91 at the close, down 8.5%, giving back most of their first-day gains. The selloff did not stop with the new listing. The Nasdaq Composite closed down 5.28% at 22617.73, wiping out its 2026 gains in one fell swoop
NAS100-0.07%
NVDA-13.84%
ANT-8.68%
VOLX+0.40%
XAU+0.38%
  • 5
  • 1
🔹 Arbitrum One’s stablecoin market cap grew by $327.4 million over the past 7 days
live-cover
LIVE3,303
BTC-0.67%
ETH-1.26%
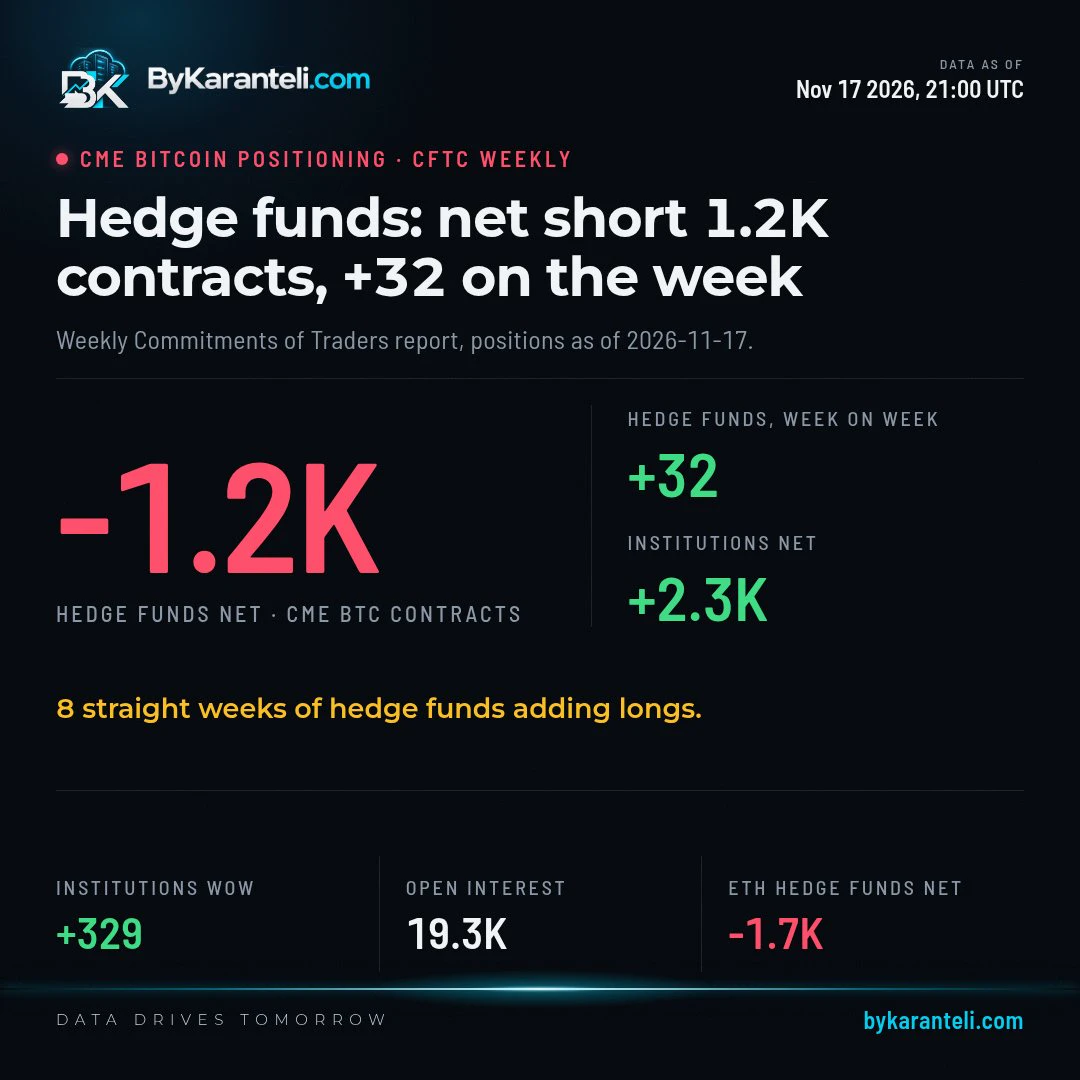
Hedge funds on CME $BTC futures added longs 8 weeks running and were still net short.
Their net position came to -1,211 contracts in the Nov 17 report.
post-image
BTC-0.65%
  • 1
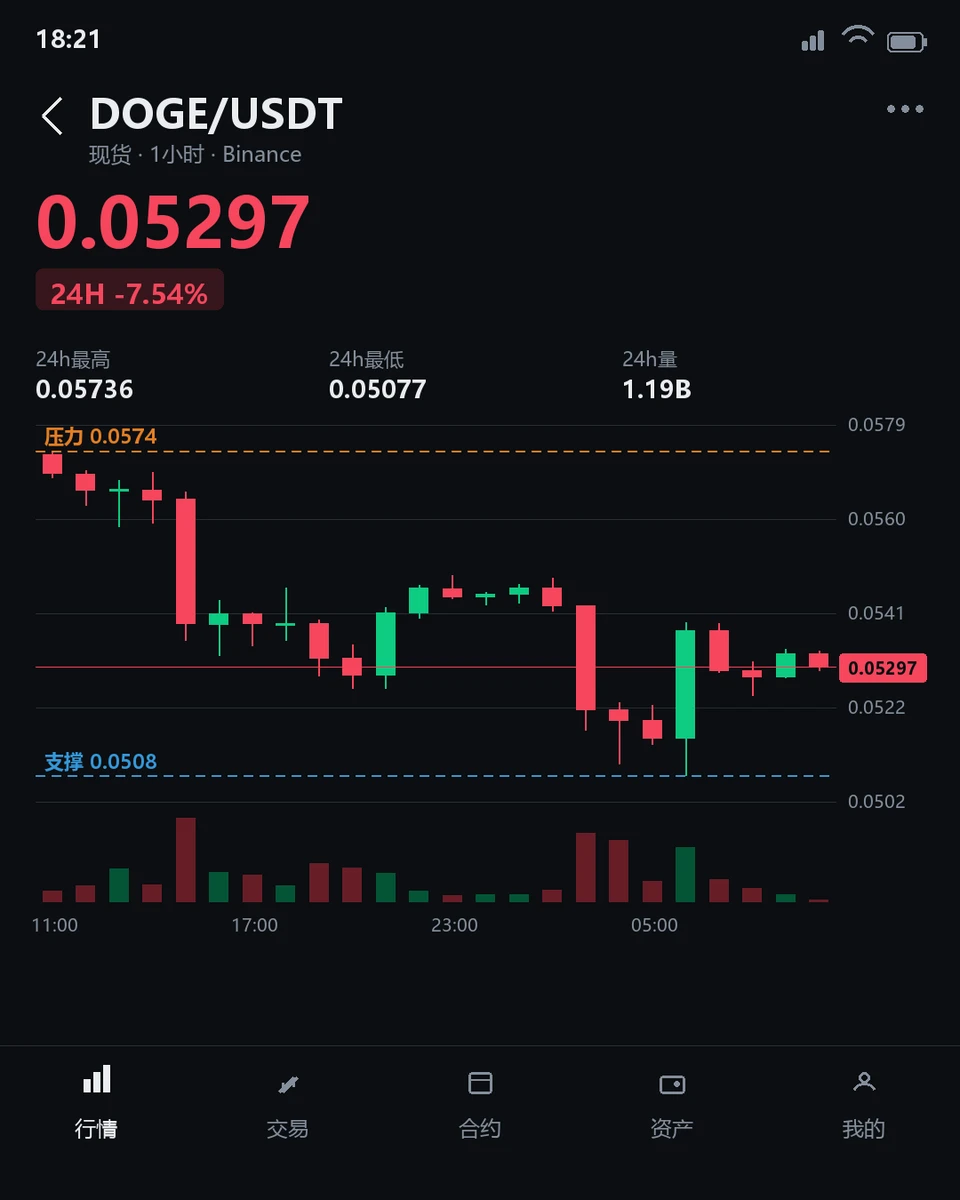
$DOGE Has Entered Oversold Territory, So Why Can’t We Say It Has Bottomed?

$DOGE is currently trading at 0.05296, down 7.06% over 24 hours, with an intraday range of 0.05077–0.05754. The 1-hour RSI14 is 50.78, in neutral territory, while the 4-hour RSI14 is deeply oversold at just 24.54. Both timeframes point to a weak trend, with the price trading below the 1-hour EMA20 (0.05379) and the 4-hour EMA20 (0.05622). The volume ratio is only 0.24, indicating extremely thin trading over the past hour, with no meaningful buying support emerging at the 0.05077 support level.

The core contradiction i
post-image
DOGE-0.22%
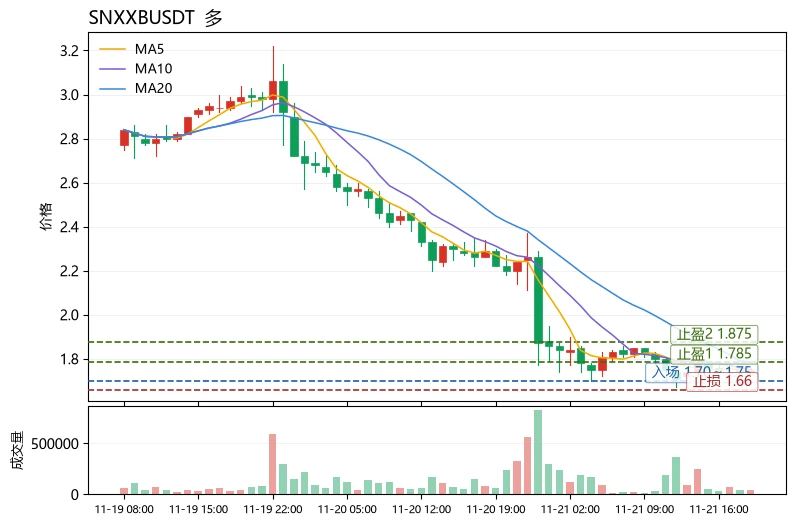
$SNXXB$SNXXB Conclusion first: This is an oversold bounce, not a trend reversal, and is only suitable for light-position short-term longs, not trend longs. The reason: The current price of 1.75 is still below MA20 (1.785). Although MA5 (1.744) is now close to the price, the moving averages have not yet formed a golden cross, and the medium-term trend has not recovered. However, the MACD histogram has turned positive (+0.02363), the price is near the lower Bollinger Band at 1.69478, and the RSI is only 32.0, in oversold territory. Combined with the extreme fear reading of 12 on the Fear & Greed
post-image
KERNEL-7.76%
BNB-0.76%
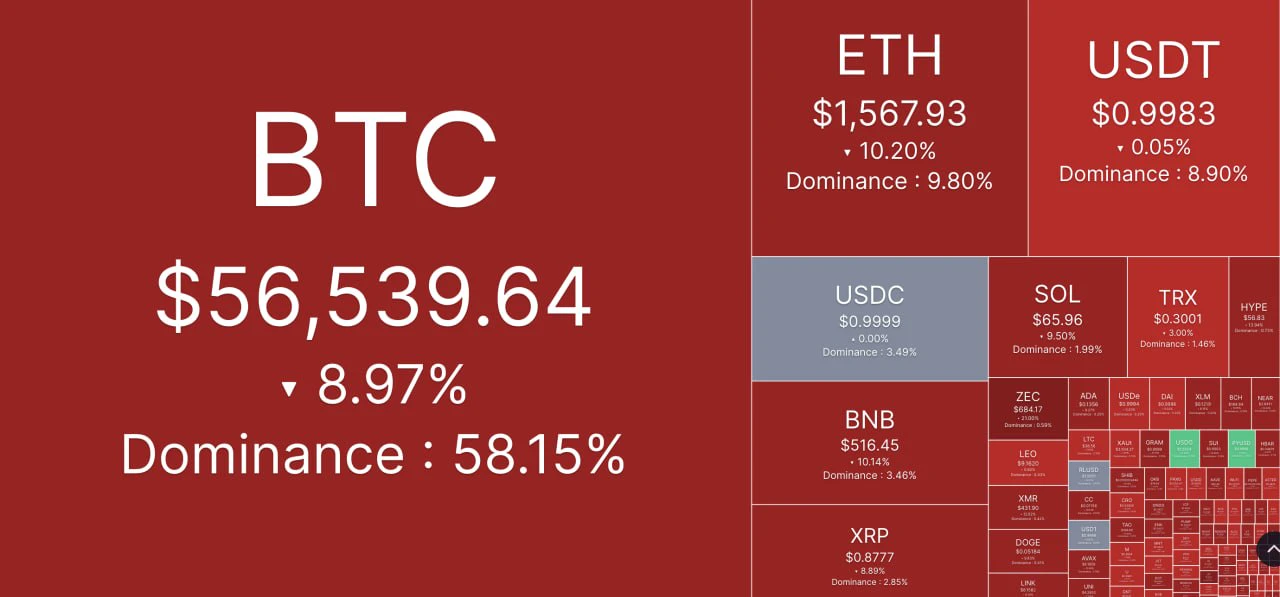
🔽 BTC officially hit a new low for 2026 – long positions worth $2 billion were liquidated.

💲 The S&P 500 lost $6 trillion in market capitalization this week – the worst performance since the 2020 coronavirus crisis.

Start your day with coffee or a walk; the most important thing is to avoid checking your exchange balance or brokerage account first. 🕓

$BTC
post-image
BTC-0.67%
Ordinary people are better off not investing—cash is king. Here’s a hard truth:
Most people haven’t even beaten the yield on Yu’e Bao. Risk assets will keep falling, so cash is king.
Only invest money you can afford to lose. So, can you win by taking out a loan against collateral to buy $crcl ?
The odds are about 55/45. If you’re really going to borrow from a bank to invest, can you handle the interest payments?
Can CRCL make money? Most likely, yes—it depends on the price you buy at.
If you bought the dip at 50 this year and sold at 100, you could still make money.
CRCL has now fallen below 5
CRCL-8.39%
GLDX-0.40%
PAXG+0.37%
$AKE I'm staying up for the candle on the 20th. It fell from an opening price of 0.010387 all the way to 0.0043726, down 45% on the day, breaking below the 0.0055 support level the entire CMC community was watching.

My 10x position was entered at 0.005856, with 201% unrealized profit, still a ways off my 0.00637 take-profit line. When 0.0055 broke overnight, I didn't wait for a bounce to take profit; I closed the 10x at 0.00532 and reopened at 25x at the same price.

I didn't increase my notional position by a penny. I did only one thing: changed “wait for 0.00637” to “go downstairs with it.”
AKE+6.39%
BTC-0.65%
ETH-1.23%
$PI Everything that needed to be sold has been sold. It's time to buy the dip!
post-image
PI-0.60%
  • 1
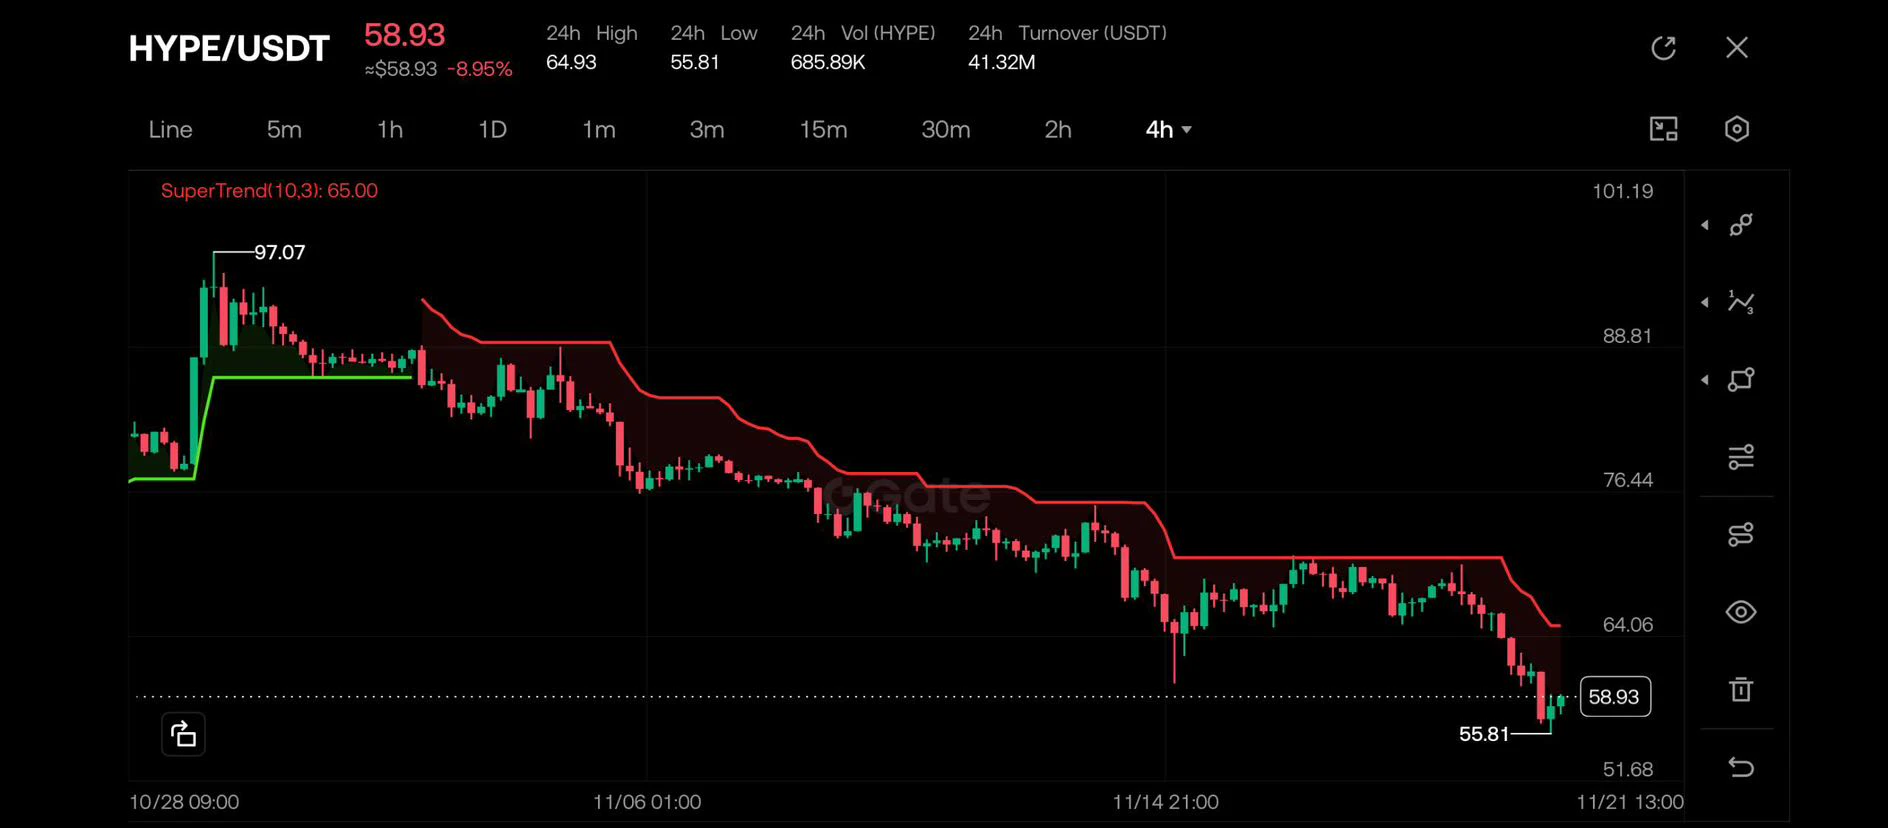
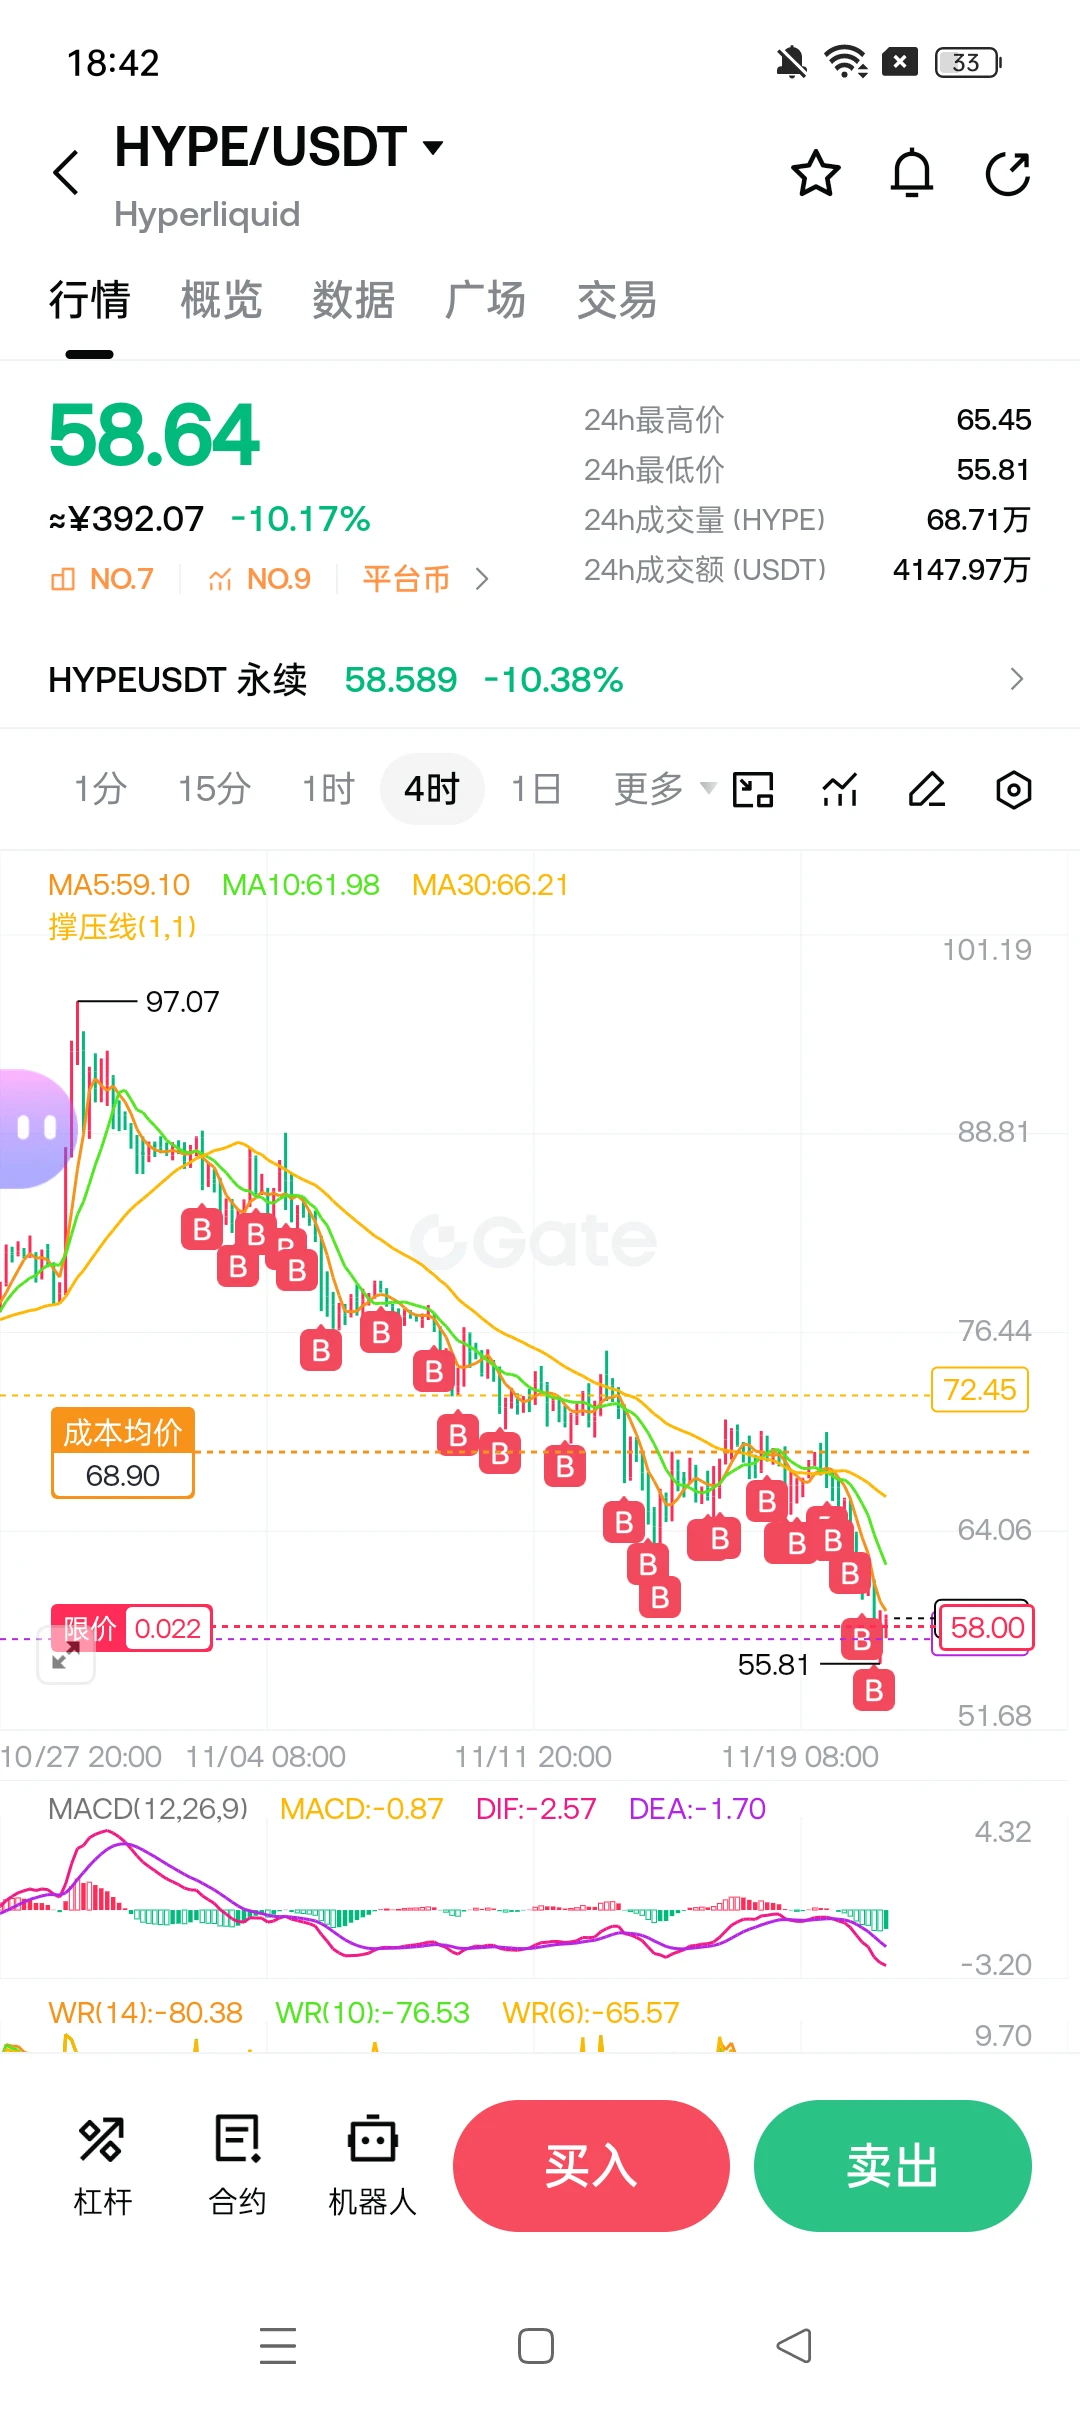
$HYPE

The broader market sell-off is weighing on price despite solid fundamentals.

$55.8 is the key support to hold, while $65 needs to be reclaimed to improve the outlook.

The chart is still under pressure, so I’d rather wait for confirmation than catch a falling knife.

Not financial advice. DYOR.
post-image
HYPE+0.24%
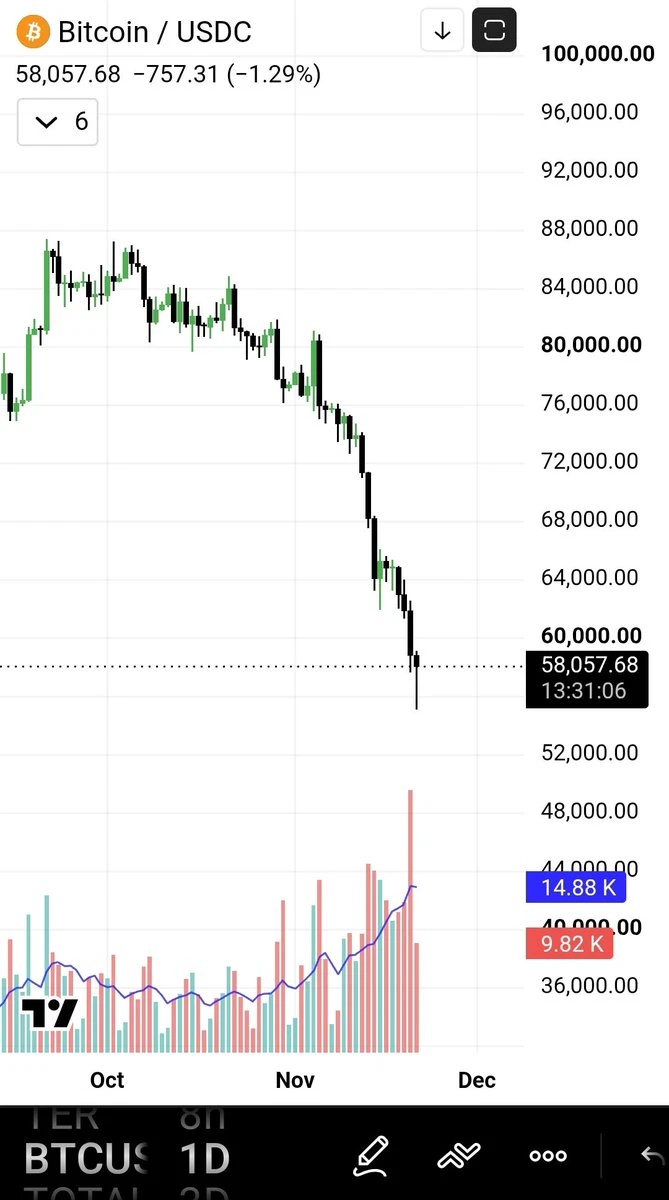
$BTC Bitcoin faces huge selling pressure! Will bears push BTC below $56,000? Trading strategy: Short entry range: $57,900–$58,100 Take-profit 1: $57,000 Take-profit 2: $56,000 Take-profit 3: $54,821 Stop-loss: $59,500 After falling more than 6% in 24 hours, Bitcoin remains under heavy bearish pressure. The price is struggling below the $58,700–$59,450 resistance zone. A confirmed break below this range could trigger another strong sell-off, pushing it toward lower support levels. Trade here $BTC 👇
post-image
BTC-0.65%
#英伟达单日重挫近14% If I could choose just one metric to judge whether AI stocks are worth repositioning in, I’d look at AI investment returns and free cash flow. It best answers the question: “Has the money burned turned into real cash?”

Why this metric
· Revenue growth can be misleading: Nvidia’s third-quarter revenue grew 103% year over year, yet its stock still fell for consecutive days. No matter how many orders there are, they have to translate into profits and cash.
· Free cash flow is the most honest measure: it’s the money earned from operations, minus spending on data centers and equipment
post-image
NVDA-13.84%
  • 4
Bulls $SOXS are in a strong uptrend, continuously breaking structure to the upside (BOS) and trading above the EMA 20/50/100/200. It is recommended to prioritize waiting for a pullback to the support zone before going long, avoiding FOMO at 82.04. Entry 1: 79.50 – 80.50 Entry 2: 77.00 – 78.00 Entry 3: 74.50 – 76.00 Take profit 1: 85.50 Take profit 2: 88.00 Take profit 3: 92.00 Stop loss: 71.00 Note: This is a reference plan based on the chart provided. Wait for the price to pull back to the entry zone and for a bullish confirmation signal to appear before entering.
post-image
SOXS+1.46%
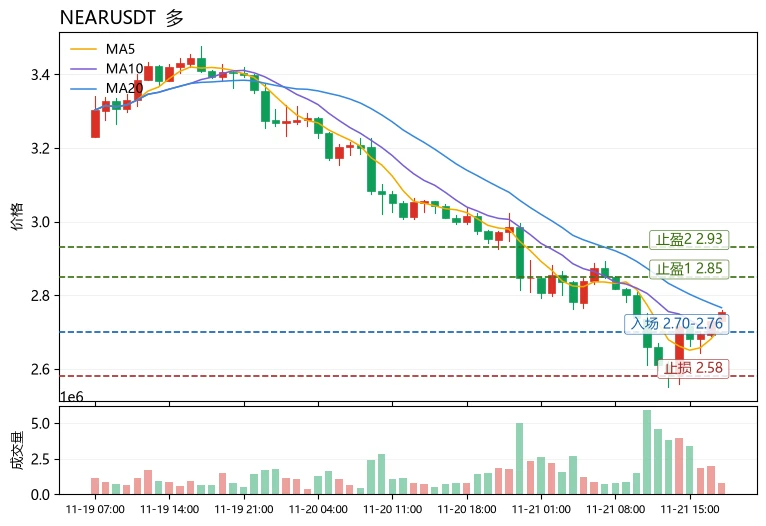
The Fear and Greed Index has plunged into extreme fear territory at 12, yet the $NEAR funding rate remains at +0.0062%—the price fell 9.01% in 24 hours, but longs are still paying to hold positions. This is the most unusual detail in today's market. Shorts aren't forcing a squeeze, and longs haven't given up; both sides are locked in a standoff around 2.75. The 18.61% range across 30 candlesticks indicates frequent wicks, making it easy for chase orders to get stopped out in either direction.
Technically, MA5=2.7154 remains below MA20=2.76635, so medium-term moving average resistance remains
post-image
NEAR+1.17%
PEPE+0.97%
HYPE+0.24%
$BTC wicked down to $55,100 while we slept. What the heck happened?
$11.3B in realized losses on BTC in 7 days.
$2.9B of that in a single day yesterday.
Even long term holders folded, their biggest realized loss of this whole bear market. Fear & Greed sitting at 12.
This is what capitulation looks like.
post-image
BTC-0.67%
  • 2
afternoon updates
live-cover
LIVE2,176
SOL-0.77%
BTC-0.67%
ETH-1.26%
USDC+0.01%
XRP-1.15%
Load More

Join 40 M users in our growing community

⚡️ Join 40 M users in the crypto craze discussion

💬 Engage with your favorite top creators

👍 See what interests you

Trending Topics

BTCBreaksBelow60K

2.1M Views29.4K Discussing

BTC fell below $60,000 on November 20 for the first time since July, alongside a tech stock selloff and broader pressure on risk assets. Will $60K become resistance, or can BTC quickly reclaim it? What price or volume signals would convince you that selling pressure is easing?

GateDirectIPOPhase3ANTAllocates92100Shares

754.6K Views4.8K Discussing

NvidiaDropsNearly14Percent

316.8K Views7.5K Discussing
View More