






Square
Following
Hot
News
Notifications
Profile
Share your thoughts
placeholder
Article
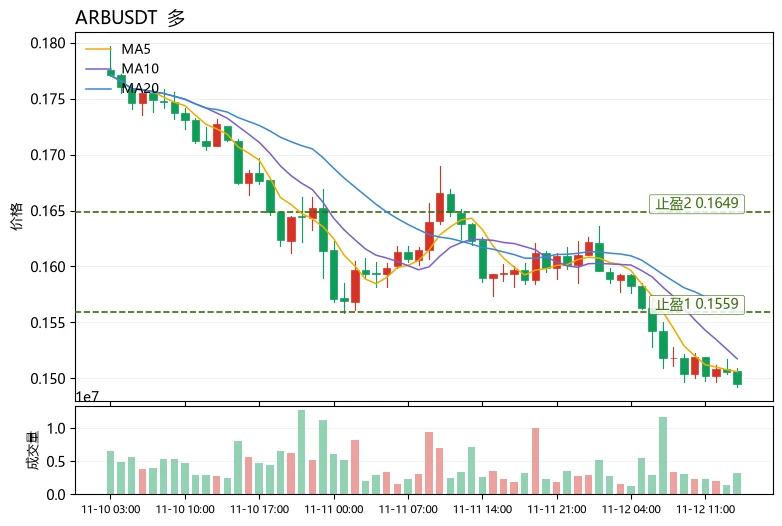
$ARB Current price: 0.1495. The first overhead resistance is the rebound level at 0.1559 (MA20) after losing the lower Bollinger Band at 0.1470; short-term support below is 0.1470, with an extreme wick potentially reaching around 0.1430. Technically, MA5=0.1506 has crossed below MA20=0.15594, the MACD histogram at -0.0004638 remains bearish, RSI=29.0 is approaching oversold territory, and price is trading along the lower Bollinger Band at 0.146971—a weak structure that is prone to a rebound.
Funding is the key factor this time: the funding rate is -0.0204%, with shorts continuously paying lon
post-image
MSTRB
MSTRBMSTRB
Four.meme
MC:$3.29KHolders:4
0.07%
ARB+1.17%
AAVE-1.22%
#Analysis

#SUI Price below moving averages, trading quieter than usual

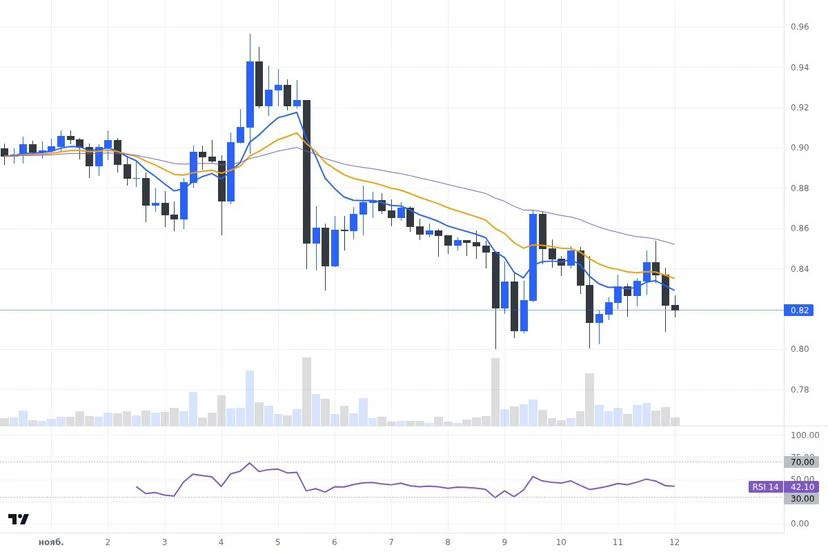
The current outlook for SUI is negative: the price of $0.8195 is below the EMA 20 ($0.83505) and EMA 50 ($0.85285) on the four-hour chart. The short-term average is also below the long-term average, while the RSI 14 on the same chart is 36.6. This combination points to price weakness, not readiness for a reversal.

At the same time, the volume of the latest closed four-hour candle is below the average volume of the previous twenty candles. This is an important detail: the weak price position is not accompanied by increase
post-image
SUI-1.05%
  • 1
Trenches
Max
M
bade
b
Max
5qaP...pump
Market Cap
$.
Change
.
24h Vol
$.
Holders
.
mihao
m
bade
b
mihao
4Cxj...pump
Market Cap
$.
Change
.
24h Vol
$.
Holders
.
AGT
A
bade
b
AGT
0x5d...e274
Market Cap
$.
Change
.
24h Vol
$.
Holders
.
DacityCoin
D
bade
b
DacityCoin
DKYc...pump
Market Cap
$.
Change
.
24h Vol
$.
Holders
.
IDOL
I
bade
b
IDOL
0x3b...ab07
Market Cap
$.
Change
.
24h Vol
$.
Holders
.
$B2 $B2 — SHORTentry: 0.4524tp1: 0.4430tp2: 0.4310stop: 0.4750The broader intraday structure remains under pressure after a substantial decline. The latest bounce has not yet established a convincing reversal.
post-image
B2-2.19%
How to Read the Balance of Long and Short Forces in BTC Trading?

In BTC trading, many people believe bulls are in control when prices rise, and that bears have taken over the market when prices fall. But the real battle between bulls and bears is not as simple as looking at whether a candlestick is red or green. It requires observing the relationship between price, trading volume, and market structure.

So how can you tell which side is currently in control?

First, observe price structure. If BTC continues to form higher highs and higher lows, it shows that buyers are steadily pushing prices
post-image
BTC-0.67%
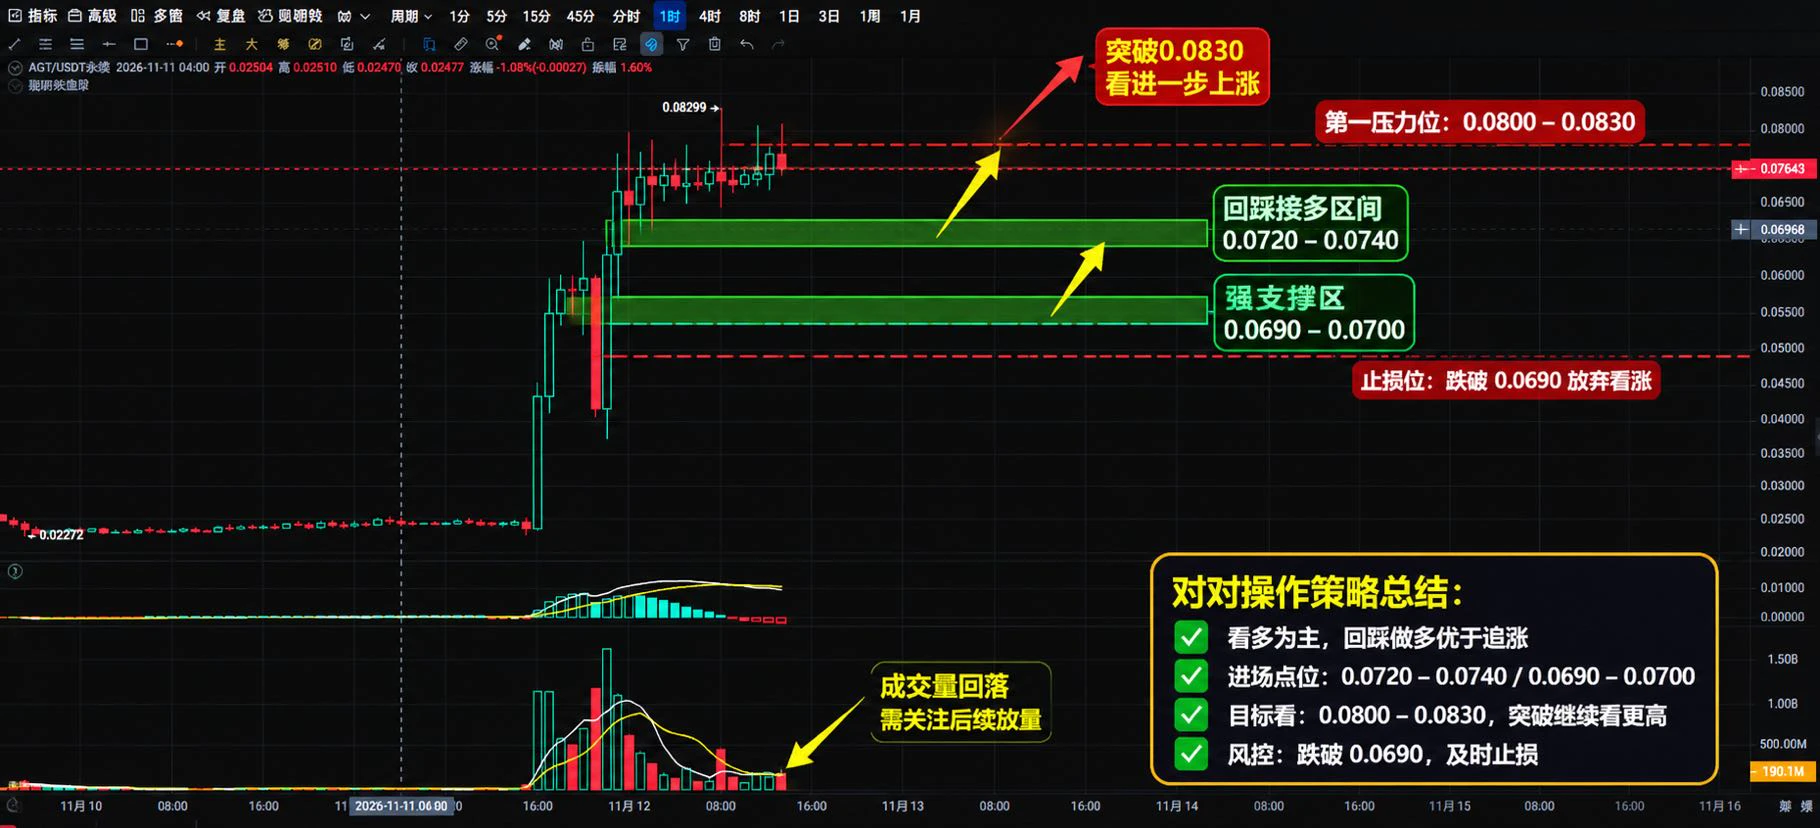
$AGT This rally isn’t over! After a strong surge, the real opportunity may come on the pullback!
AGT suddenly took off on heavy volume from around 0.024, reaching a high of 0.08299 in a powerful rally. The price is now consolidating near 0.076.

The chart shows that the earlier high-volume breakout has shifted the short-term trend. Although volume has eased, the price has not yet suffered a clear breakdown, and the bullish structure remains dominant.

The current bias is bullish. The strategy is not to chase the price higher, but to wait for a pullback and go long!

Recommended entry zone: 0.
post-image
AGT-26.77%
The model remembers preferences, but can’t remember not to rewrite
A fictional editing scene: someone just wants typos fixed, but the model rewrites the entire piece.
【The note says to fix typos only】
They send over the draft with a note: fix typos only. The returned version is smoother and more complete, and the typos have been replaced with a different batch.
【The next sentence says not to improvise】
They add: stick to the original, don’t improvise. It agrees right away, then puts that sentence at the beginning of the new draft.
post-image
🤝 Elon Musk: “It would be an honor” to hire Jensen Huang! 🚀
💬 Musk made the remark on X after a user urged him to hire the NVIDIA CEO, amid reports that NVIDIA’s board is reviewing Huang’s future at the company.
🔥 A surprising show of support from Musk as controversy surrounds one of the biggest names in AI! 🤖
NVDA+2.99%
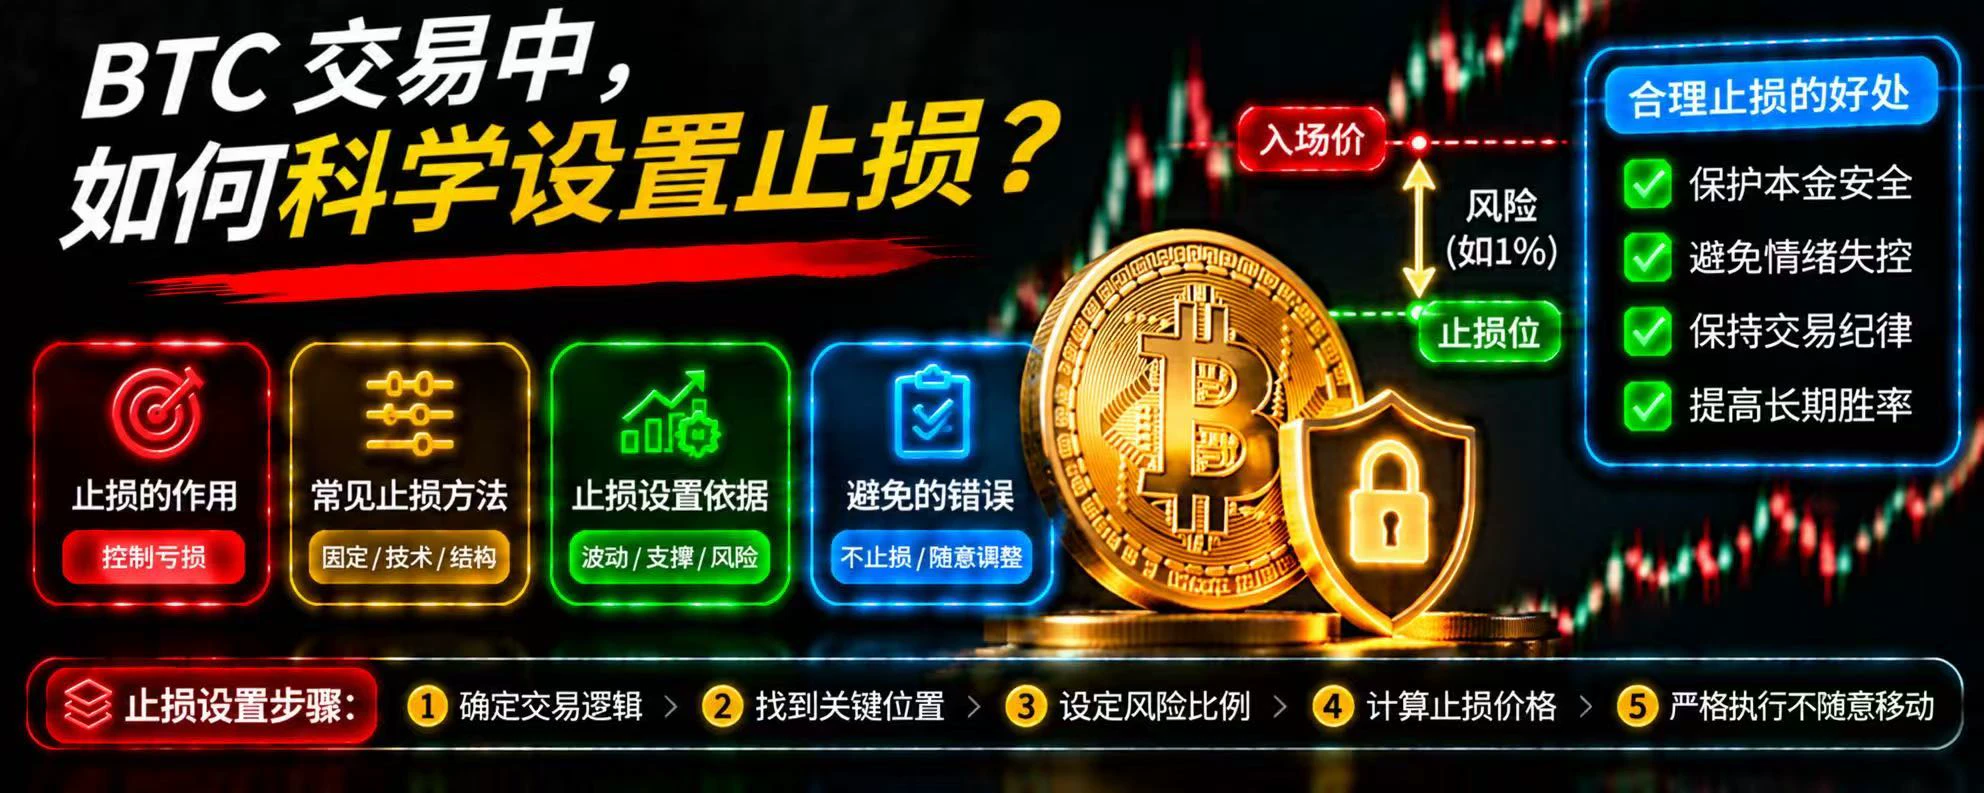
How Should You Set Stop-Losses Scientifically When Trading BTC?

In BTC trading, many people know the importance of stop-losses, but never know where to place them. Set one too close, and a slight price fluctuation can stop you out; set one too far away, and if your judgment is wrong, you could suffer a significant loss.

So how should you set a stop-loss?

First, determine the stop-loss level based on your trading logic. When going long, pay attention to key support levels, previous lows, and price structure. If the price breaks below these levels decisively, the original bullish thesis may n
post-image
BTC-0.67%
What Risks Can Blockchain Congestion Bring? Understanding Gas Fees, Transaction Delays, and Fund Management

In the Web3 world, users need to complete transfers, swaps, borrowing, staking, and contract interactions through blockchain transactions.

But a blockchain’s processing capacity is not unlimited. When many users submit transactions at the same time, or certain applications generate concentrated activity, the network may become congested, causing transaction fees to rise and confirmation times to become unstable.

For a regular transfer, this may simply mean waiting longer and paying mo
post-image
ETH-1.26%
Nvidia’s board is reportedly preparing to oust Jensen Huang, according to anonymous sources cited in reports today. The bullish side has decided to close all related options after the market opens.

The November 9 assessment was based on the board’s public expressions of confidence in him and Trump’s statement that he should stay on. At the time, it was believed that the worst national security-related news was already out. But two days later, the situation reversed: The New York Times reported that he had an affair with a direct subordinate, and The Wall Street Journal reported that the board
NVDA+2.99%
$SOL
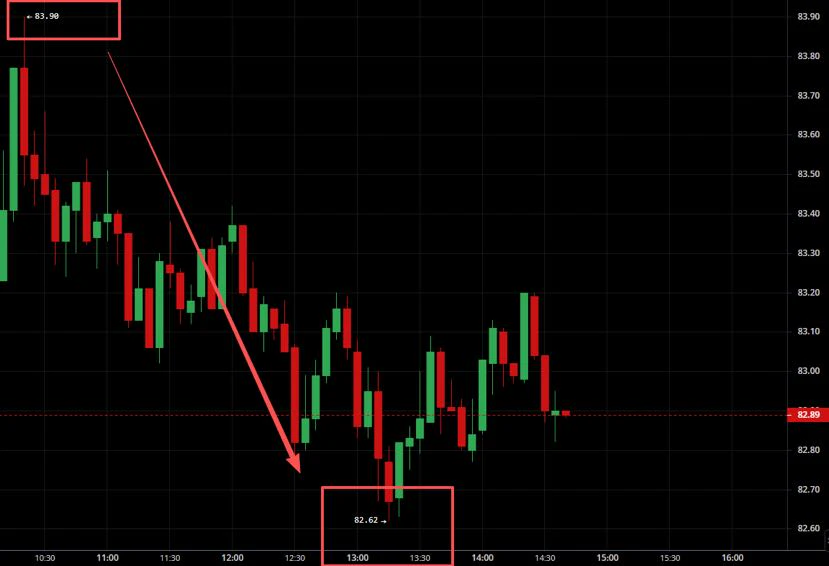
The morning short-selling strategy played out precisely, with the price weakening as expected after hitting resistance
The morning plan clearly called for building short positions in batches at 84.0-85.0. The intraday rebound high of 83.90 approached the resistance zone before the price turned lower as expected, reaching a low of 82.62. The bearish continuation call was fully validated, and those who followed the setup successfully booked profits on their short positions.
The price is currently in a weak recovery phase after the decline. The 1-hour downtrend structure remains intact, and
post-image
Top-OutMemo
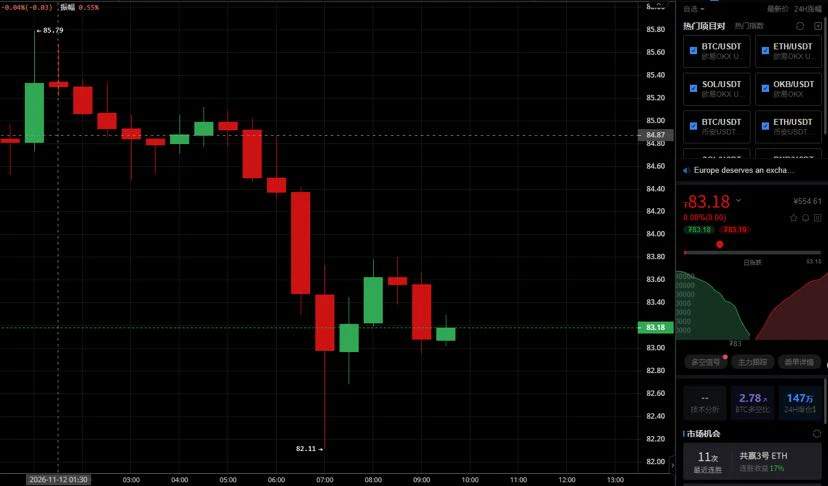
11.12 $SOL Intraday Outlook
The downtrend continues. The rebound met resistance at 85.79 and pulled back. Focus on shorting rallies, with short-term longs at support as a secondary strategy. Widen entry ranges to improve tolerance for price fluctuations and filter out intraday noise.
#美国10月CPI全面超预期
Support: 81.5-82.5 (first support), 79.5-81.0 (strong support zone)
Resistance: 84.0-85.0 (first resistance), 85.5-87.0 (strong resistance zone)
Shorts: Enter in batches on a rebound to 84.0-85.0; add to the position at 85.5-87.0; stop-loss at 87.5; first target at 82.0; if support breaks, look to 80.0-79.5
Short-term longs: If the price stabilizes after retesting 81.5-82.5, try a small long position; add to the position at 79.5-81.0; stop-loss at 79.0; target at 83.5-84.5; move quickly in and out
repost-content-media
SOL-0.77%
  • 1
[Trending Topic] Jensen Huaung Could Face Removal
live-cover
LIVE1,659
The morning bearish outlook played out, with the market hitting a low of 3968 and delivering a 32-point move—gains safely banked!
$BTC $XAU #美国就业数据今晚公布 #美国10月PPI即将出炉 #Gate全球合规版图扩展 #OpenAI第三季度营收升至100亿美元
BTC-0.65%
XAU+0.38%
Friends, we have another crucial piece of US economic data dropping tonight: the weekly initial jobless claims. The market expects 194k, slightly up from the previous 189k.

Here is the real catch right now. The market is caught in a fascinating contradiction where good news for the economy often feels like bad news for asset prices.

If the claims come in below expectations tonight—meaning fewer people filed for unemployment than anticipated—it signals a highly resilient labor market. While that’s great for the real economy, it creates a headache for the Federal Reserve. Given that recent CPI
BTC-0.67%
  • 6
  • 1
$ZEC $ZEC – Bearish pressure persists! Is $900 the next stop? Traders, take note!$ZEC After a sharp drop, it is currently trading around $979, with sellers still in control. If $ZEC fails to reclaim $1,000, the price could fall further to $950–$900. A break above $1,025 could signal a potential recovery. What do you think? Will ZEC rebound or fall below $900?
post-image
ZEC+1.16%
🔹Who Will Be Nvidias Next CEO? With Jensen Huangs Future Uncertain, Who Could Take Over the Trillio
live-cover
LIVE1,889
In BTC trading, why is patience more important than prediction?

In BTC trading, many people study the market every day, trying to predict whether the next candlestick will rise or fall. Some constantly switch between technical indicators, some watch every price fluctuation, and others worry about missing any trading opportunity.

But one easily overlooked issue is this: even if you can correctly judge the market’s general direction, that doesn’t mean every entry will be profitable.

Why is patience so important?

First, the market doesn’t offer trading opportunities at every moment. BTC often
post-image
BTC-0.67%
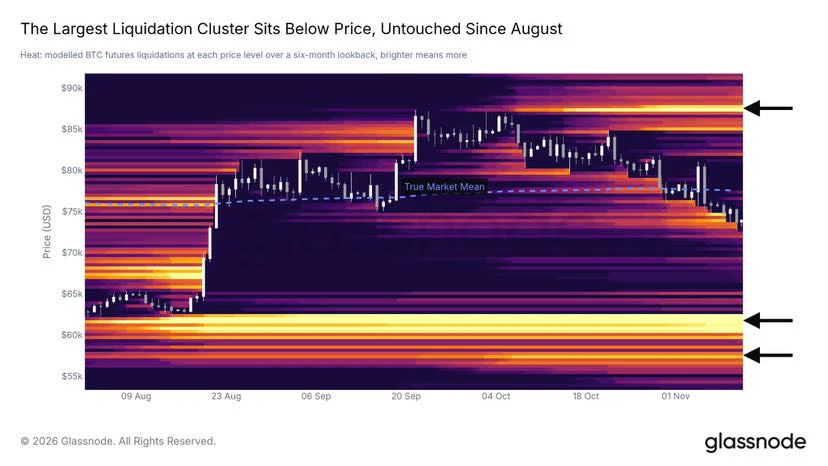
Bitcoin’s largest liquidation cluster is located around $60,000.

These are long positions opened near the bottom, and since prices surged in August, the market has yet to test their entry points.

Patient buyers often find opportunities in forced selling, and a sweep down to $60,000 would create plenty of them.
post-image
BTC-0.65%
Load More

Join 40 M users in our growing community

⚡️ Join 40 M users in the crypto craze discussion

💬 Engage with your favorite top creators

👍 See what interests you

Trending Topics

GateIPOAccessAnthropic

249.8K Views2.3K Discussing

Gate IPO Access Phase 3 features Anthropic (ANT), with USDT subscription interest starting from 100 USDT. Successful allocations will be delivered as real shares to Gate Stock Accounts. Indicative price: $70–$78/share Subscription: Nov 12–17 (UTC+8) Allocation is not guaranteed. Please manage risk accordingly.

USJoblessClaimsTonight

166.6K Views32.8K Discussing

GateOctoberTransparencyReport

238.5K Views1.8K Discussing

View More