



Square
Following
Hot
News
Notifications
Profile
Share your thoughts
placeholder
Article
My key takeaway is that the US federal government has a debt at 452 percent of GDP. Translation: defaults are coming.
post-image
Trenches
Libra
L
bade
b
Libra
0xd2...4444
Market Cap
$.
Change
.
24h Vol
$.
Holders
.
牛逼
牛
bade
b
牛逼
0x96...7777
Market Cap
$.
Change
.
24h Vol
$.
Holders
.
ZIG
Z
bade
b
ZIG
0x8c...1145
Market Cap
$.
Change
.
24h Vol
$.
Holders
.
BTC
B
bade
b
BTC
C5xp...pump
Market Cap
$.
Change
.
24h Vol
$.
Holders
.
STONK
S
bade
b
STONK
6GmA...UNgx
Market Cap
$
Change
.
24h Vol
$.
Holders
.
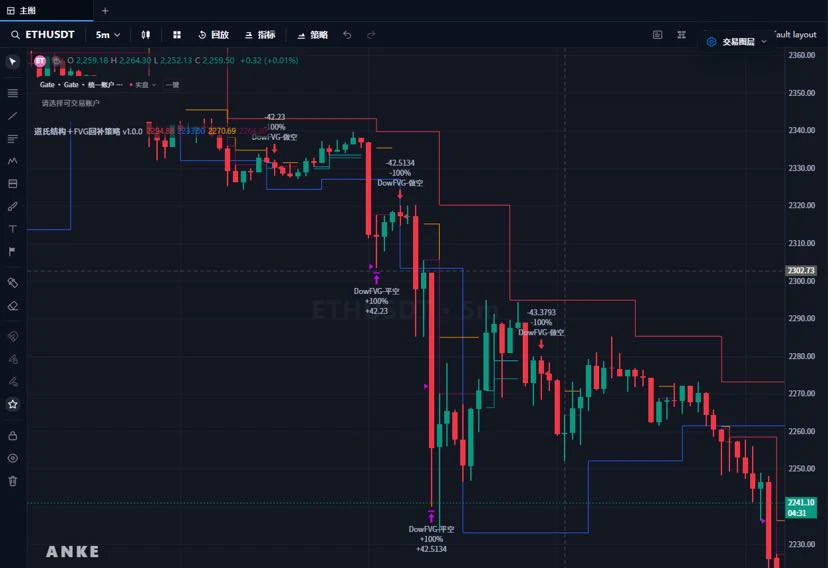
📊 The charting experience is also an important part of trading tools.

Chart clarity, intuitive indicators, and easy-to-view strategy signals all affect how efficiently traders can analyze the market.

ANKE AI has developed its own charting platform, combining indicator displays, strategy analysis, and trading assistance to create an experience tailored to real trading scenarios.

Charts are more than just a way to view prices—they’re also tools for exploring trading logic.
post-image
The former head, who spent 40 years working in the border system, called it “completely broken.” The weight of those words lies not in the criticism, but in who said them. When someone who once oversaw the border speaks out against the system, it shows the problem is no longer a policy disagreement—the situation has become unmanageable at the implementation level. The impact on markets is indirect, but the direction is clear: immigration and border issues will continue to dominate UK political headlines, and expectations for public finances and labor supply will have to adjust accordingly.
post-image
Layout: Bitcoin, Ethereum, Dogecoin
live-cover
LIVE1,645
  • 1
Exchanges just forced shut $7.9M of leveraged $ETH bets on a rise in 30 minutes. Bets on a fall saw only $101.6K closed, a one sided flush that hit buyers using borrowed money.
ETH-1.23%
After the breakdown, the bearish structure was confirmed. The rebound was merely a correction during the decline, not a reversal. Once the rebound met resistance, selling pressure continued to build, and the market extended its decline, validating the trend-based outlook.
post-image
XiaoXinBit
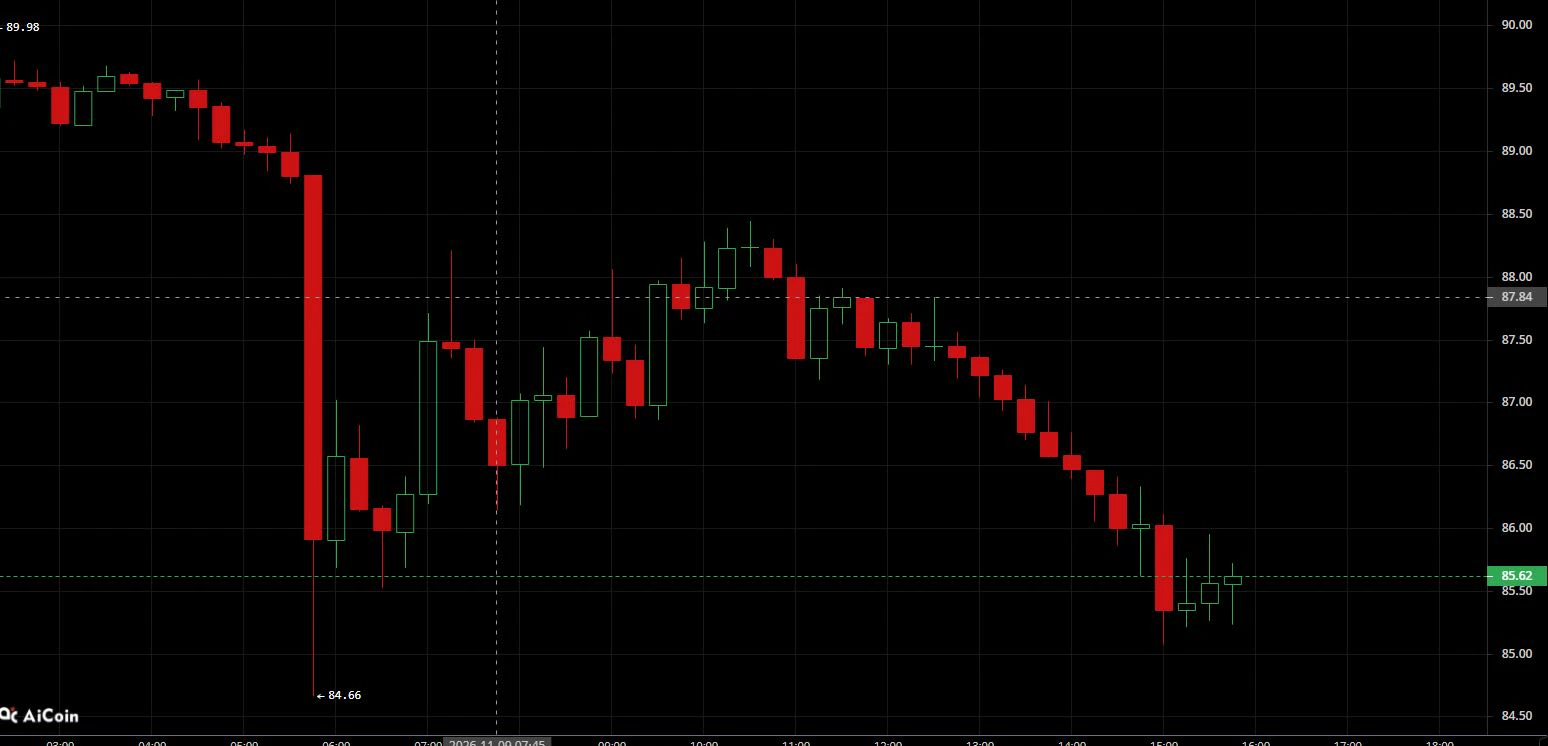
Xiaoxin | 11.9 Solana Strategy$SOL

Entry: Short near 87.6–87.8, with a stop-loss above 88.3. Watch for stabilization around 86.4–84.6 to try a long.

Trend breakdown: The previous high was 90.11. After consolidating near the highs, the market saw a sharp, high-volume drop and set a new low of 84.66. The previous trading range broke to the downside, shifting the short-term trend to bearish control. The current rebound from the low is an oversold recovery after a sharp drop, not a trend reversal.
Selling pressure at resistance: 87.60–87.80 is where the rebound from this decline is meeting resistance. Trapped positions accumulated in this area during the drop, so a rebound into this range could trigger selling pressure and cap gains.
Key level separating strength from weakness: 88.30 is the bears’ defense line. Only a high-volume move that holds above 88.30 would break the downtrend structure. Until then, all rebounds are considered countertrend bounces and opportunities to short at higher levels with the trend.
#70%山寨币跌破200日均线
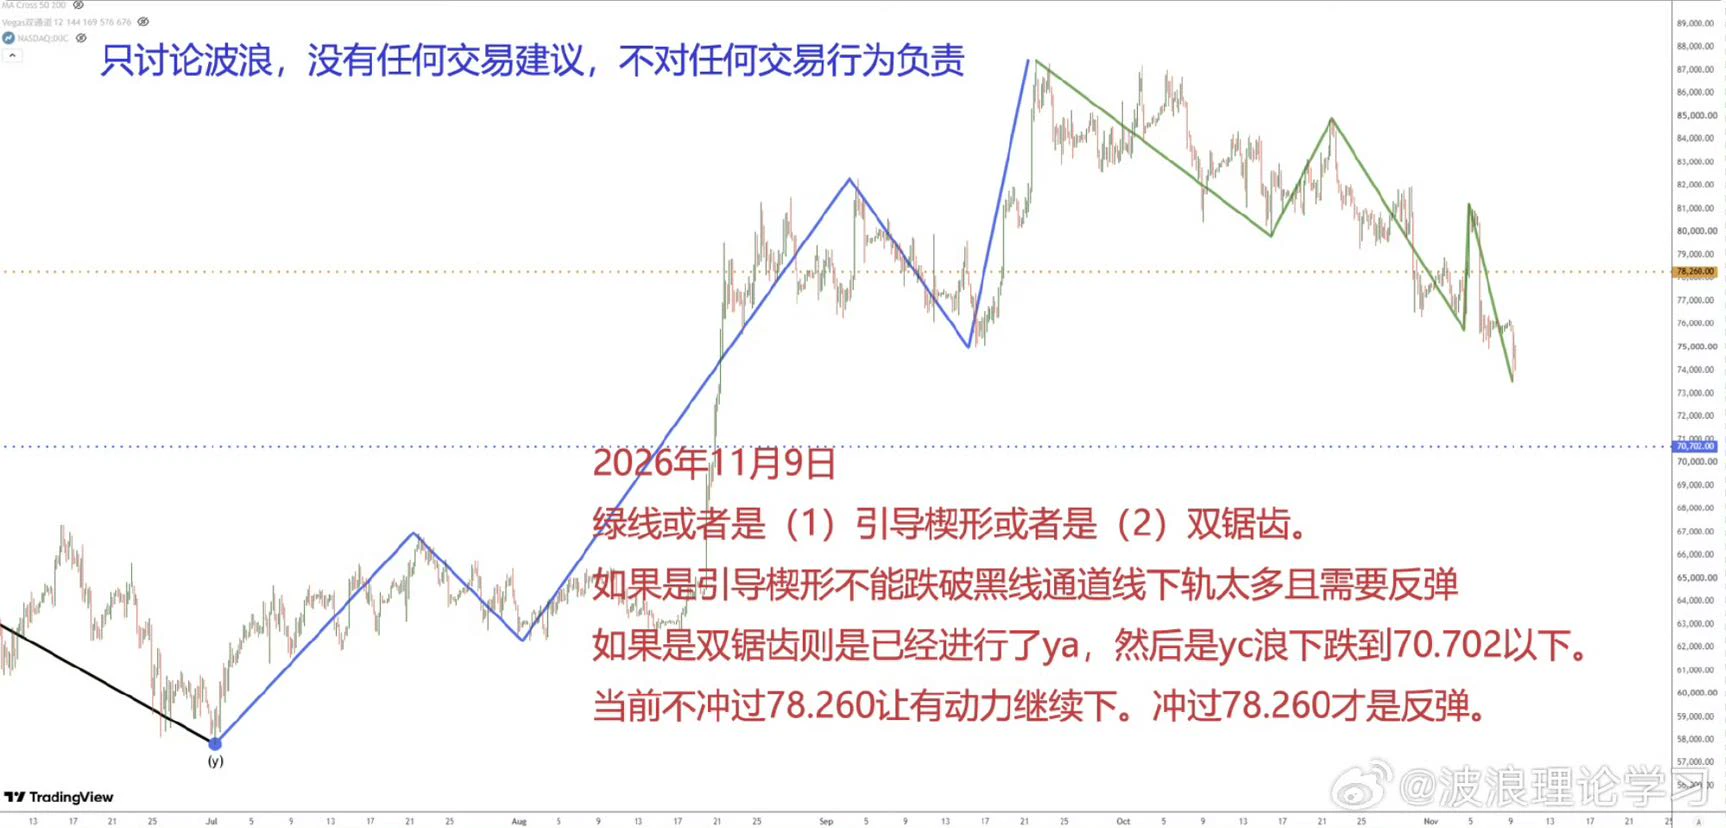
#Bitcoin just lost a key level on the weekly chart.
For the first time in two months, $BTC closed below its 50-week moving average.
Now, the next weekly candle could determine the direction of the market.
Here’s what I’m watching:
Bullish scenario: A quick reclaim of the 50-week MA would signal a potential bear trap, suggesting the breakdown was designed to shake out weak hands.
Bearish scenario: Another weekly close below this level would increase downside risk, with the low $60K region becoming a key area to watch.
This is a critical moment for Bitcoin.
Fakeout or the start of a deeper corre
post-image
BTC-0.67%
Bitcoin Flash Pullback: Healthy Shakeout or Bearish Shift?
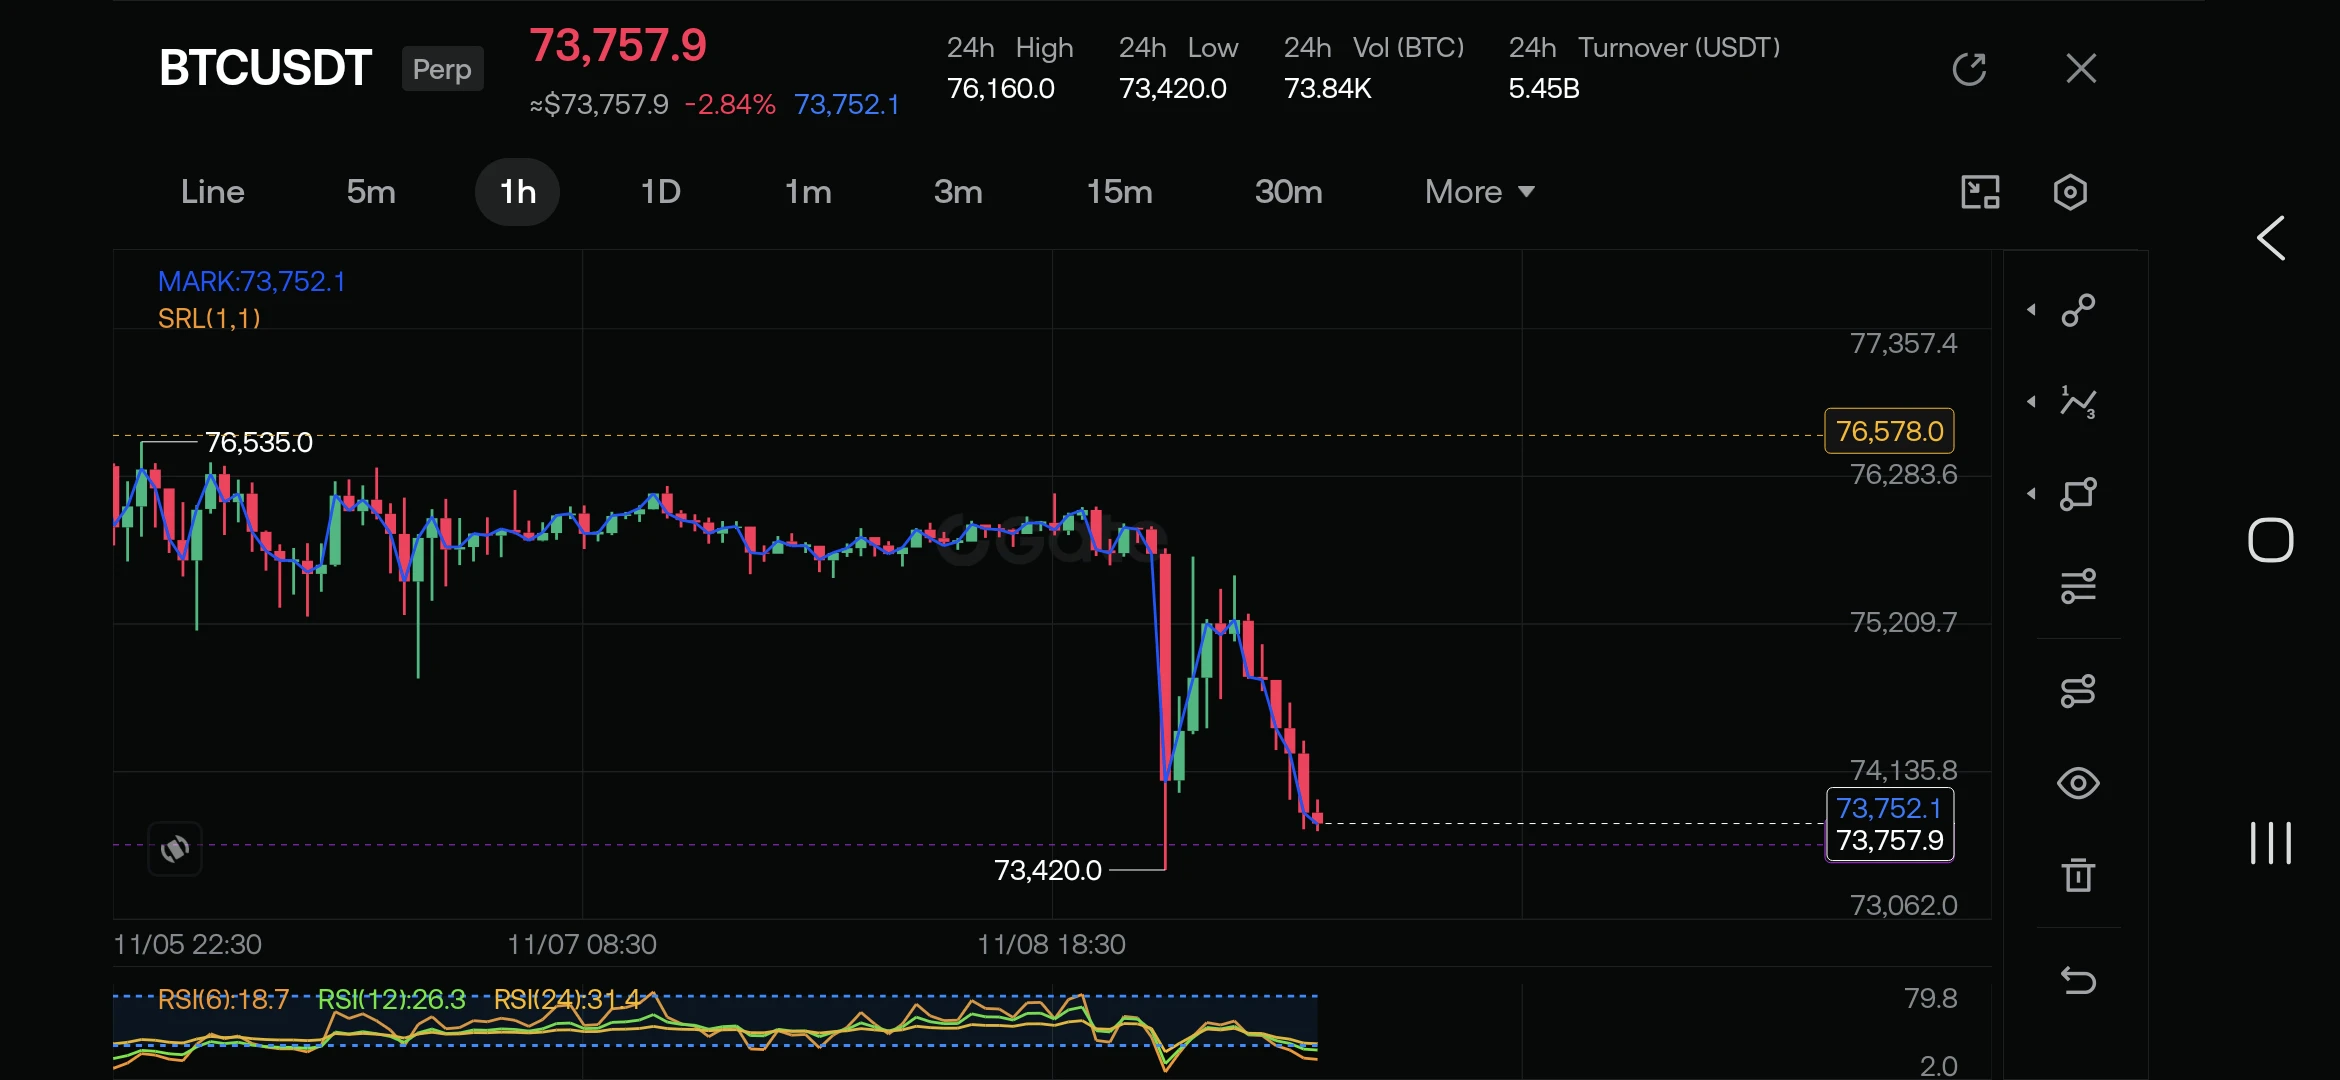
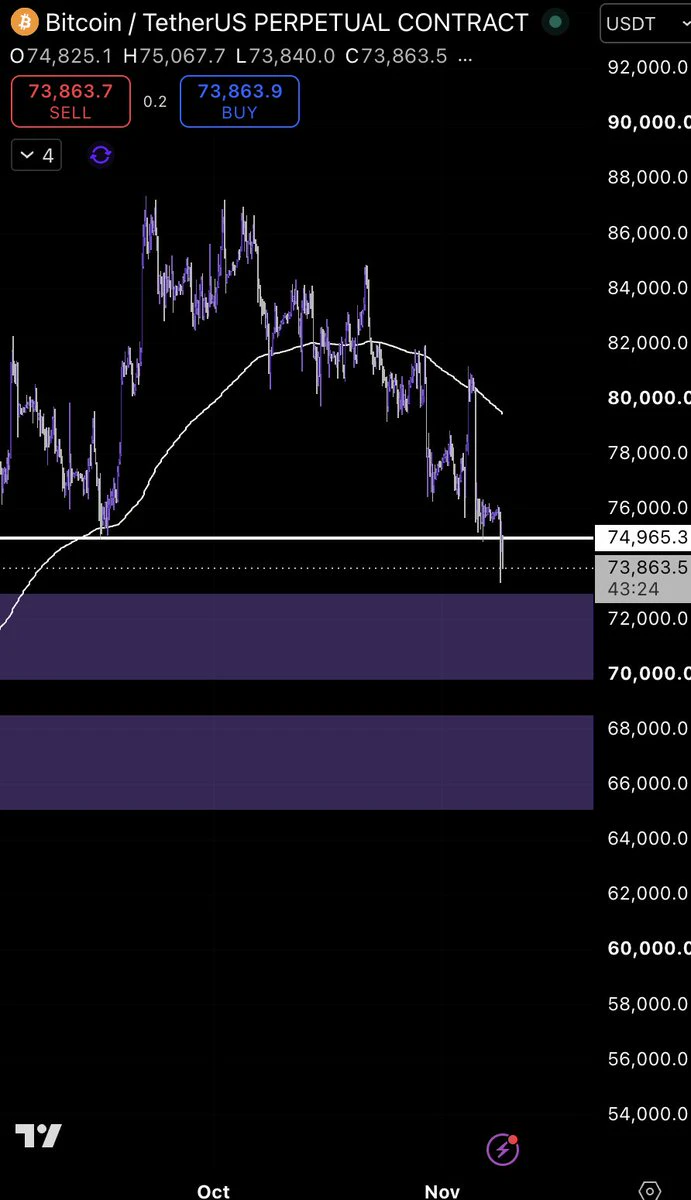
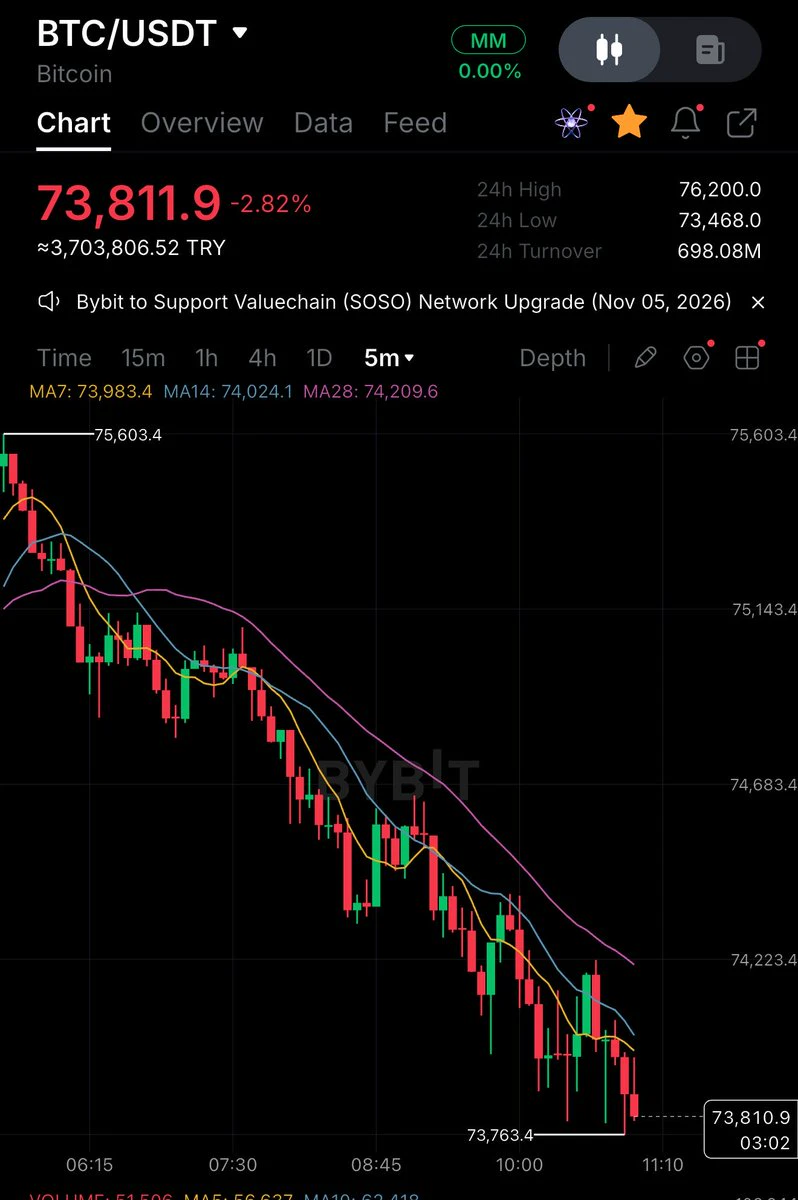
​Bitcoin (BTCUSDT Perp) is feeling heavy selling pressure, tumbling from recent highs around $76,160 down to retest critical support near the 24-hour low of $73,420, currently hovering around $73,757. After days of tight consolidation above $76,000, the breakdown caught aggressive late longs off guard, triggering an abrupt cascade of liquidations across derivatives markets.
​Looking at the 1-hour chart structure, consecutive long red candles broke straight through intermediate demand zones. However, the momentum indicators reveal key u
post-image
BTC-0.65%
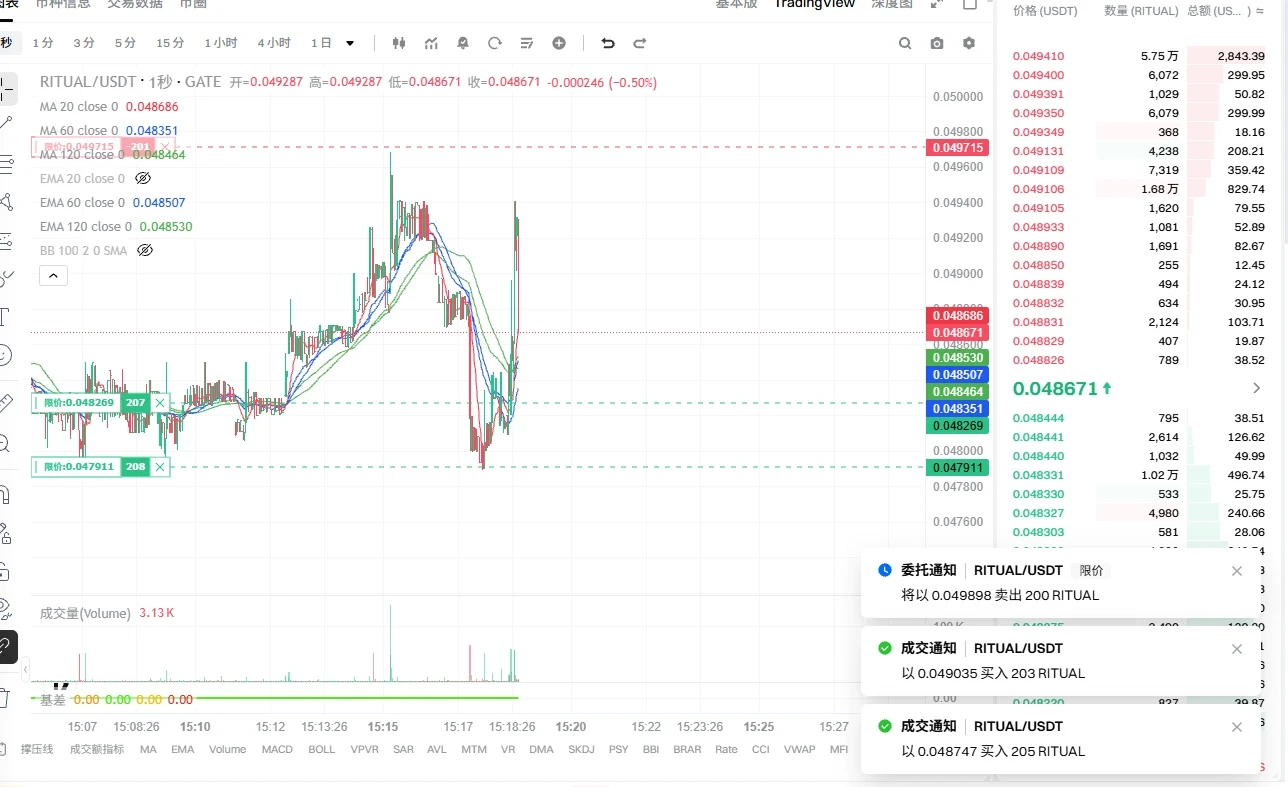
Ritual's volatility has exploded, and the grid trading success alerts keep going off—it's raking it in like crazy.
Welcome to the livestream to chat~$BTC $ETH $SOL
post-image
BTC-0.67%
ETH-1.26%
SOL-0.77%
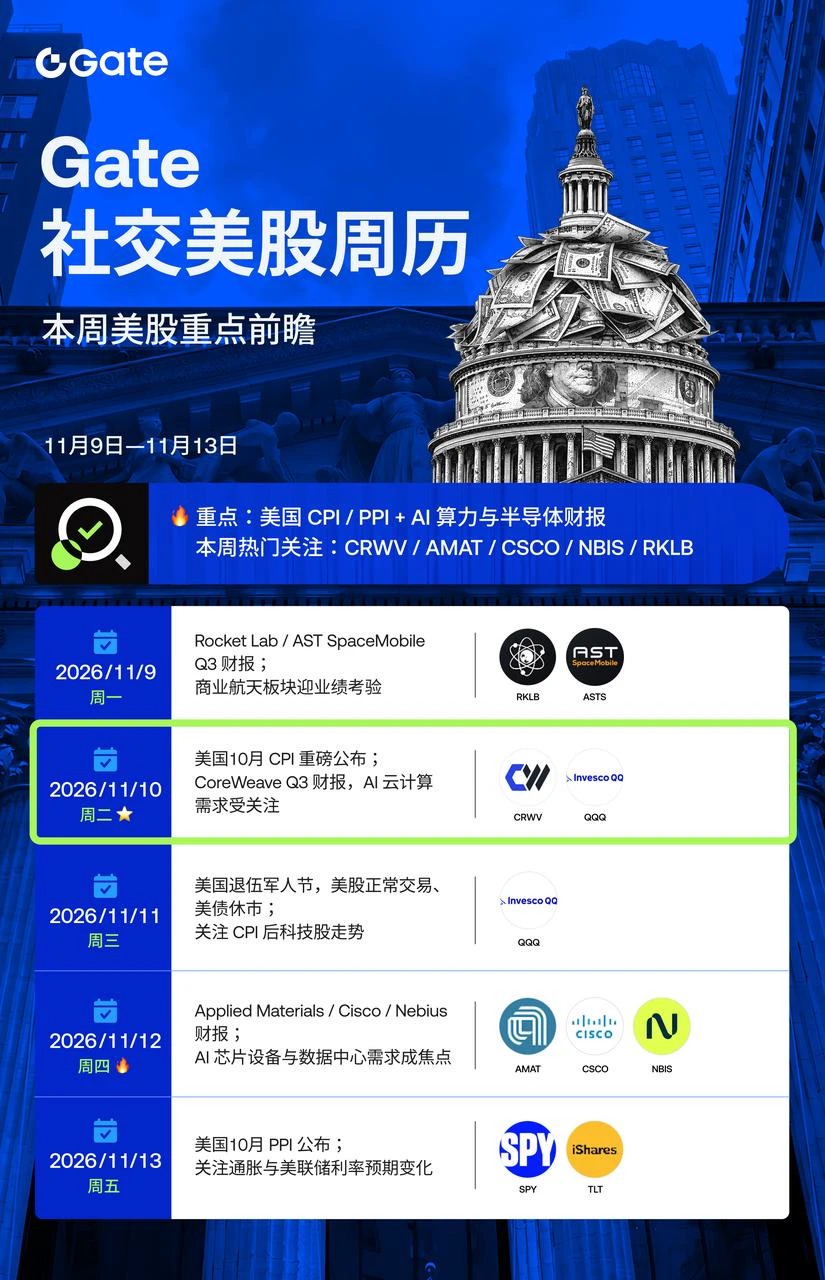
📈 U.S. stocks this week: Little G’s front row is about to fill up again 👀
U.S. CPI / PPI + AI computing power and semiconductor earnings
Could inflation data shift rate-cut expectations?
Will results from CoreWeave, Applied Materials, and Nebius be enough to sustain the AI hype?
🍿 Which big story are you most looking forward to this week: inflation data or AI earnings?
Name your pick in the comments, and Little G will bring your questions to the livestream host 🔴
Save the weekly calendar, and see you in the livestream.
https://www.gate.com/live
‍#GateLive #美股 #CPI #AI
post-image
  • 5
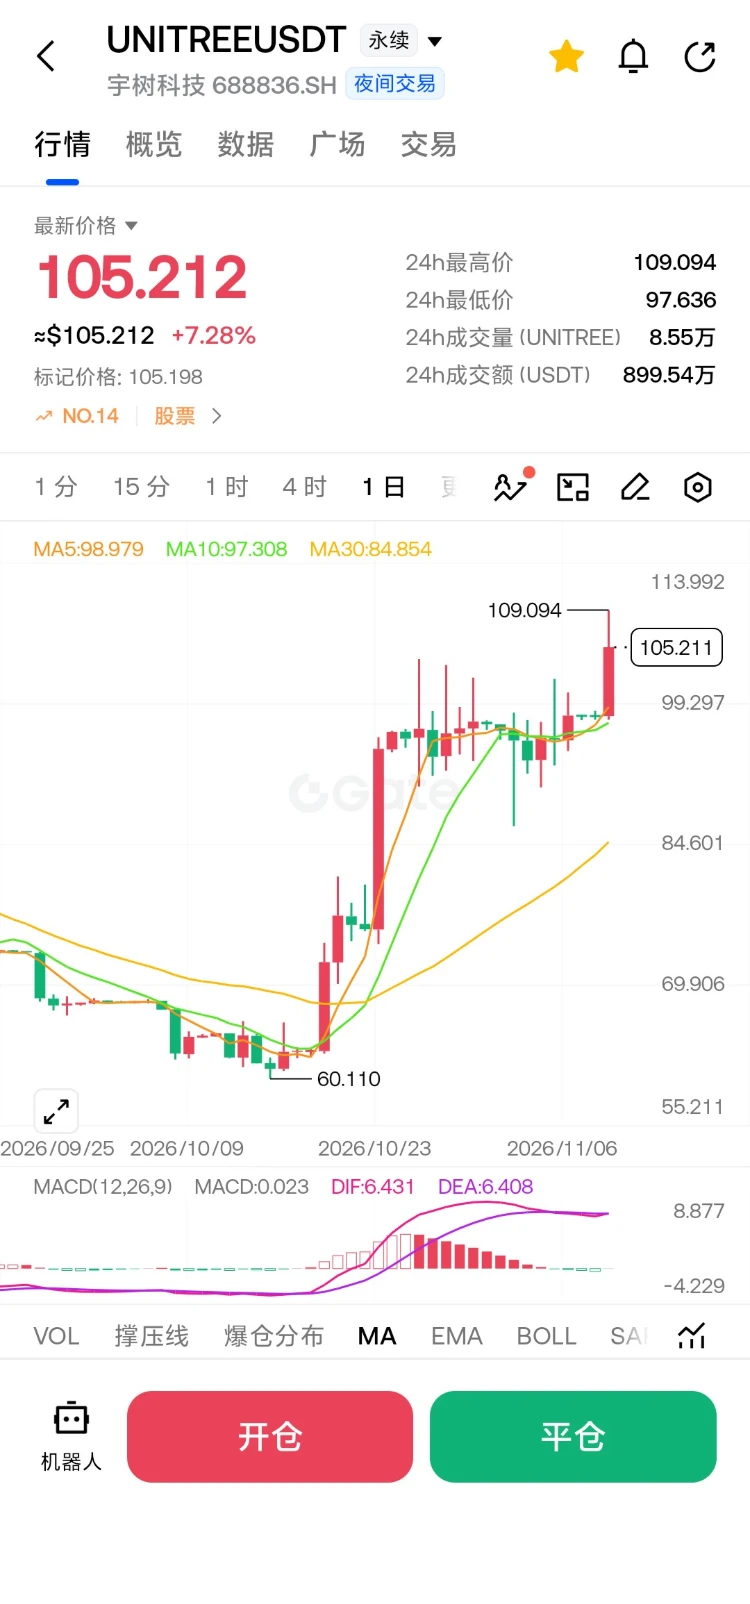
Unitree is really strong, follows the rises but not the drops, so short again around 115, with a stop-loss at 118. Logged ✍️
post-image
How many days has it been since I last posted an update to talk big? Let me talk big again today: a brand-new strategic dividend-sharing partnership model. Let’s have fun making money together, guys
Today's ETH outlook🎊$ETH
The rebound amid profit-taking was merely a corrective move after the sharp drop, not a reversal, and the overall bearish structure remains intact. Selling pressure continued to emerge after the rebound, pushing prices lower again and confirming the previous trend assessment.
#美股AI板块遭遇重挫
ETH-1.26%
$GT ‌
Looking at the 1-hour chart for GT/USDT, the price is currently trading at 9.84, showing a +1.44% increase. We are observing a strong bullish recovery after a period of consolidation near the 9.52 support level. The price has just broken above the middle Bollinger Band (MB: 9.74) and is approaching the upper band (UB: 9.91). The volume bars are expanding, indicated by the green volume spike, and the MACD is converging towards a bullish crossover, suggesting that buying momentum is returning to the market.

The most recent candle is a strong, full-bodied green candle that has engulfed th
GT-2.41%
  • 3
$BTC is moving as expected. 📉
On the HTF, I'm watching the $70K area for a potential relief bounce — possibly a retest before another leg lower.
Don't confuse a bounce with a trend reversal.
⚠️ Be careful with your longs this month. Manage risk, avoid chasing green candles, and stay prepared for more downside. 🔻
post-image
BTC-0.67%
The index is an individual U.S. stock, beyond its control. But it is a relatively hardline stock. ​​​$BTC ‌
post-image
BTC-0.65%
This B market is really tough to trade
We need to watch out for US stocks and the news cycle; now we also have to watch out for the CEO affair scandal 😅
post-image
Load More

Join 40 M users in our growing community

⚡️ Join 40 M users in the crypto craze discussion

💬 Engage with your favorite top creators

👍 See what interests you

Trending Topics

USCPIDataIncoming

30.01k Views1.86k Discussing

The U.S. October CPI report will be released on November 10 at 8:30 a.m. ET. September CPI came in at 3.7% year over year, and markets will be watching closely for signs that inflation is cooling, especially in core CPI. A softer-than-expected reading could strengthen rate-cut expectations, while hotter inflation may pressure risk assets through higher Treasury yields and a stronger dollar. How do you think this CPI print will move $BTC, U.S. stocks and gold?

RedBullDoublePodiumInBrazil

2.28k Views30.52k Discussing

BTCFlashCrash

86.66k Views66.25k Discussing

View More