Square
Following
Hot
News
Notifications
Profile
Share your thoughts
placeholder
Article
$EPIC just remember boldly...this coin has ever reached 74.80200 once on March 1st,2021...and this coin average is supposed to be above 1 USDT and then the Total Coin Supply is only 33.60 Millions coin...so what you afraid of,...???just make it back to where this coin belong,above 1 USDT...pump it all the way to this coin is where its belong and put it back decently,which is above 1 USDT (you can check by yourself on the1M Chart,at the beginning of this coin launched/traded,the ATH was 74.80200 USDT and averaging above 1 USDT)...this coin is RWA...so please no more childish dramas,be gentle an
post-image
#ARIA

Writing

ARIA Climbs 7.8%: A Strong Market Move, but the Real Story Is What Happens Next

The Move That Caught Attention

ARIA has recorded a positive 24-hour move, reaching 0.16023 USDT with a price increase of 7.8%. The move comes alongside approximately 3.45 million USDT in 24-hour trading volume. These figures show meaningful market activity, but there is an important question behind the rise: is this the beginning of stronger demand, or simply a short-term wave of buying?

Market data recorded on November 8, 2026, at 01:30 UTC, provides a useful starting point for understanding wh
post-image
ARIA+22.03%
Trenches
ZIG
Z
bade
b
ZIG
0x8c...1145
Market Cap
$.
Change
.
24h Vol
$.
Holders
.
STONK
S
bade
b
STONK
6GmA...UNgx
Market Cap
$.
Change
.
24h Vol
$.
Holders
.
IDOL
I
bade
b
IDOL
0x3b...ab07
Market Cap
$.
Change
.
24h Vol
$.
Holders
.
BTC
B
bade
b
BTC
C5xp...pump
Market Cap
$.
Change
.
24h Vol
$.
Holders
.
CLAUDIA
C
bade
b
CLAUDIA
2j5S...W2ZM
Market Cap
$.
Change
.
24h Vol
$.
Holders
.
33 lives, and Saudi Arabia says it’s investigating?
A village near Sanaa was hit by airstrikes, leaving at least 33 dead and 39 injured. The Houthi health ministry’s initial report said 27 dead and 36 injured; most of the dead were women and children, and homes were directly bombed
A report published by the Saba news agency at 18:40 on November 7 stated clearly that homes in Al-Shariya village, Bani Hushaysh district, were hit. AP had earlier reported the Houthi side’s initial toll of 27 dead and 36 injured; Reuters later updated it to 33 dead and 39 injured
Then the Saudi International Commun
post-image
$KOMA BOOM🤑🤑 The just-closed daily candle bounced upward from its lower wick—the price action looks beautiful. TP1: achieved. Keep holding, guys, and let the profits run🙈🙈💸💸$0.02 is coming😍$IDOL $AIN
post-image
KOMA-3.91%
IDOL-6.71%
AIN+3.85%
Sunday morning market
live-cover
LIVE2,154
Great, $AIN continues to rebound. I want to follow the momentum and go long again; the uptrend is quite clear😍😍😍$AKE $KOMA 😍😍😍
post-image
AIN+3.85%
AKE+6.07%
KOMA-3.91%
🆕 stream crypt update
live-cover
LIVE1,562
44 Days Without a U.S. Premium! The Bitcoin Market Is Diverging—What Are Institutional Investors Waiting For?

What does the Bitcoin market fear most? Not price volatility, but a lack of sufficiently strong buying support during a rally.
Recently, the premium index has remained negative for 44 consecutive days, indicating that Bitcoin prices on U.S. trading markets have consistently been weaker than on other platforms.
This signal is worth watching because the U.S. market has many institutional investors and professional traders.
A sustained negative premium may mean that buying demand in the
MU+4.71%
  • 21
BTC/USDT: Critical Support Test – Is Bitcoin Preparing for a Reversal or Another Leg Down?

Bitcoin is trading around $75,707, and the 4H structure remains bearish. Price is below MA5 ($75,905), MA10 ($75,893), and MA30 ($77,337), indicating that sellers still have the upper hand.

Key Support Levels:

- $75,400–$75,500
- $74,850–$74,950
- $73,850–$74,000

Key Resistance Levels:

- $75,900–$76,000
- $76,200–$76,400
- $76,850–$77,000
- $77,300–$77,450

Trading Scenarios:

Bearish: Rejection around $75,900–$76,250 could open downside targets at $75,500, $74,950 and $74,000. A confirmed breakdown
BTC-0.67%
Lighter will settle its Anthropic pre-IPO perp on the first Friday after Anthropic lists on Nasdaq, using its share price and fully diluted share count.
Anthropic last raised $65B at a $965B valuation in May.
@Lighter_xyz
LIT-4.42%
ANTHROPIC+0.63%
NDAQ+0.28%
I seem to remember that female strongwomen who could lift several huge logs at once used to be popular too, right?🙈
🌈 #GateLiveStreamingInspiration -November 8

Go live with the following topics now to receive extra official support and promotional exposure!Today's Topic Recommendations:
🔹 Vitalik Buterin says the donation of SHIB worth hundreds of millions of dollars exceeded expectations
🔹 Bitcoin needs no banks, yet Strategy aims to become a Bitcoin bank
🔹 Former FBI agent pleads guilty to stealing $2.47 million in cryptocurrency, facing up to 20 years in prison
🔹 Cyber has repurchased approximately $13 million worth of CYBER tokens over the past year
🔹 Bitcoin ETFs saw a net outflow of $412 millio
post-image
SHIB-1.28%
BTC-0.67%
CYBER-5.40%
GNO-1.28%
BLK+0.60%
  • 4
  • 3
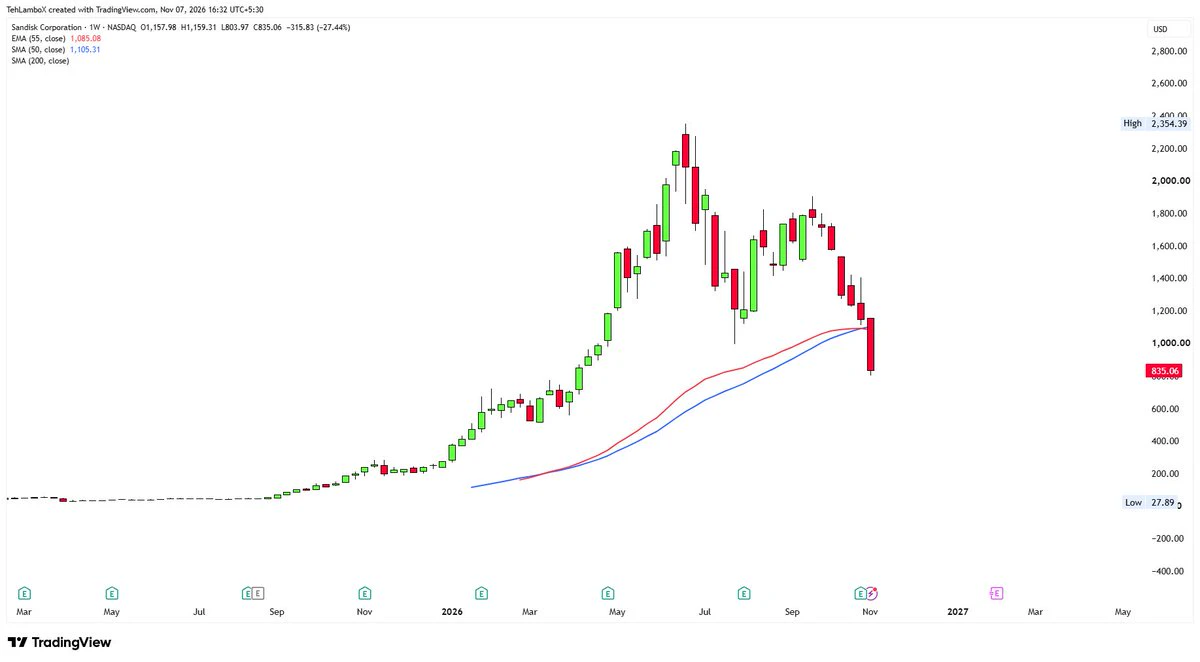
Under the same “extreme” scenario, SNDK’s pullback target really would have to reach 600
Although it was somewhat shocking to see it fall from 1,000 to below 800 in a single day on Thursday, I didn’t expect that this might indeed still not be the final bottom
Big rallies overshoot, and so do big drops. Until trapped holders have been shaken out, this major correction hasn’t completed its task—it’s merely been postponed until next year.
Since 2021, 90% of stocks have fallen from their peaks and never returned,
In 2026, the same thing has continued to happen to AI Bottleneck
It looks like there
post-image
SNDK+3.53%
  • 1
#BTCETFOutflowsContinue

BTC ETF Outflows Continue: Is Institutional Demand for Bitcoin Losing Momentum?

What Is Driving the Latest Withdrawals?

Are investors losing confidence in Bitcoin, or are they simply becoming more cautious after a period of market uncertainty? This is an important question as US spot Bitcoin ETFs continue to record net outflows, raising concerns about institutional demand and the direction of the crypto market.

The latest figures show that selling pressure through Bitcoin investment funds remained significant during the first week of November 2026. However, underst
post-image
BTC-0.67%
  • 3
#AKE

AKE Gains 9.7%: What Is Behind the Move, and What Should Traders Watch?

Imagine You Hold AKE. What Would You Notice?

You open your trading account and see AKE trading higher than it was yesterday. The price has climbed nearly 10%, and trading activity has reached millions of USDT. Your first thought might be that something important has changed. But is this move supported by strong demand, or is it simply a short-term market reaction?

That is the question traders should ask before making a decision.

What Is Happening With AKE?

At 01:30 UTC on November 8, 2026, AKE/USDT was trading
post-image
AKE+6.07%
  • 1
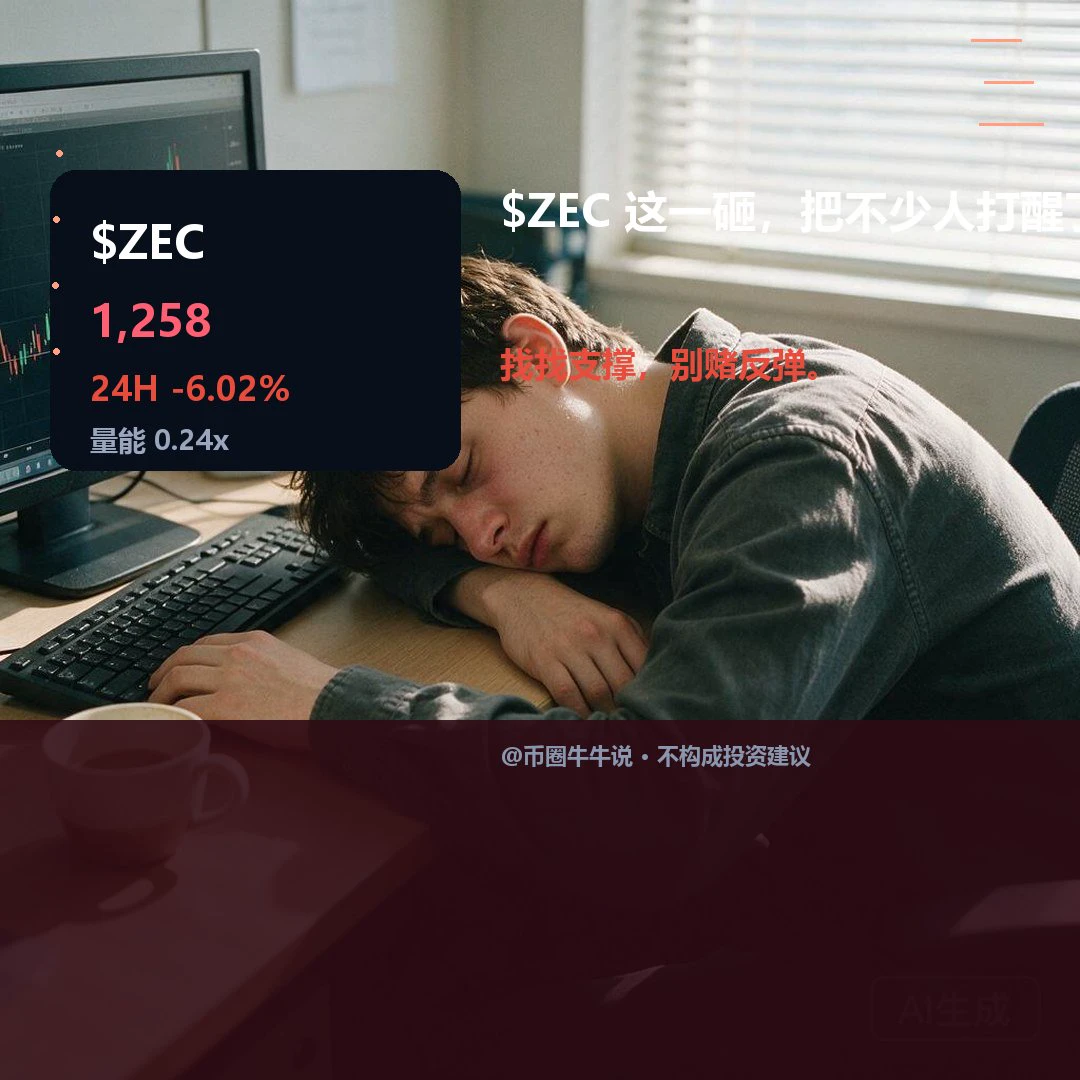
$ZEC Current price: 1258.04, 24H -6.02% (1236.65–1364.08). Weak on the 1H: RSI 31.14, price below EMA20 at 1275.01, volume ratio 0.24; weak on the 4H: RSI 51.85, price below EMA20 at 1281.84, support at 1183.38/resistance at 1387.89. To move higher, price needs to hold above the 1364.08 resistance; a break below the 1236.65 support would signal further weakness. On review, check whether price holds above 1364.08 and recovers after losing 1236.65; volume is only 0.24x. The setup is invalidated if volume is insufficient or price fails to recover. Market volatility is high; for observation only.
post-image
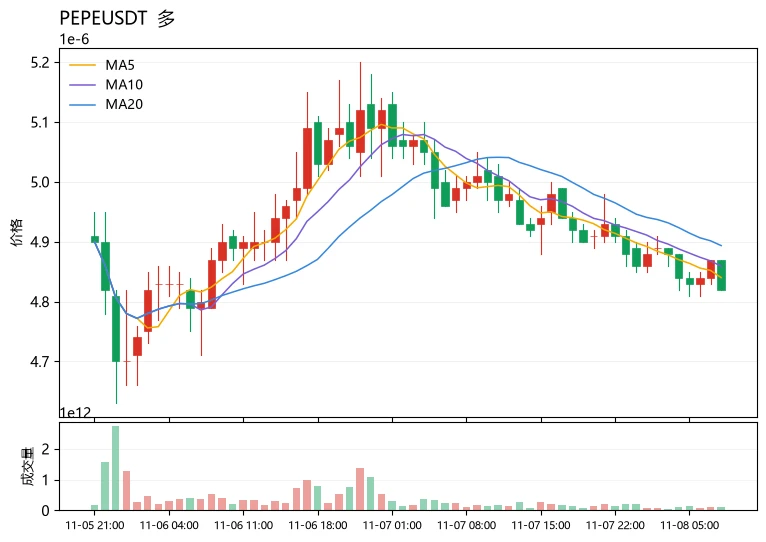
$PEPE The most unusual thing today is that the price is hugging the Bollinger lower band at 4.81121e-06, yet there has been no panic-driven surge in volume and sell-off—the 24h trading volume is only 18.0M USDT, while the decline is just 3.02%, suggesting bearish momentum is fading rather than accelerating. In terms of moving averages, MA5=4.84e-06 remains below MA20=4.8935e-06, with the short- and medium-term averages in a bearish alignment, but the current price is just a step away from MA5, indicating that the decline has entered a zone of deceleration. The MACD histogram at -5.075e-09 rem
post-image
PEPE+0.97%
BCH+1.05%
PUMP-1.06%
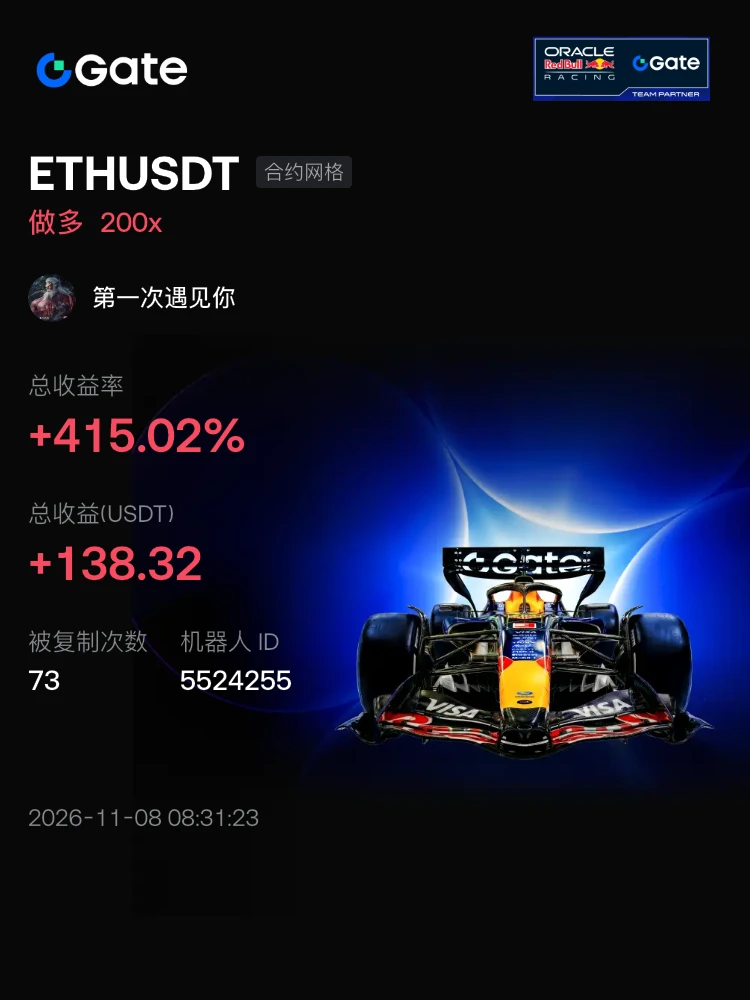
#交易机器人 I'm using the ETHUSDT contract grid bot on Gate—come copy my trades
post-image
78% of accounts are long on $ETH . Consider shorting the 2235–2236 range. If this level holds, sellers may push the price toward 2230. A break above 2244 invalidates this view. Reasons: - At 2235, the trend structure still favors sellers, with the price below the EMA50. - The daily price is below the EMA200 at 2291, indicating the broader trend is down. - RSI is 45, indicating neutral momentum, with room for further weakness. Short 2235–2236 Take profit 2230 / 2227 / 2222 Stop loss 2244 Will sellers defend this level? Not investment advice · Do your own research
post-image
ETH-1.26%
Load More

Join 40 M users in our growing community

⚡️ Join 40 M users in the crypto craze discussion

💬 Engage with your favorite top creators

👍 See what interests you

Trending Topics

USCPIDataIncoming

23.39k Views1.45k Discussing

The U.S. October CPI report will be released on November 10 at 8:30 a.m. ET. September CPI came in at 3.7% year over year, and markets will be watching closely for signs that inflation is cooling, especially in core CPI. A softer-than-expected reading could strengthen rate-cut expectations, while hotter inflation may pressure risk assets through higher Treasury yields and a stronger dollar. How do you think this CPI print will move $BTC, U.S. stocks and gold?

USAIStocksHitHard

22.67k Views3.69k Discussing

USNonfarmPayrolls

38.29k Views4.36k Discussing

View More