
Square
Following
Hot
News
Notifications
Profile
Share your thoughts
placeholder
Article
Why did this news suddenly blow up? Are the major players about to dump their holdings?
$ON Short entry price: 0.1615 Take-profit 1: 0.1585 Take-profit 2: 0.1556 Stop-loss: 0.1663 ON is struggling to recover from the recent decline. Bears currently hold the more favorable position.
post-image
ON+4.77%
  • 1
Trenches
ZIG
Z
bade
b
ZIG
0x8c...1145
Market Cap
$.
Change
.
24h Vol
$.
Holders
.
BTC
B
bade
b
BTC
C5xp...pump
Market Cap
$.
Change
.
24h Vol
$.
Holders
.
STONK
S
bade
b
STONK
6GmA...UNgx
Market Cap
$.
Change
.
24h Vol
$.
Holders
.
José
J
bade
b
José
87CQ...1UJT
Market Cap
$.
Change
.
24h Vol
$.
Holders
.
IDOL
I
bade
b
IDOL
0x3b...ab07
Market Cap
$.
Change
.
24h Vol
$.
Holders
.
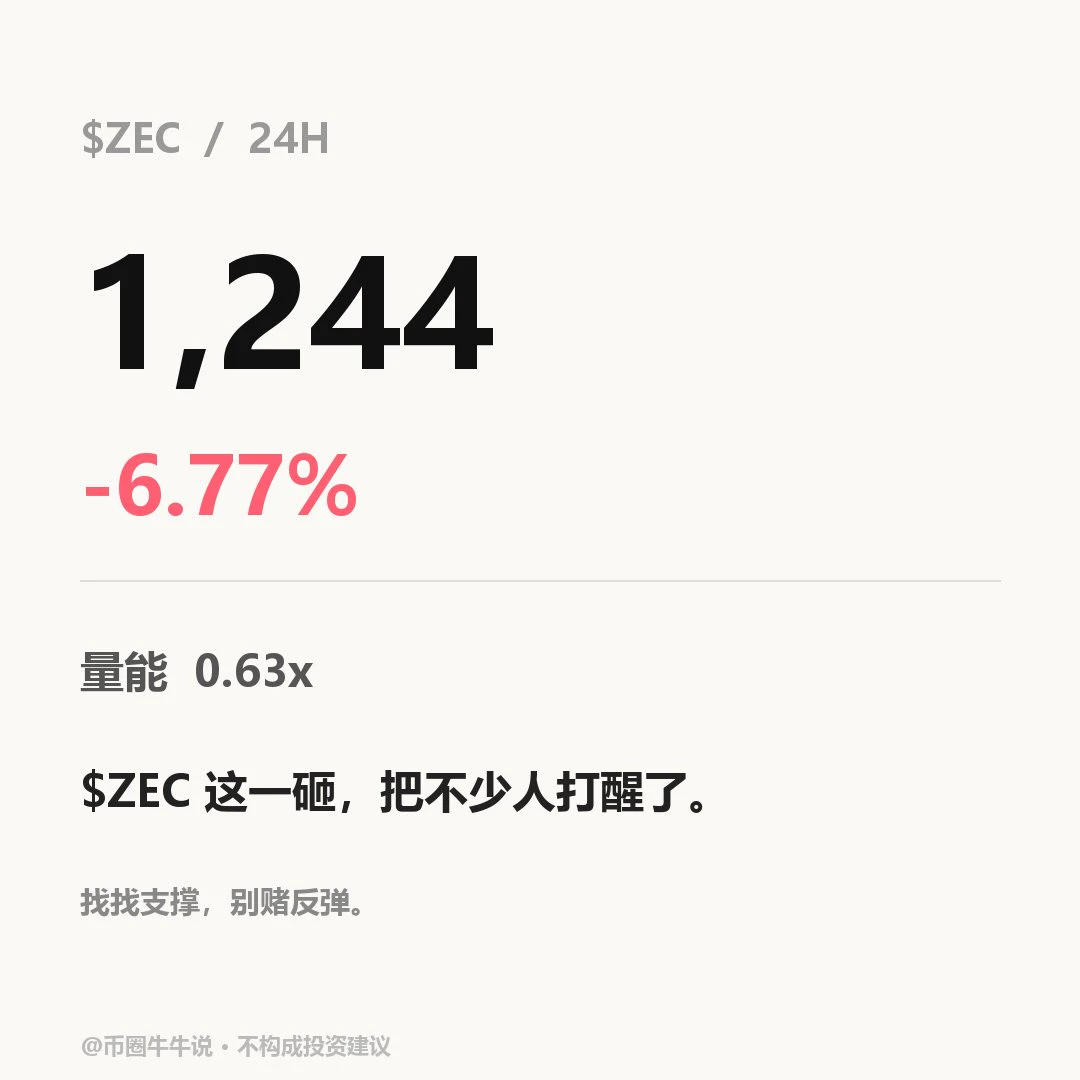
$ZEC Currently at 1243.6, down 6.77% over 24H (range: 1236.65–1364.08). The 1H trend is weak, with RSI at 12.21 (oversold); price is below the EMA20 at 1282.57, and the volume ratio is 0.63. The 4H trend is weak, with RSI at 50.99; price is below the EMA20 at 1282.62, with support at 1159.00 and resistance at 1387.89. If price holds above the 1364.08 resistance, watch for continuation; a break below the 1236.65 support would weaken the structure. Follow up by checking whether price holds above 1364.08 and reclaims 1236.65; volume is only 0.63x. A hold without volume or a failure to reclaim the
post-image
ZEC+1.16%
$ONE and $KOMA have both seen their upward momentum weaken noticeably after a rapid rally, with signs of exhaustion emerging in the market. I personally think a pullback is likely next, and I’ve already started building short positions.
$ONE futures short plan: Entry at 0.00240, first target at 0.00156, with defense at 0.00269.
$KOMA futures short plan: Entry at 0.01648, target at 0.01423, stop-loss at 0.01710.
The above is only a personal trading idea and does not constitute investment advice. Futures leverage carries extremely high risk, so please manage your position carefully.
post-image
KOMA-3.91%
Berkshire Hathaway reported third-quarter operating earnings of $12.705 billion (down 5.8% year-over-year) while accelerating its share repurchases to a record $9.6 billion under CEO Greg Abel.
‍#ShareWeekly #USAIStocksHitHard
post-image
BRKB-0.20%
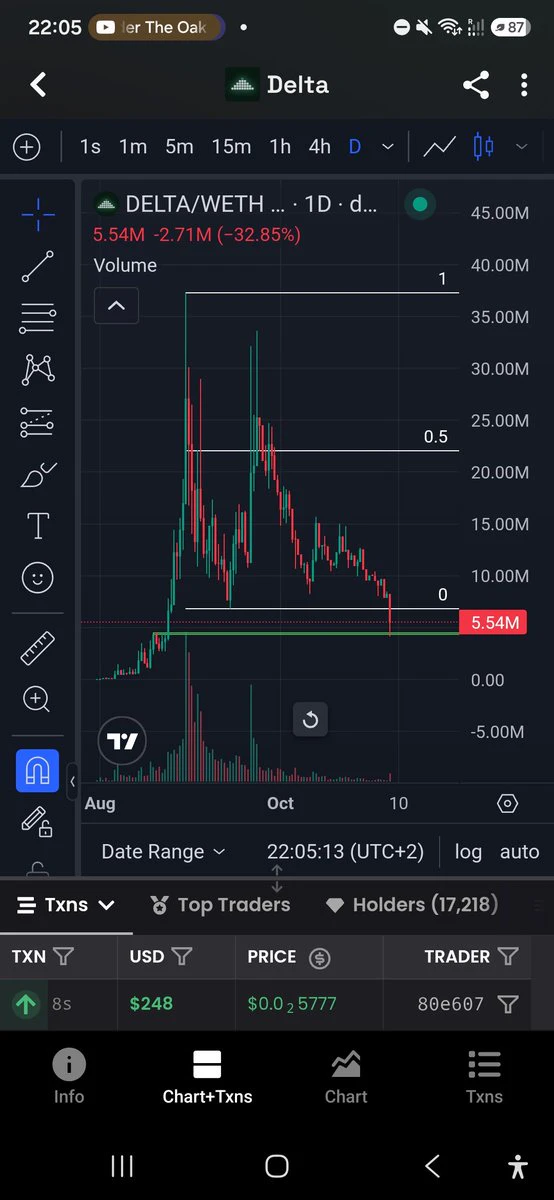
Bought $DELTA @deltaliquidity here on the capitulation/FUD
post-image
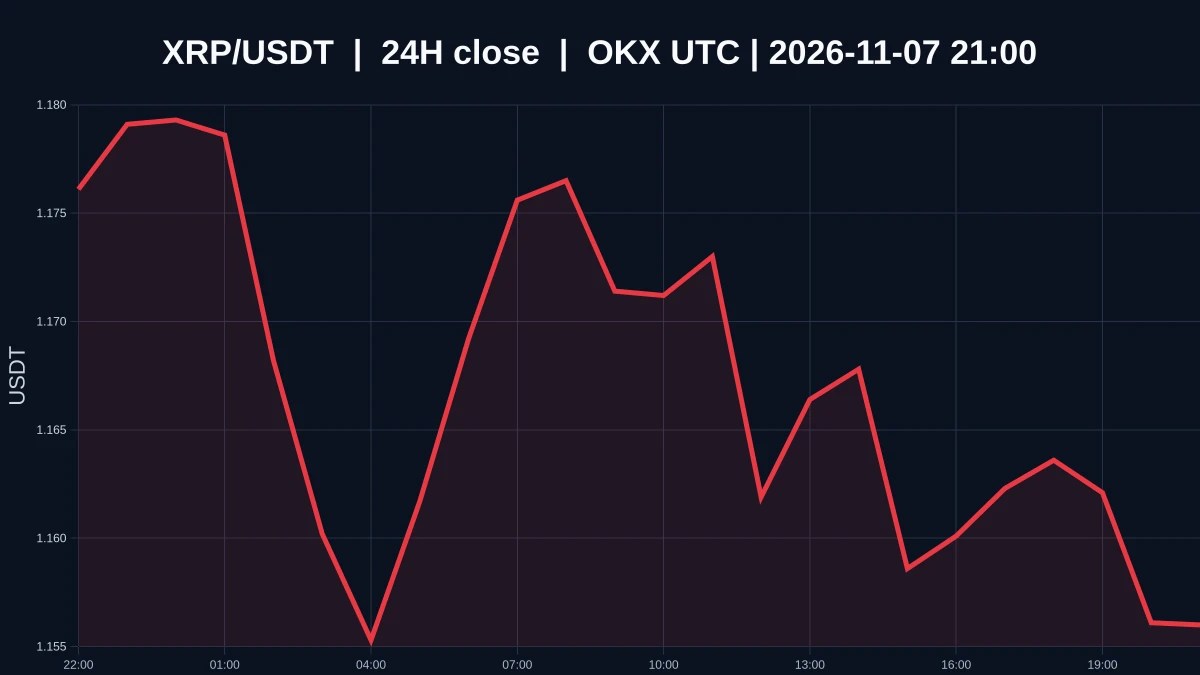
$XRP Is Weak on Low Volume at 1.1567. What’s Still Missing Between Oversold and a Bottom?
$XRP is currently priced at 1.1567, down about 1.44% over the past 24 hours, with an intraday low of 1.151 and high of 1.1853. The 1-hour and 4-hour trends are both weak, and the volume ratio is around 0.0429, indicating low market participation. Oversold describes a condition; a bottom is a confirmed outcome. A steep decline only shows that selling pressure has occurred. It does not automatically mean the price is cheap, much less prove that buyers are actually defending the area around 1.151. Demand for
post-image
XRP-1.15%
$BTC 1st Short-Term Target Hit! 💥🎯
post-image
BTC-0.67%
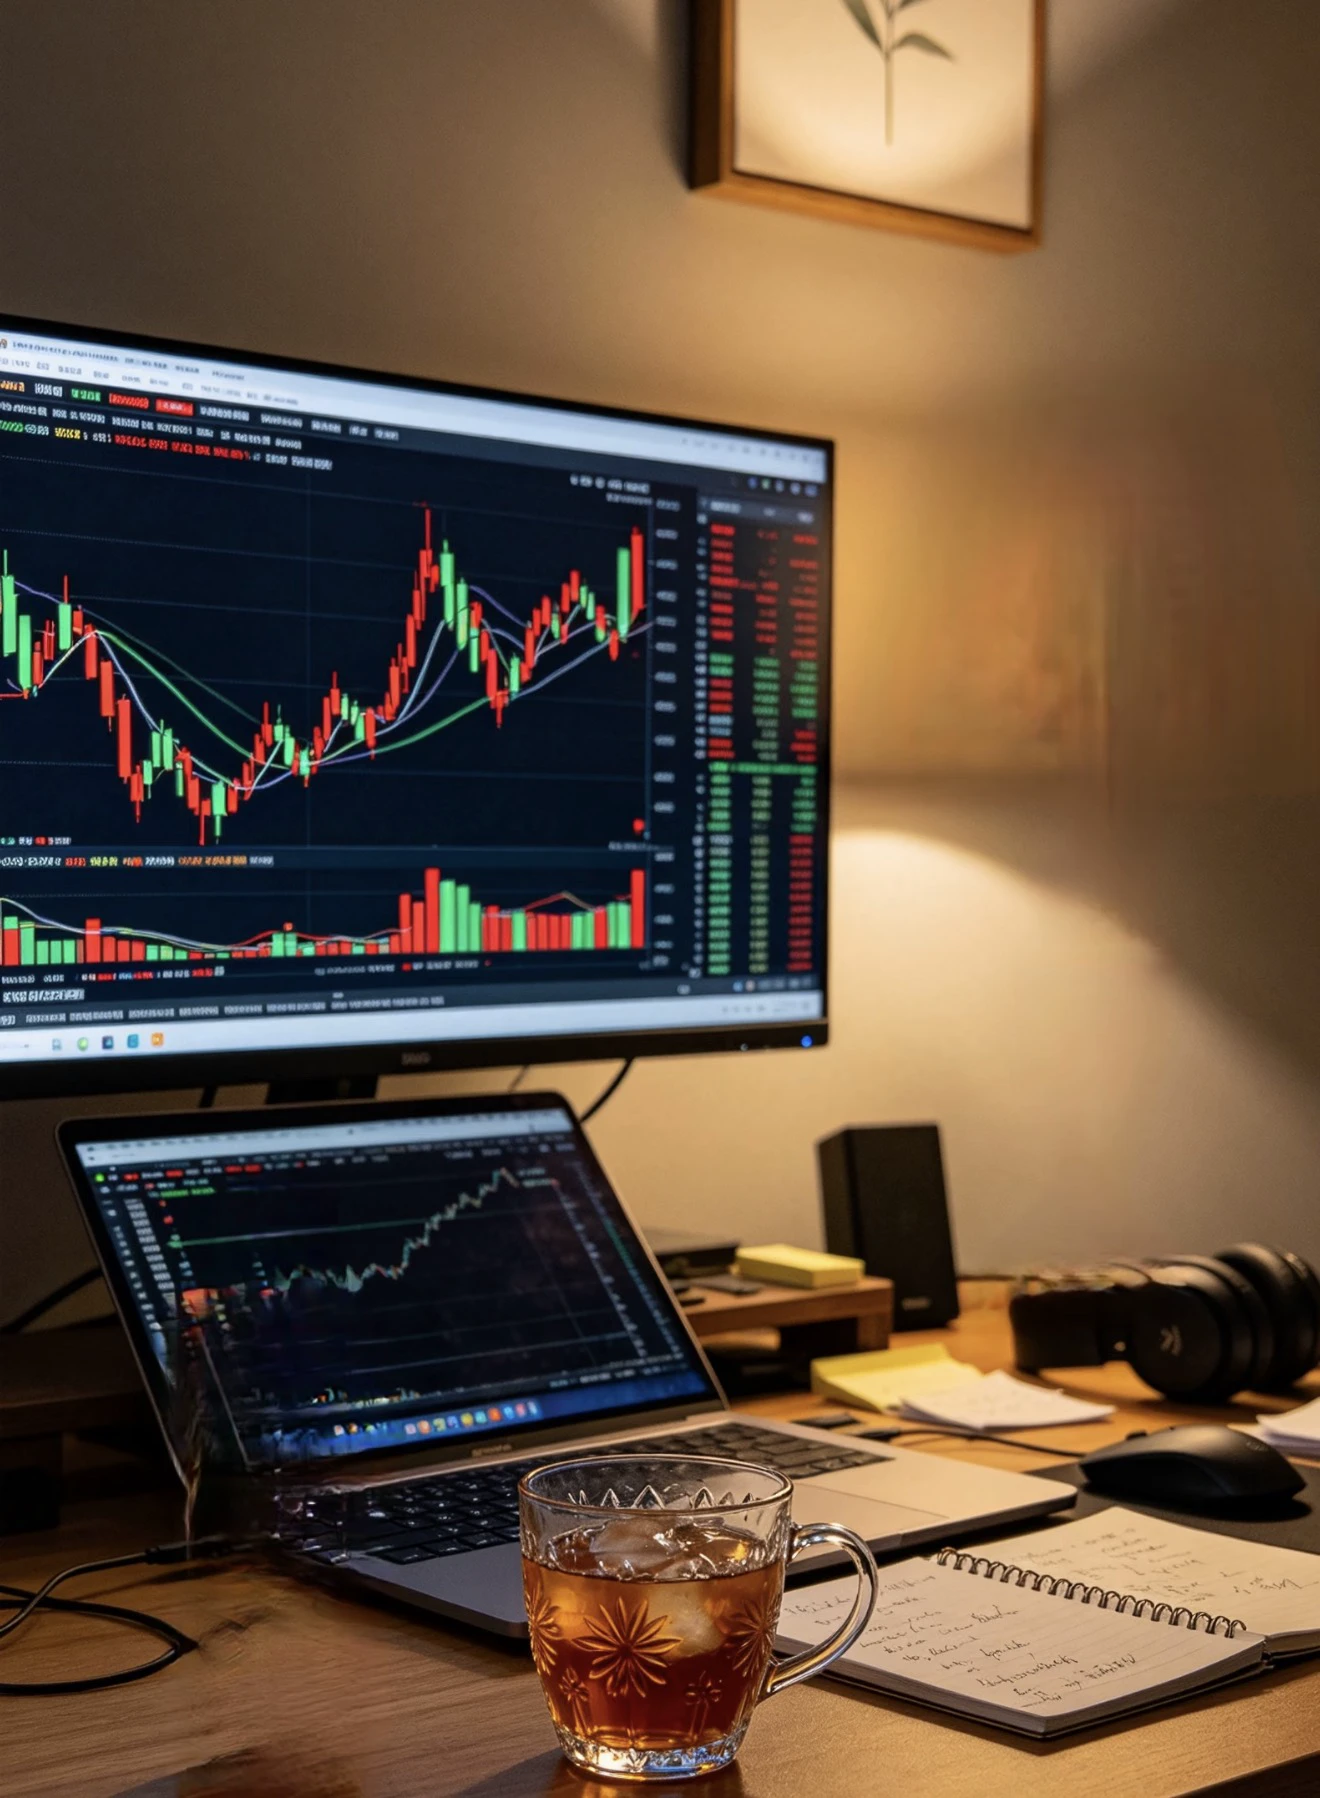
“Under 2,000 U? Don’t copy the big influencers”
People with only one or two thousand U to their name love copying the big influencers.
They learn to draw ten lines, watch five indicators, and call trades every day.
The more they learn, the more complicated things get, and the smaller their account gets.
I grew from 30k to 10 million using just one pattern: the step.
It took a little over two years to go from 30k to 1 million.
It took one year to go from 1 million to 6 million.
It took seven months to go from 6 million to 10 million.
The further I got, the more I understood one thing:
The speed
post-image
BTC-0.65%
Kidly send me followers red packet arrange a time 60 minut in my live streaming i am starting the
live-cover
LIVE57
Crypto market: Long-term holder supply share—are old wallets accumulating or distributing? Bull-to-bear transition: old coins stay put, or even continue accumulating. Bear-to-bull transition: old coins start moving to exchanges in large amounts. When veterans distribute, newcomers are celebrating—this is what defines a cycle top. ③ Exchange balances: falling balances = coins being withdrawn (accumulation); rising balances = preparing to sell. Note: ETF/institutional custody can distort this metric, so compare like with like. ④ Stablecoin total market cap: the market’s “ammunition reserve.” Exp
post-image
BTC-0.65%
ETH-1.23%
I just entered a short (sell) trade on $SWARMS
Stop loss: 0.00779 Take-profit targets: 0.00670 - 0.00665 - 0.00643 Start trading here 👇👇👇👇👇👇
post-image
SWARMS-3.61%
World Liberty Financial's USD1 has 640,195 holders, more than 3.5 times the 181,039 holding PayPal's PYUSD.
USD1 also has 380,148 monthly active addresses, more than 3 times PYUSD's 115,565.
@worldlibertyfi
USD1+0.00%
PYUSD-0.09%
🔹 High prices continue to erode purchasing power, and US consumer confidence remains weak.
live-cover
LIVE52
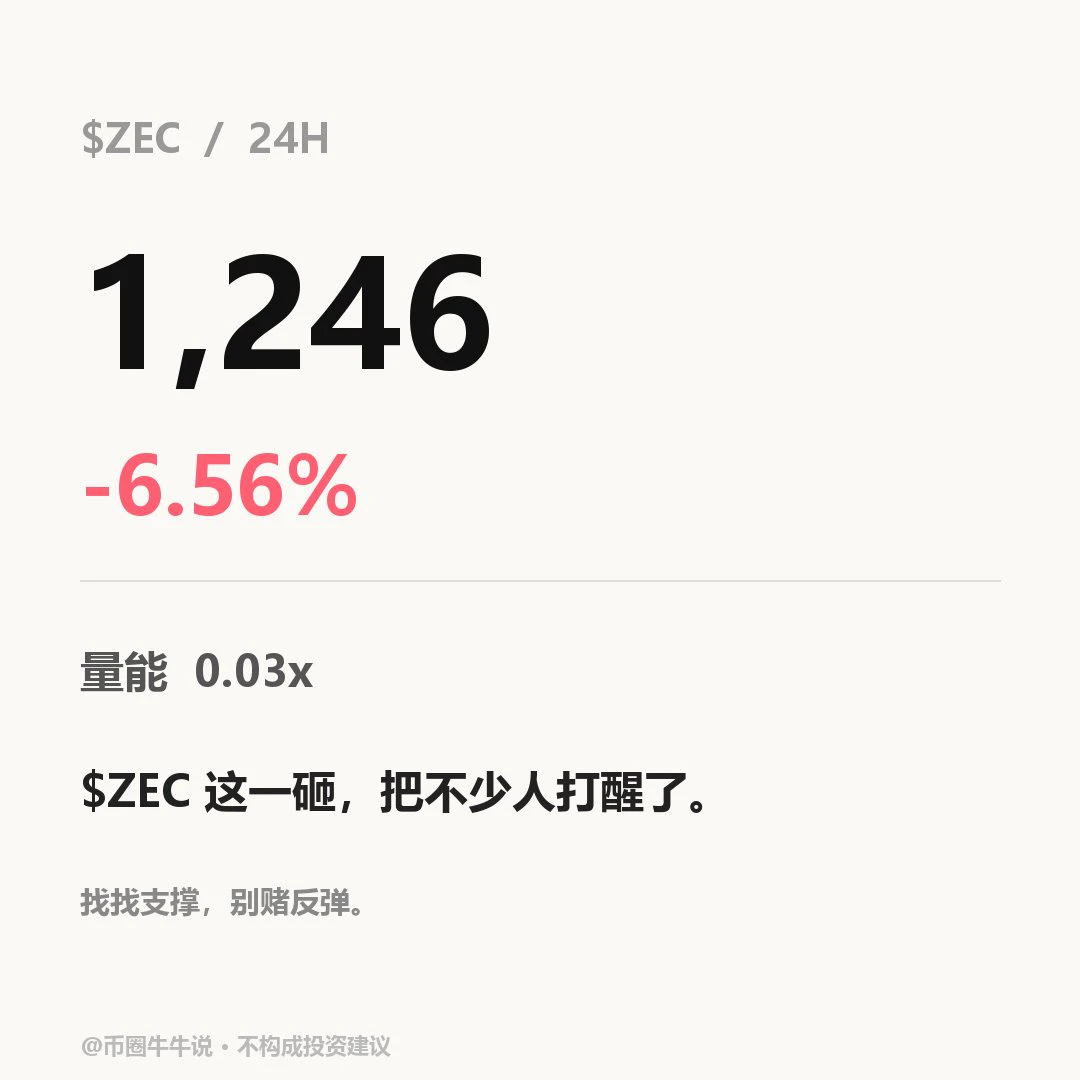
$ZEC Currently at 1246.5, down 6.56% over 24H (range: 1242.05–1364.08). The 1H trend is weak, with RSI at 12.56, price below the EMA20 at 1282.85, and a volume ratio of 0.03. The 4H trend is weak, with RSI at 51.52, price below the EMA20 at 1282.90, support at 1159.00, and resistance at 1387.89. If price moves above and holds the 1364.08 resistance, it can be monitored; a break below the 1242.05 support would weaken the structure. Review whether price holds above 1364.08 and reclaims 1242.05; volume is only 0.03x. A low-volume hold above resistance, or a break below support without a subsequen
post-image
ZEC+1.16%
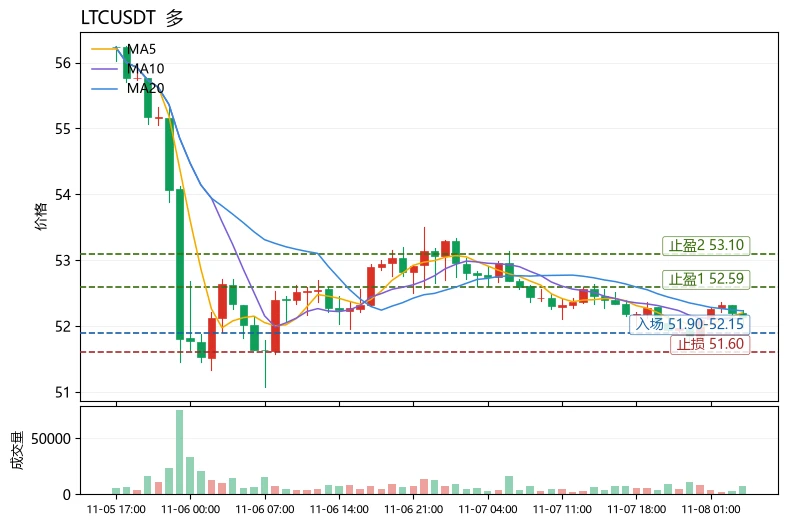
$LTC Current price: 52.14. The first resistance above is the Bollinger upper band at 52.59, and support below is the Bollinger lower band at 51.87. These two levels are where bulls and bears are currently locked in a short-term battle. Why give the price levels before explaining the logic? Because the first step in reading a chart is always to establish your bearings, not to predict.

Using LTC as an example, here's a reusable way to assess trend health: moving averages show direction, MACD shows momentum, and RSI shows positioning. A healthy trend requires all three to align. Currently, MA5=5
post-image
LTC-0.09%
PEPE+0.97%
Allowlisted for @torpornet (tier A). Applicant 24904. 4,444 frogs, built to sit. Check yours:
$BEAMX LONGtrying to stabilize after several hours of selling. A recovery toward the previous hourly range is worth watching.entry: 0.003947tp1: 0.004020tp2: 0.004110sl 0.003720
post-image
BEAMX+5.82%
Load More

Join 40 M users in our growing community

⚡️ Join 40 M users in the crypto craze discussion

💬 Engage with your favorite top creators

👍 See what interests you

Trending Topics

USAIStocksHitHard

21.24k Views3.67k Discussing

U.S. stocks sold off sharply on Thursday, November 5 (UTC). The Nasdaq closed down around 5.5%, entering correction territory, while the Philadelphia Semiconductor Index plunged roughly 12%, with chip stocks including $NVDA and $AMD posting steep losses. Beyond profit-taking, investors are growing concerned about the pace of AI data center construction, capital spending, and future returns on investment. The key question now is whether the AI sector’s lofty growth expectations need to be repriced. Where do you think the next opportunities will emerge: chip stocks, tech giants, or other sectors?

USNonfarmPayrolls

34.98k Views4.34k Discussing

StakeOnLaunchpoolToShare450KVLX

10.25k Views829 Discussing

View More