Square
Following
Hot
News
Notifications
Profile
Share your thoughts
placeholder
Article
# Why Might a Once-Effective Strategy Gradually Stop Working?

If a trading strategy has delivered profits consistently, why might it start losing frequently a few months later, or even after a longer period?

Has the market changed, or is there a problem with the strategy itself?

This question is especially worth considering in digital asset markets. Market participants, liquidity, volatility structures, and trading behavior can all change. Opportunities that could be captured in the past may not last forever.

**A strategy’s past effectiveness only shows that it performed well under specifi
post-image
BTC UPDATES
live-cover
LIVE2,090
Trenches
BTC
B
bade
b
BTC
C5xp...pump
Market Cap
$.
Change
.
24h Vol
$.
Holders
.
ZIG
Z
bade
b
ZIG
0x8c...1145
Market Cap
$.
Change
.
24h Vol
$.
Holders
.
STONK
S
bade
b
STONK
6GmA...UNgx
Market Cap
$.
Change
.
24h Vol
$.
Holders
.
GM
G
bade
b
GM
0x13...7777
Market Cap
$.
Change
.
24h Vol
$.
Holders
.
DESSA
D
bade
b
DESSA
npz2...pump
Market Cap
$.
Change
.
24h Vol
$.
Holders
.
Short $BTC around 765-770, stop loss at 775, targets 755-751-745-740.

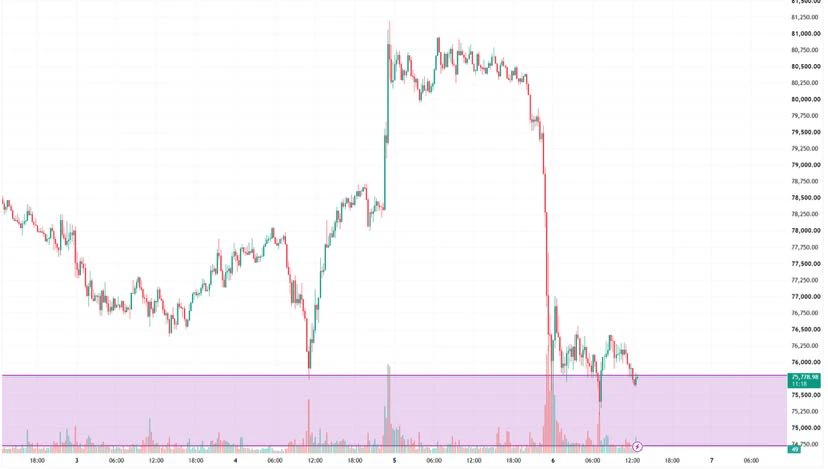
Up 5,000 one day, down 5,000 the next. Yesterday it peaked at 81188; today it plunged to a low of 75158, making a near-10,000-point A-shaped crash over two days. Yesterday, the market was still touting election tailwinds; today, it has completely changed its tune.

The real trigger for the sell-off was the market's growing concern about tighter AI regulation and slower data center construction after the Democrats won the midterm elections. The Nasdaq plunged 5.5% in a single day, wiping out about $2.5 trillion in Nasdaq 100
post-image
NAS100-0.07%
Why Can Small Orders Cause Significant Slippage When Liquidity Is Low?

In the cryptocurrency market, many people believe that only large trades can affect execution prices.

But that is not always the case.

Sometimes, an order that does not look particularly large can still be filled at a price significantly different from what was expected.

Why?

Because the execution price depends not only on how much you want to buy, but also on the prices at which the market can provide enough liquidity at that moment.

I. The Market Price You See Is Not the Price You Can Trade At

Suppose a trading pai
post-image
How should trading strategies be adjusted when market conditions change?

In the previous article, we discussed how to identify changes in market conditions.

But identifying that the market has changed is only the first step.

What truly determines trading results is what you do next.

When a trending market turns into a ranging market, a strategy that was previously effective may start triggering stop-losses frequently; when market volatility suddenly increases, even if you correctly predict the direction of a trade, you may still suffer losses due to an oversized position, increased slippag
post-image
#btc #SOL #pi
Everything is fake; what’s real is fully enjoying my fruit 🍏 feast right now 😋
BTC-5.05%
SOL-0.77%
PI-10.71%
GM Fam
Stay Bullish
post-image
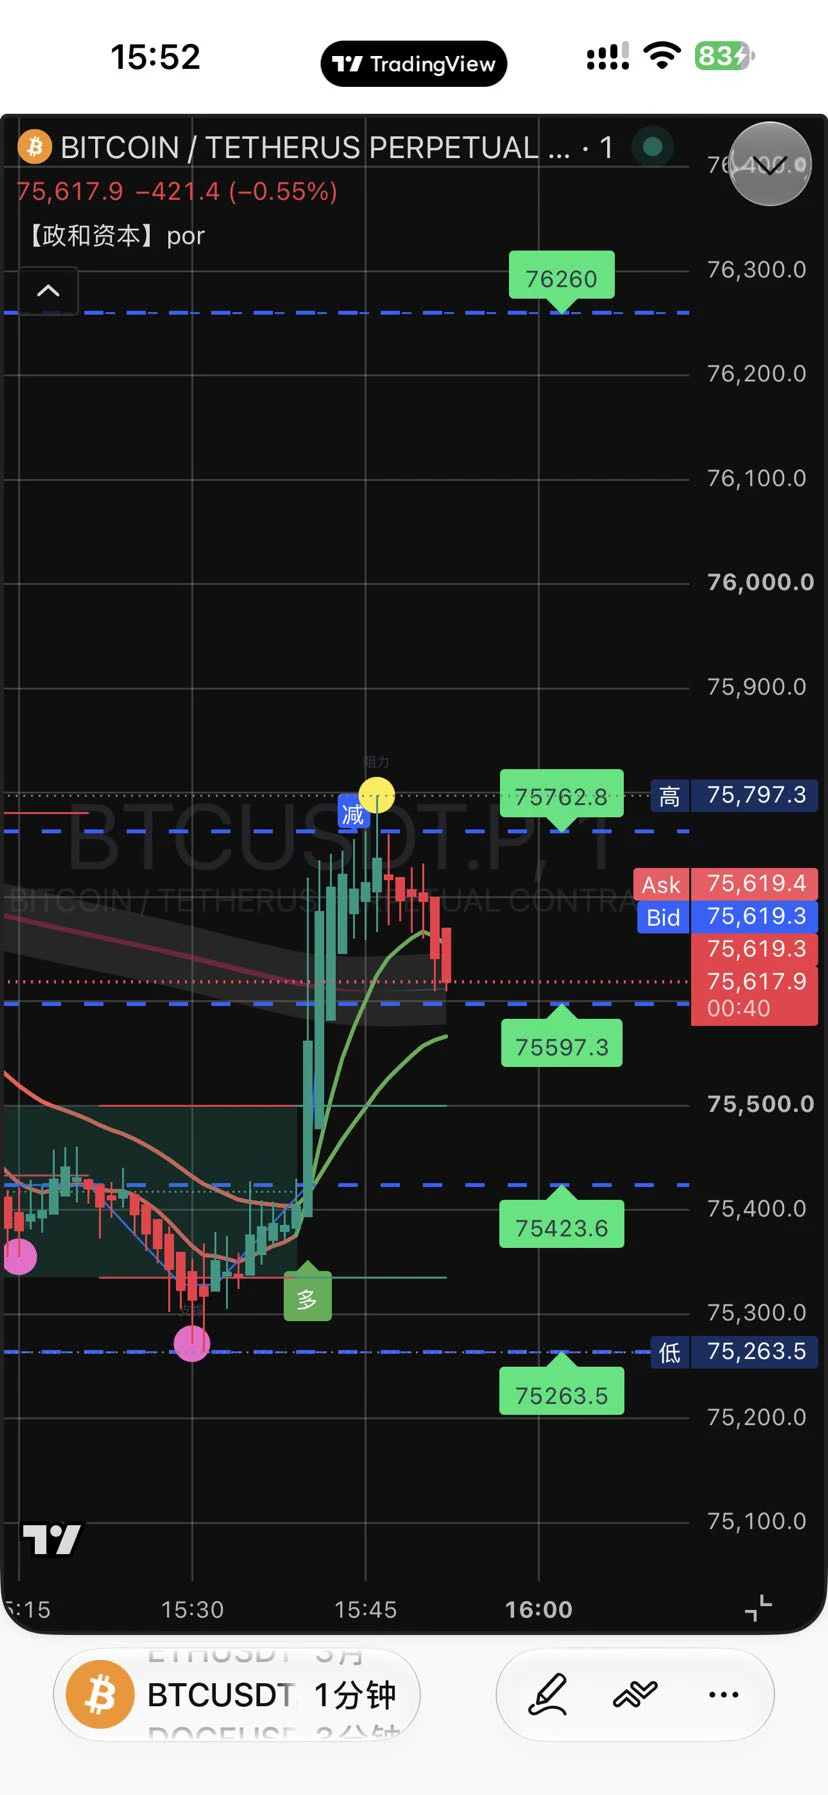
November 6, 2026 (Friday) BTC Futures Strategy for Today (based on the current range of approximately $75,300–$75,600)
Core View (Bearish; Caution on Rebounds)
BTC quickly pulled back from around $80,500 to around $75,500, breaking below recent support, with weak short-term momentum. Today, prioritize watching for a failed rebound as a short opportunity, or consider going long only after a retest of lower support. Keep positions light.
Specific Strategies
1. Short the Rebound (Primary Strategy)
• Watch zone: $76,500–$77,500 (or near $78,000)
• Entry reference: Consider a small short if the p
post-image
BTC-0.65%
Probably making a wish!
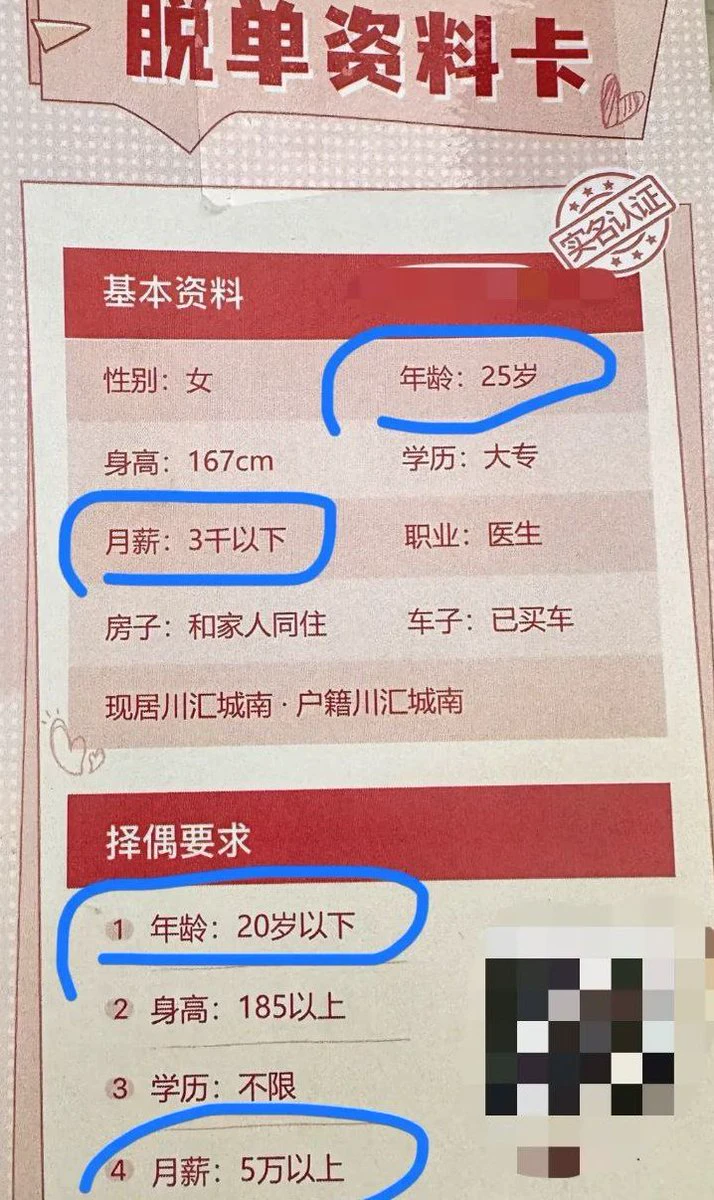
With a monthly salary of 50,000, how could he possibly be single?
post-image
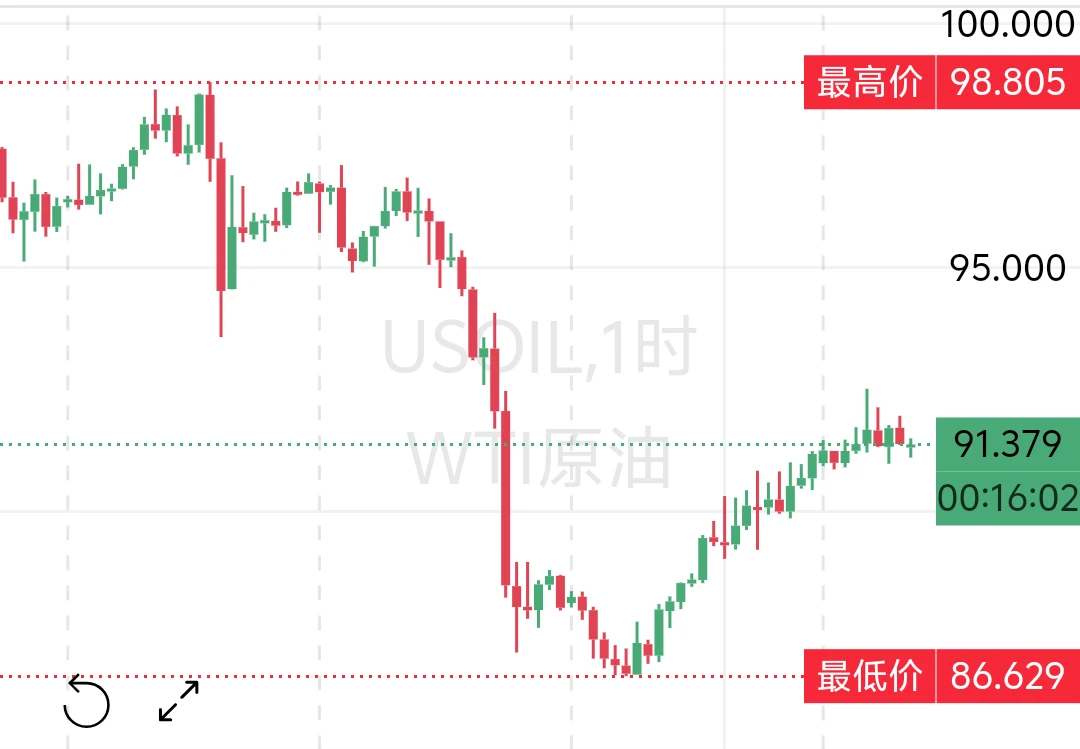
From the hourly chart perspective, crude oil has stabilized at the bottom after a deep earlier decline and staged a strong, sustained rebound. The short-term uptrend remains intact, with bullish momentum dominant. The strategy is to buy dips, with an initial target near 94.
$XAU $BTC #美股史诗级抛售 #10月非农数据聚焦 #Gate股票畅聊季
post-image
XAU+0.38%
BTC-0.65%
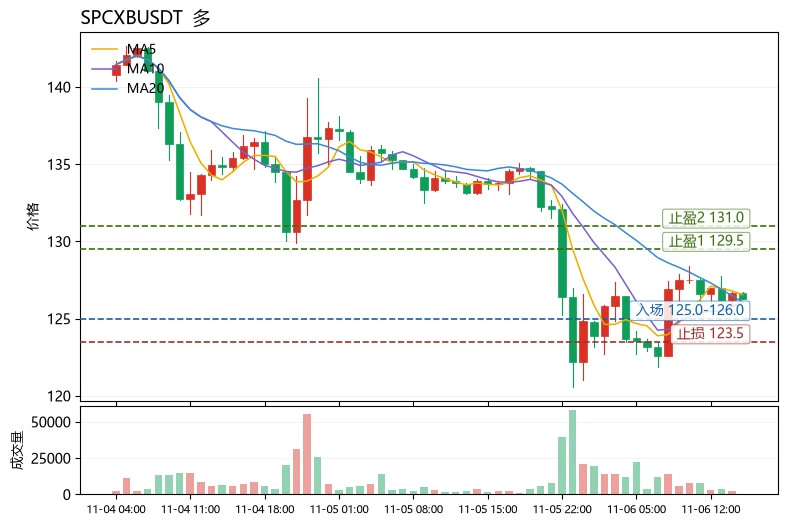
$SPCXB The most unusual detail today is not the drop, but the moving-average structure: the price fell 5.77% in 24 hours, yet MA5 remains above MA20 (126.554 versus 126.081), and the MACD histogram is still positive at +0.4746. This indicates the decline is taking place within a bullish alignment, making it a pullback rather than a trend breakdown—an ideal example for illustrating a reusable method: to judge whether a trend is healthy, first check the relative positions of the moving averages, then see whether momentum indicators are diverging, and finally use the Bollinger Bands to locate the
post-image
SPCXB
SPCXBSpaceX
Four.meme
MC:$3.12KHolders:2
0%
WLFI-0.16%
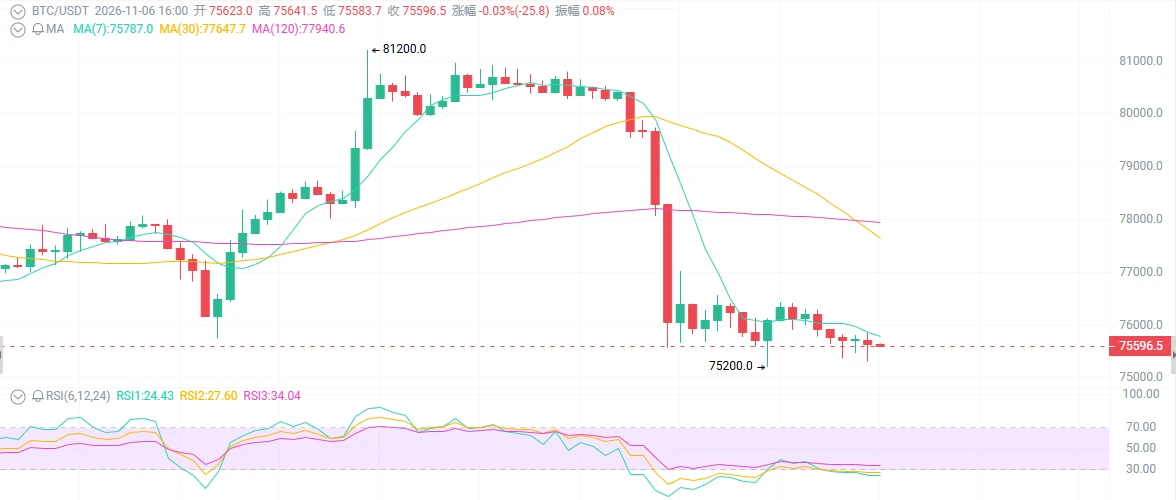
Bitcoin at $75,600—can you sleep tonight?
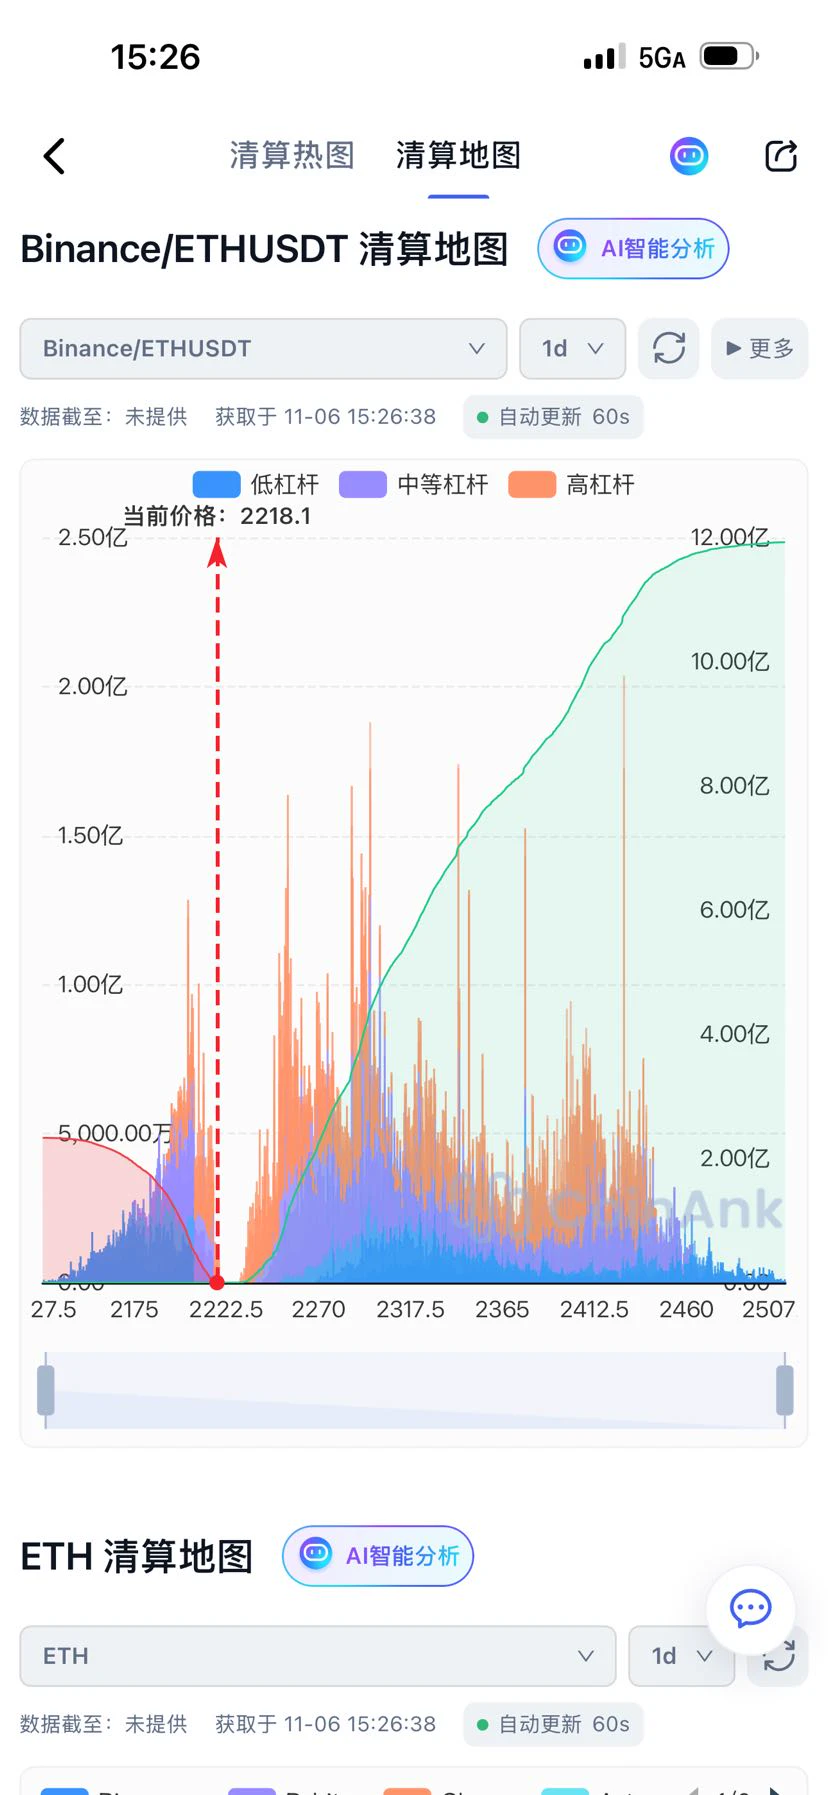
Over $1 billion in liquidations in 24 hours, all longs. U.S. stocks crashed 5%, and BTC plunged 6% along with them, dropping straight from 81k to 75.6k. The Fear and Greed Index fell to 28, and the groups are full of “It’s over, it’s over.” But just now, the price held firm at 75k—is this the final drop, or the gateway to the abyss?

First, the surface picture: blood in the streets, but someone’s picking up chips in the basement.

The Nasdaq fell 5.5%, the S&P 500 fell 4.4%; AI valuations are getting hammered, tech spending is under scrutiny, and the D
post-image
BTC-0.67%
ETH-1.26%
SOL-0.77%
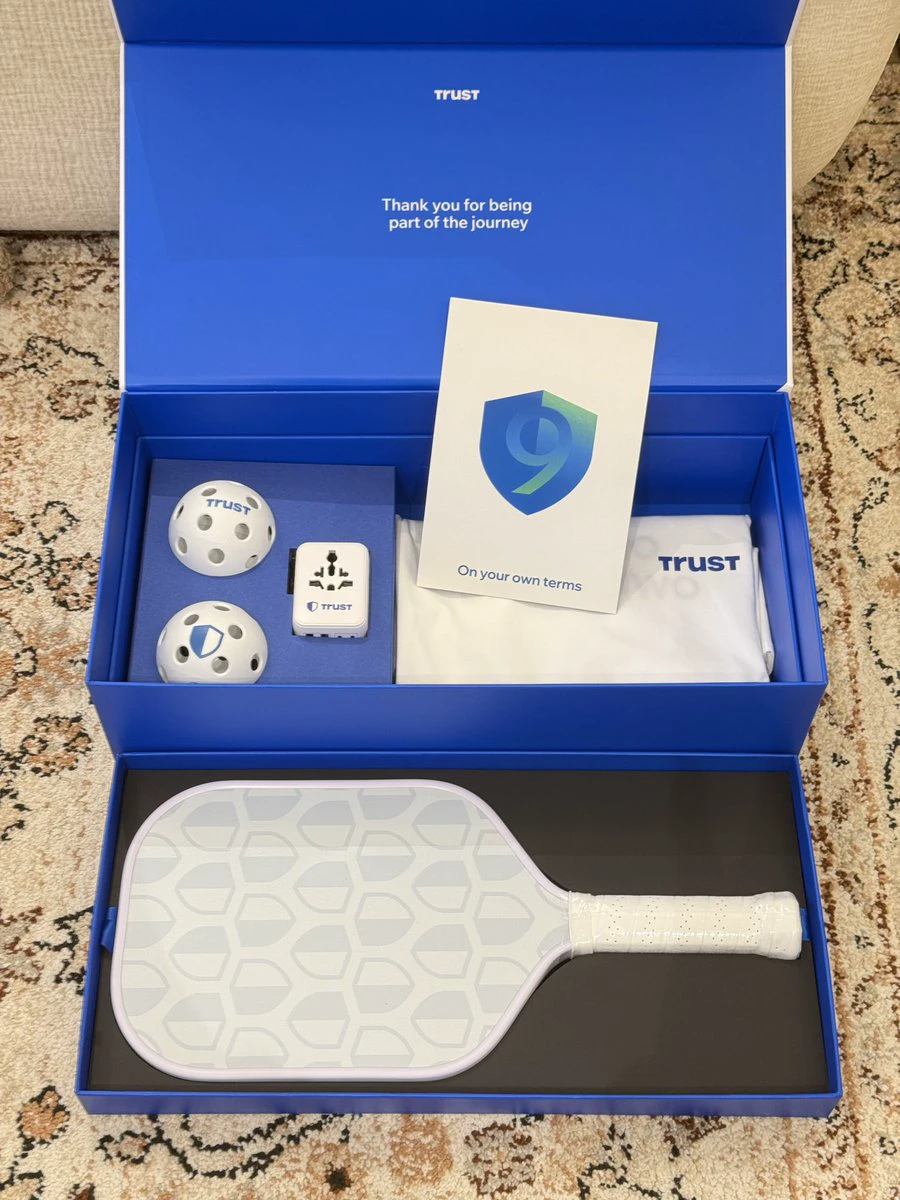
Thanks @trustwalletzh @vanisaxxm for sending over Trust’s 9th anniversary gift box💝. I can’t believe how quickly time has flown—Trust is already celebrating its 9th anniversary! Wishing Trust continued success and even greater growth!
The gift box is fresh and stylish. When I opened it, I found a pickleball set with paddles, a T-shirt, and a multifunctional power strip. I’ve never played pickleball before, so it looks like I’ll have a new skill to learn😂
post-image
TODAY UPDATE
live-cover
LIVE1,502
We’ve completely dominated the market this cycle!
We’ve made money both long and short on BTC and ETH, nailing every turning point ahead of the crowd. While others are still hesitating and watching, we’re already in the market, taking profits.
We catch the rallies on the way up and profit from the pullbacks on the way down. We switch seamlessly between long and short, and every trade is closed and gains realized.
There are no surprises in the market—every fluctuation is within our expectations.
We don’t rely on luck; we set the pace with skill. However the market moves, the profits follow!#美股史
BTC-0.65%
Last night, the Nasdaq 100 plunged 6.36%, and $BTC was not spared...

It tumbled from above $80,000 to around $75,000, falling more than 6% in 24 hours, while the crypto market saw over $1 billion in liquidations.

I've been watching the correlation between BTC and U.S. stocks, and this once again confirmed a pattern:

When global capital starts collectively reducing risk exposure, BTC still finds it hard to decouple; especially when market volatility surges, leveraged liquidations further amplify short-term declines.

BTC has now returned to the vicinity of its previous key low, and the $75,
post-image
BTC-0.67%
  • 5
  • 1
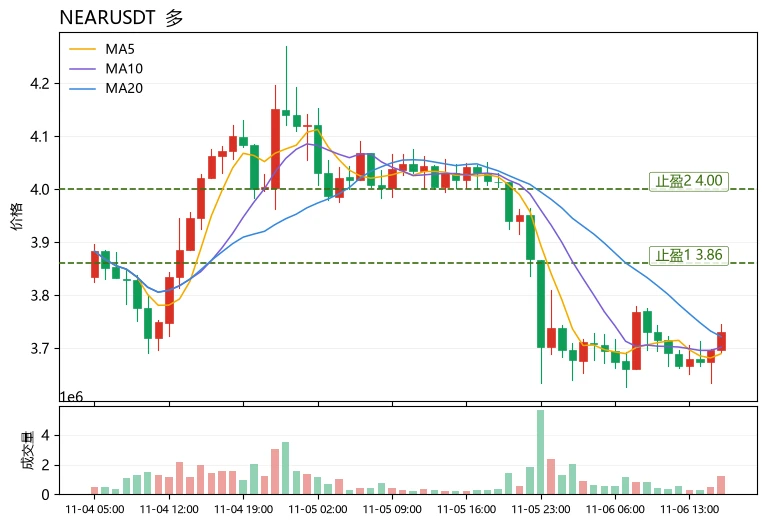
Many people see “price falling below MA5 and MA20” and immediately conclude the trend has turned bearish. This is a common misconception: a bearish moving average alignment only indicates weak short-term momentum. To make a proper assessment, look at the price relative to the Bollinger middle band, the direction of the MACD histogram, and whether longs are paying funding fees.
Take $NEAR as an example: the current price is 3.731, and MA5=3.6896 has crossed below MA20=3.7218, suggesting resistance on the surface. However, the MACD histogram is still positive (+0.008912), and the price is near
post-image
NEAR+1.17%
ENA+8.04%
ETH-1.26%
Load More

Join 40 M users in our growing community

⚡️ Join 40 M users in the crypto craze discussion

💬 Engage with your favorite top creators

👍 See what interests you

Trending Topics

USStocksFaceHistoricSelloff

4.09k Views3.64k Discussing

U.S. stocks suffered a sharp selloff on Thursday, with the Nasdaq closing down more than 5% and the Philadelphia Semiconductor Index falling over 12%. AI and chip stocks including $NVDA and $AMD were hit especially hard. Markets are reassessing AI valuations, data-center spending and future returns. Is this just short-term deleveraging, or the start of a deeper correction in the AI trade? Which sectors are you watching next?

GateLaunchesPoSECProofOfSecurity

14.32k Views591 Discussing

USNonfarmPayrolls

12.42k Views4.05k Discussing

View More