





Square
Following
Hot
News
Notifications
Profile
Share your thoughts
placeholder
Article
For more updates guys please join
post-image
  • 1
Rewards are being distributed! Open your mystery box now and win up to 100 USDT worth of tokens!
Trenches
ZIG
Z
bade
b
ZIG
0x8c...1145
Market Cap
$.
Change
.
24h Vol
$.
Holders
.
BTC
B
bade
b
BTC
C5xp...pump
Market Cap
$.
Change
.
24h Vol
$.
Holders
.
STONK
S
bade
b
STONK
6GmA...UNgx
Market Cap
$.
Change
.
24h Vol
$.
Holders
.
CORLA
C
bade
b
CORLA
0xba...7777
Market Cap
$.
Change
.
24h Vol
$.
Holders
.
Diamond
D
bade
b
Diamond
5VCE...pump
Market Cap
$.
Change
.
24h Vol
$.
Holders
.
Isolated Margin, Cross Margin, and Scaling Into a Position: Three Concepts Explained

In crypto futures trading, many people know about isolated and cross margin, and have also heard of scaling into a position.

But when it comes to actually opening a position, these three concepts are easy to confuse.

Some people think isolated margin is always safe, some believe cross margin can prevent liquidation, and others think scaling into a position can reduce losses.

None of these ideas is entirely accurate.

Today, we’ll use simple examples to explain the differences between these three concepts,
post-image
BTC-0.65%
ETH-1.23%
#USStocksFaceHistoricSelloff
Anatomy of a Volatility Spike: Analyzing the UVXY Breakout ‌
$UVXY ‌

Let’s break down the technical anatomy of this specific chart to understand how to read a parabolic breakout and manage the extreme risk associated with volatility instruments.

The Setup: A Tale of Two Halves

Looking at the chart, we see a textbook V-shaped recovery that has transitioned into a parabolic breakout.

1. The Capitulation Phase (Left Side)

From November 2nd through November 4th, UVXY experienced a severe downtrend. The price consolidated lower, eventually hitting a floor at the
UVXY+44.07%
  • 11
  • 2
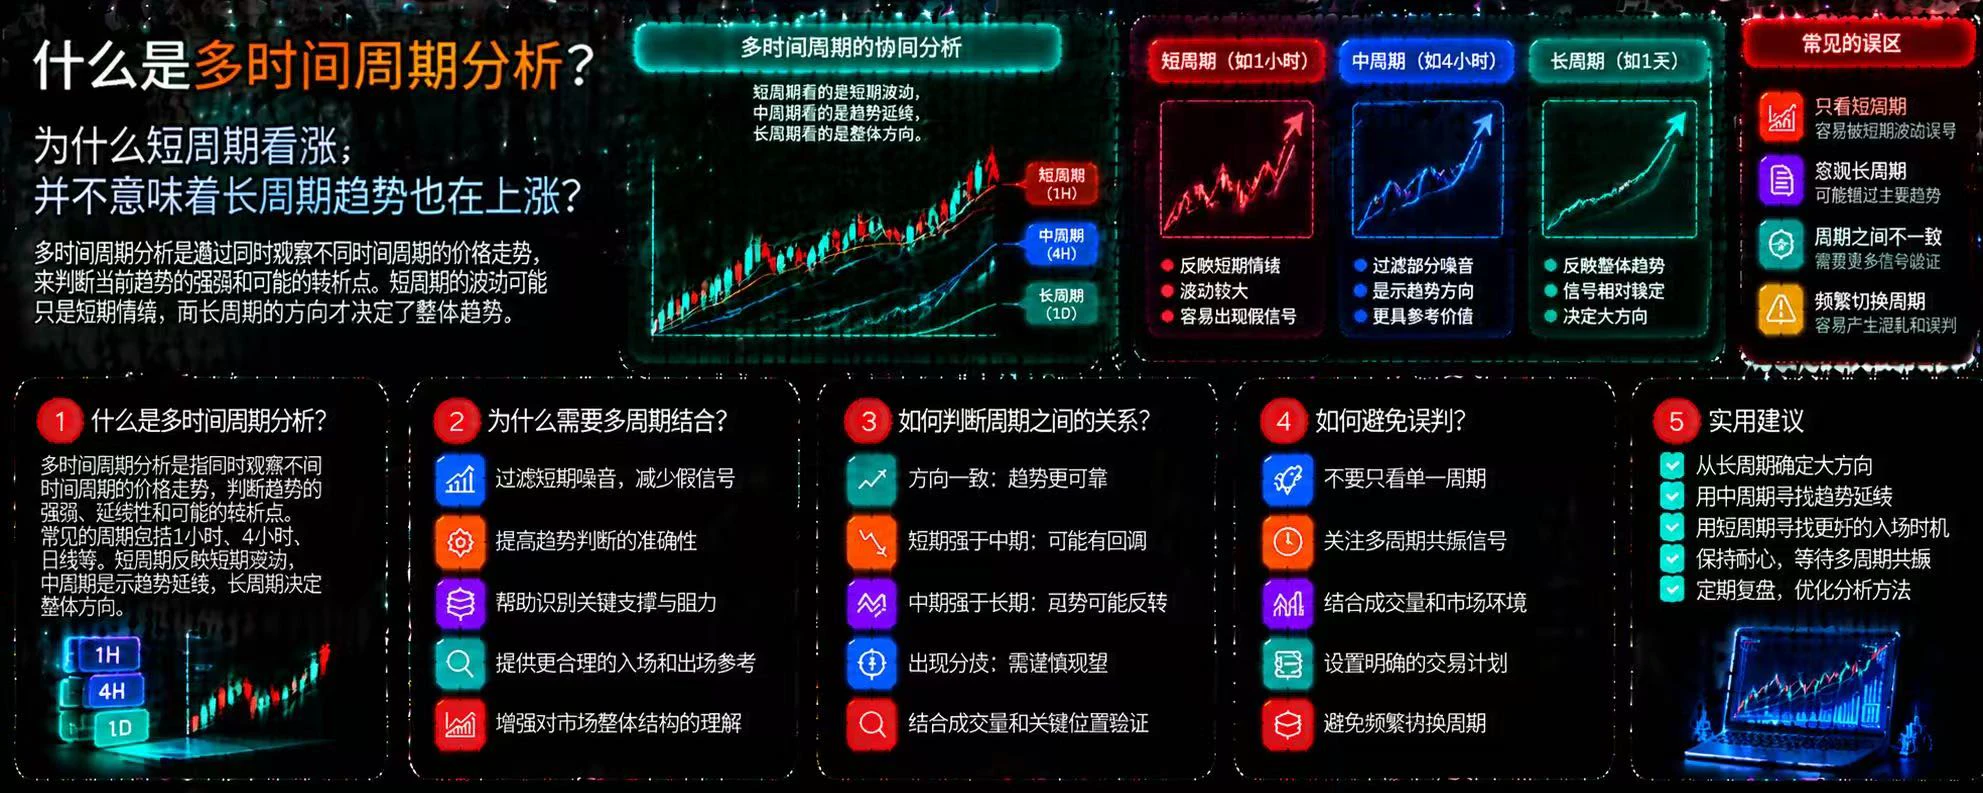
What Is Multi-Timeframe Analysis? Why Doesn’t a Bullish Short-Term View Mean the Long-Term Trend Is Also Rising?

In cryptocurrency trading, the same asset can show completely different price action across timeframes. The 15-minute chart may be rising while the 4-hour chart remains in a downtrend, and the daily chart may show a market moving sideways. Looking at just one timeframe can easily lead you to mistake a temporary rebound for a trend reversal.

First, what is multi-timeframe analysis?

Multi-timeframe analysis means observing price action across different timeframes at the same time t
post-image
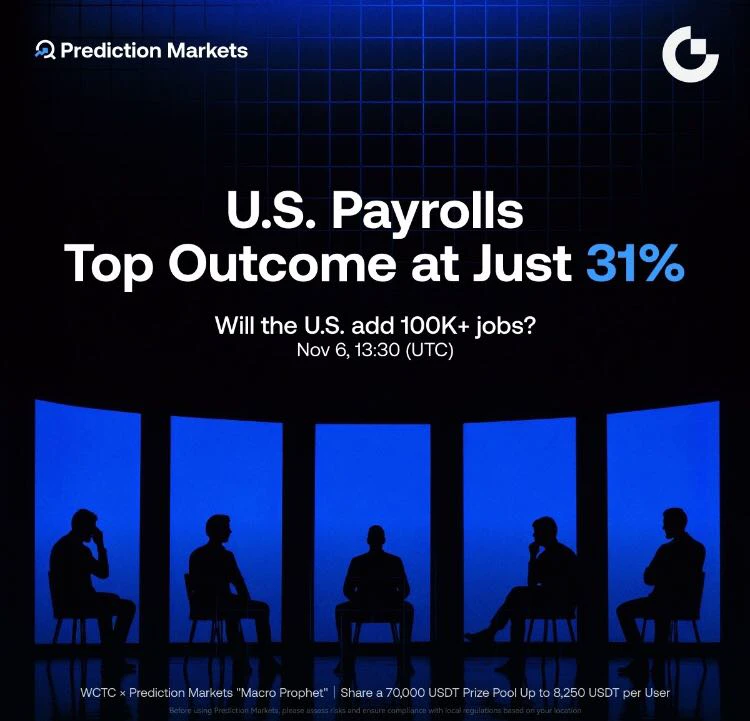
🔥 U.S. payrolls: even the leading outcome has just a 31% chance!

⏰ October’s jobs report lands on Nov 6 at 13:30 UTC.
📊 Reference market odds:
≥100K jobs added: 31%
25K–<50K: 21%
50K–<75K: 20%
A hiring rebound or further cooling? Which range gets your vote?
Join WCTC × Prediction Markets "Macro Prophet" on Gate. Meet trading requirements to share a 70,000 USDT prize pool, with up to 8,250 USDT per user!

🎁 Earn Scratch Cards as you trade and stack your rewards!
👉 Join now: https://www.gate.com/campaigns/6416
#NFP #Gate #PredictionMarkets
post-image
Gm
Its friyayyyyyyy
post-image
BTC
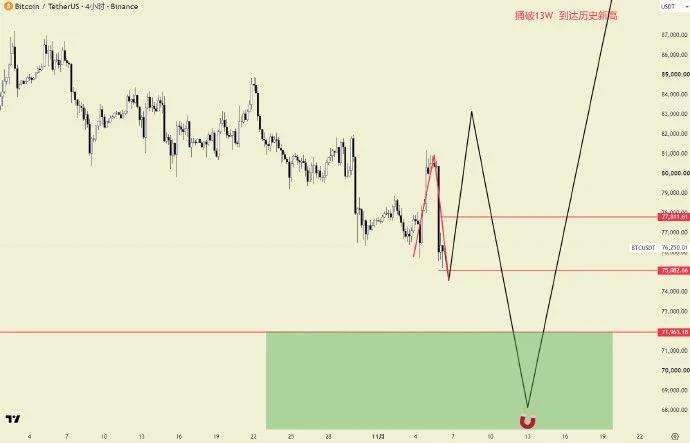
I used to constantly remind myself that if my forecast called for two V-reversals, I’d stop posting short-term analysis here and focus only on the long-term outlook.
But I was young and hotheaded, unable to let go of my conviction or swallow my pride. Once again, I’ve put myself in a position I didn’t want to be in.
If things here go the way I think they will, there’ll be three more V-reversals! That would make four V-reversals in total in the short term!!!!
But fuck it, this is my call. #btc
post-image
BTC-0.67%
🔹Democrats Sweep Both Chambers of Congress as the Dow Surges Over 3! But AI Stocks Fall Across
live-cover
LIVE2,849
What is the risk-reward ratio? Why can a trade have long-term value even if its win rate is low, as long as risk is managed reasonably?

In cryptocurrency trading, many people focus too much on win rate, believing that they need to make frequent correct calls to make money. But long-term trading results are not determined by win rate alone; the amount gained or lost on each trade also matters. The risk-reward ratio is an important tool that helps traders assess whether a trade is worth taking.

First, what is the risk-reward ratio?

The risk-reward ratio typically compares a trade’s potential
post-image
#Banknifty
Almost a month old chart
Personally i wanted a LL to go little lower
Nevertheless, the up move came as expected 🤝
#GateGuardNowAvailableForFree
Gate Guard Now Available for Free: Account Security Needs More Than a Strong Password

In crypto, protecting an account is just as important as protecting a trading strategy. A profitable position can be managed with stop-losses and risk limits, but an account compromise can put everything at risk before the owner even realizes something is wrong.

Gate Guard introduces an additional account-protection mechanism for eligible users. It is available to activate without a purchase fee, but the important detail is understanding what it covers, when protection actuall
post-image
GateSquare
🛡️ Don’t overlook account security—here’s how to activate Gate Security Guard
You can take your time checking the market, but don’t let your guard down when it comes to account security.
Gate Security Guard is available for eligible users to activate for free, providing an additional layer of protection for your account.

🔐 Eligibility requirements
▪️ Account security score of at least 80
▪️ Complete KYC 2 identity verification
▪️ Complete the relevant security verification

📱 How to activate
Gate App → Profile → Security Center → Gate Security Guard
After activation, you must maintain a qualifying security score for 30 consecutive days. Protection takes effect once the requirements are met. You can apply for compensation for losses from unauthorized asset transfers if you meet the eligibility requirements.

👉 Learn more and activate now:
https://www.gate.com/gate-guard
📖 Full activation guide:
https://www.gate.com/zh/announcements/article/102570
‍#Gate安全卫士 #GateSquare
repost-content-media
#USStocksFaceHistoricSelloff
$HYPE : Wall Street Access Could Be the Next Big Chapter for Hyperliquid.

Hyperliquid is moving closer to a major milestone in US crypto markets.

Hyperliquid Strategies, the Nasdaq-listed company holding approximately 38.9 million HYPE tokens, has filed an application through its subsidiary to become a Futures Commission Merchant (FCM).

Why does this matter?

If regulators approve the application and the required permissioned markets receive approval, the company could help US customers access perpetual futures markets built on Hyperliquid through a regulated st
HYPE+0.24%
  • 3
  • 1
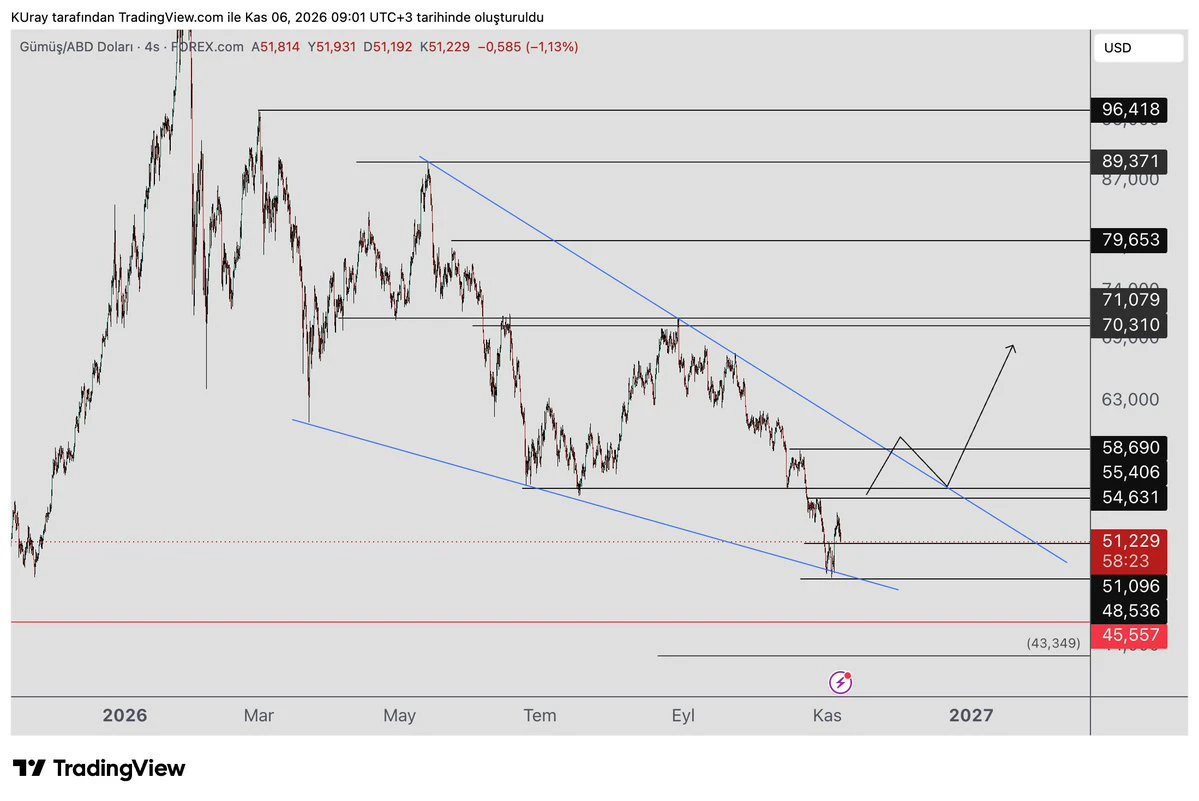
We are tracking the falling wedge forming in #xag #Gümüş . As long as it holds the 48.5 low, the wedge may still play out.
It broke through 51 resistance with volume and is now coming back to test the resistance it broke. The broken resistance may act as support. After the retest, it could rise toward 54-55 resistance.
If there is no close above the 54-55 zone, the decline could resume, indicating that the rise was a reaction to the downtrend.
If it closes above the 54-55 zone, the rise is expected to continue further.
After that, we will watch the 59 level. If it closes above, the upper edge
post-image
XAG+0.47%
🚨 BITCOIN & ETHEREUM ETFs SEE MASSIVE OUTFLOWS!
@BlackRock and other spot ETFs reportedly sold:
$430.2M worth of $BTC
$100M worth of $ETH
post-image
BTC-5.05%
ETH-7.19%
BLK-4.39%
This level once again tested the previous low from the early-morning drop without breaking it. Accumulation at the bottom continues, though there is still some pressure. Go long at the current price—bulls, charge with me!#美股史诗级抛售 #Gate首创资金安全证明
Anyone willing to buy gold in the 4063–4080 range is betting that the momentum from NFP night hasn’t faded yet. Gold has surged so hard that a pullback is an opportunity to get in. Set your stop at 4020; if it breaks, take the loss. As for sector rotation, safe-haven funds have indeed been shifting into precious metals lately. No need to rush to a conclusion—let’s see how things play out. If you’re watching, keep an eye on #Gold.
post-image
GLDX-0.40%
PAXG+0.37%
XAU+0.38%
  • 6
#美股史诗级抛售 #每周来晒 A $2.3 trillion overnight bloodbath! Nasdaq plunges the most since 2020—could the AI rally be about to change course? — Chip stocks are “slaughtered”: short-term deleveraging or the start of a deep correction?

November 5, 2026, is destined to go down in U.S. stock market history.

At the close that day, the Nasdaq Composite plunged 5.5% to 24315, officially entering correction territory; the Nasdaq 100 sank 6.4%, wiping out about $2.3 trillion in market value in a single day and marking its biggest one-day drop since March 2020. The S&P 500 fell 4.4% to a three-month low. The M
NVDA-9.33%
AMD-17.64%
SNDK-22.24%
INTC-10.58%
TSLA-10.84%
  • 5
BTC UPDATES
live-cover
LIVE2,072
Load More

Join 40 M users in our growing community

⚡️ Join 40 M users in the crypto craze discussion

💬 Engage with your favorite top creators

👍 See what interests you

Trending Topics

USStocksFaceHistoricSelloff

2.23k Views3.57k Discussing

U.S. stocks suffered a sharp selloff on Thursday, with the Nasdaq closing down more than 5% and the Philadelphia Semiconductor Index falling over 12%. AI and chip stocks including $NVDA and $AMD were hit especially hard. Markets are reassessing AI valuations, data-center spending and future returns. Is this just short-term deleveraging, or the start of a deeper correction in the AI trade? Which sectors are you watching next?

GateLaunchesPoSECProofOfSecurity

13.06k Views577 Discussing

USNonfarmPayrolls

11.25k Views4.01k Discussing

View More