Square
Following
Hot
News
Profile
Share your thoughts
placeholder
Article
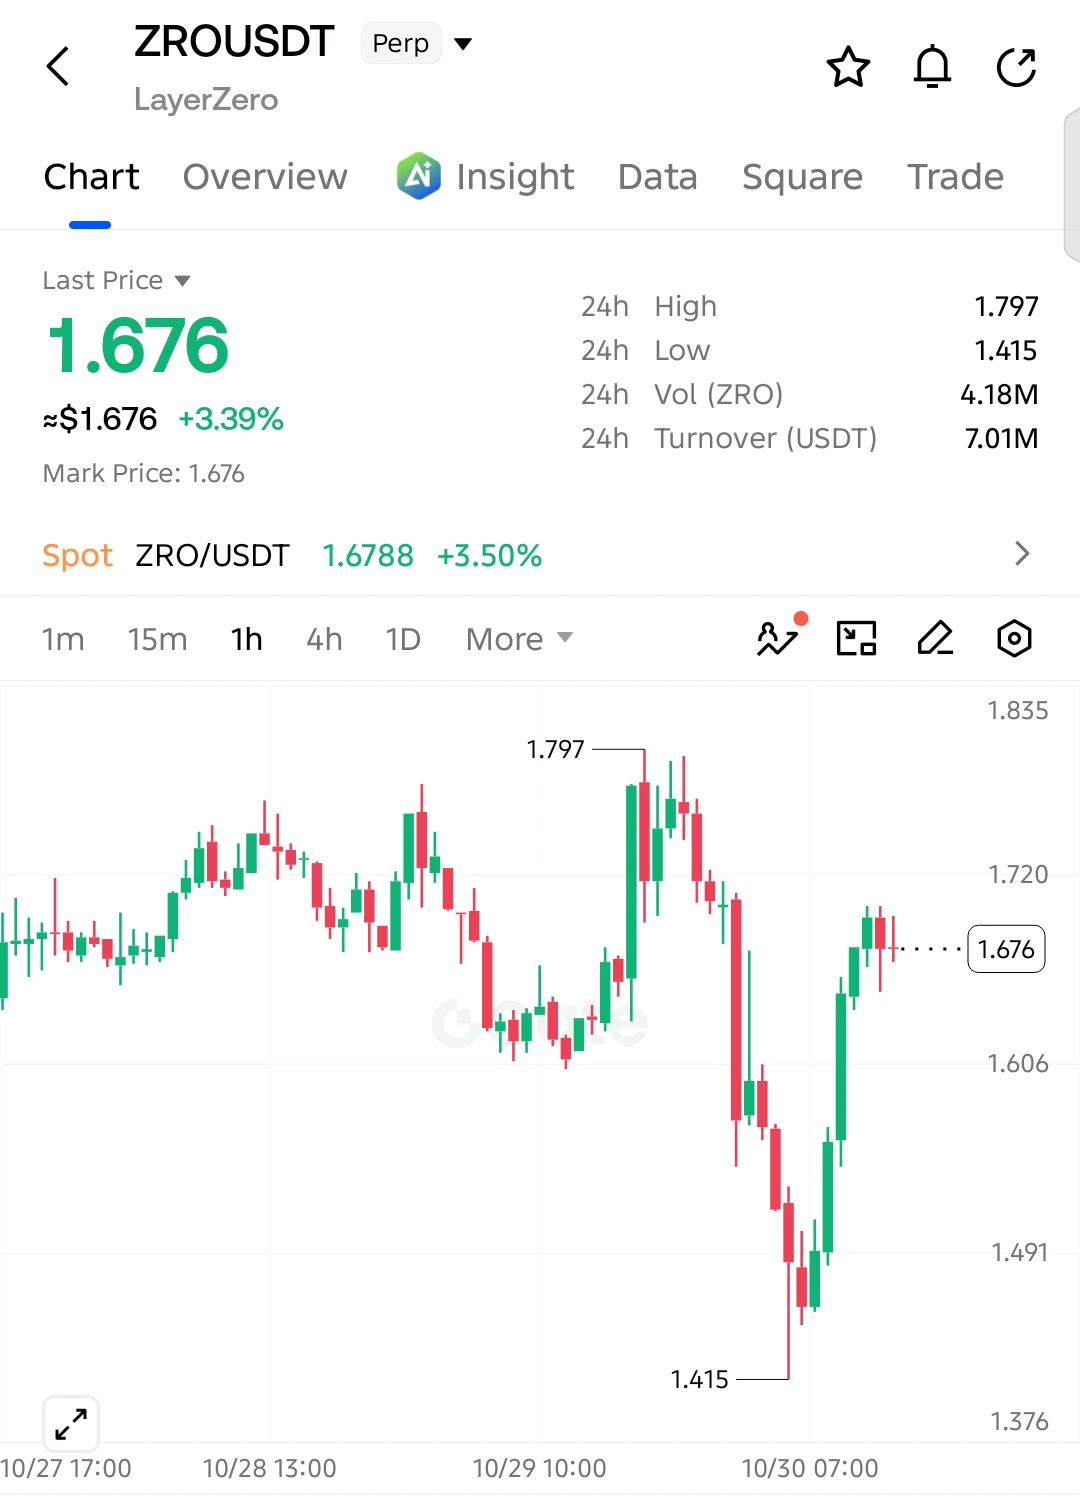
$ZRO LONG SETUP — BULLS ARE FIGHTING BACK!
$ZRO has made a strong recovery from 1.415, with buyers pushing the price back toward 1.70. The 1H chart shows impressive bullish momentum, and a confirmed breakout above 1.72 could open the door for another move toward the recent high.
Entry: 1.676
SL: 1.625
TP1: 1.720
TP2: 1.755
TP3: 1.797
Extended Target: 1.850
The bullish setup remains valid above 1.625. Buyers need to reclaim 1.72 to confirm further upside momentum. A breakdown below support would weaken the recovery structure.
Can $ZRO break 1.72 and push toward 1.80?
post-image
ZRO-2.59%
  • 1
  • 1
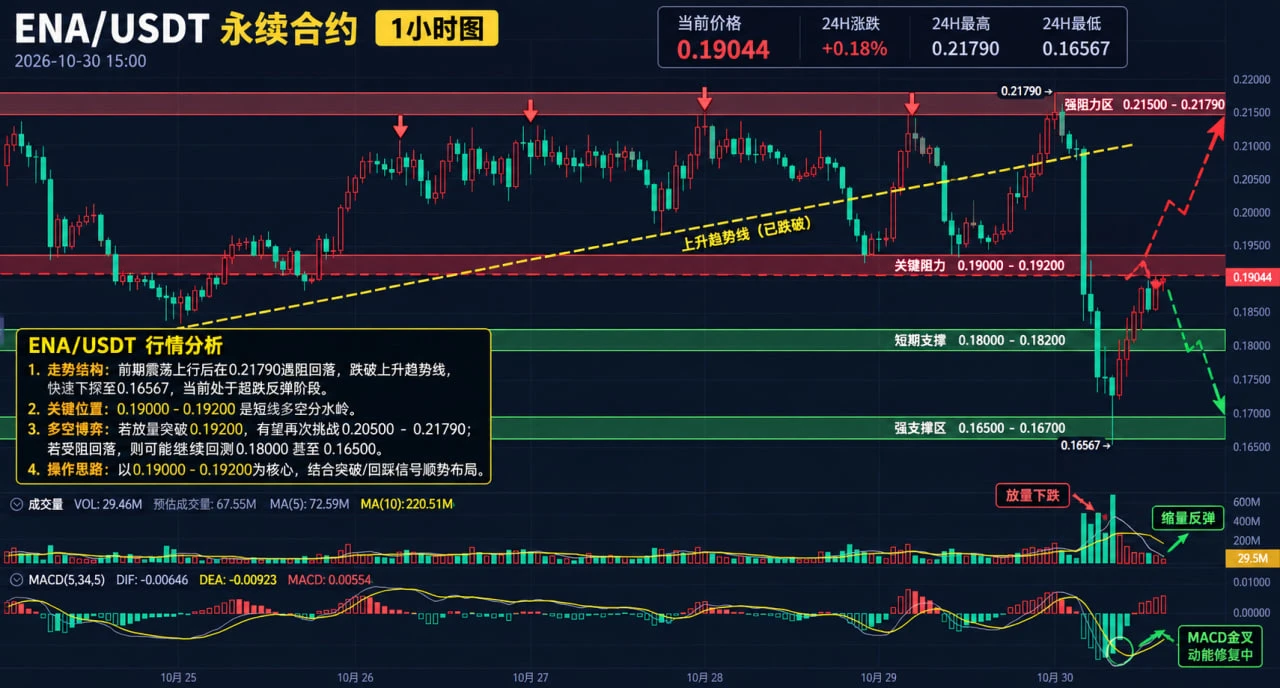
October 30 Contract Strategy $ENA
Direction: Oversold rebound play
Initial position: 0.187 - 0.189
Take profit: 0.205 - 0.217
Entry rationale: The selling pressure from the hacker’s 217.5 million tokens has been cleared, and whales are buying the dip and opening long positions; short liquidations are concentrated above 0.205-0.22, while a 1H bullish divergence is resolving and driving a rebound. #BTC跌至7.7万美元
post-image
ENA+8.12%
  • 3
  • 2
Trenches
BNCB
B
bade
b
BNCB
0x49...ec3f
Market Cap
$.
Change
.
24h Vol
$.
Holders
.
ENA
E
bade
b
ENA
0x57...6061
Market Cap
$.
Change
.
24h Vol
$.
Holders
.
PEPE
P
bade
b
PEPE
0x69...1933
Market Cap
$.
Change
.
24h Vol
$.
Holders
.
GTA6
G
bade
b
GTA6
4kjr...zDnz
Market Cap
$.
Change
.
24h Vol
$.
Holders
.
XDP
X
bade
b
XDP
0x07...91d0
Market Cap
$.
Change
.
24h Vol
$.
Holders
.
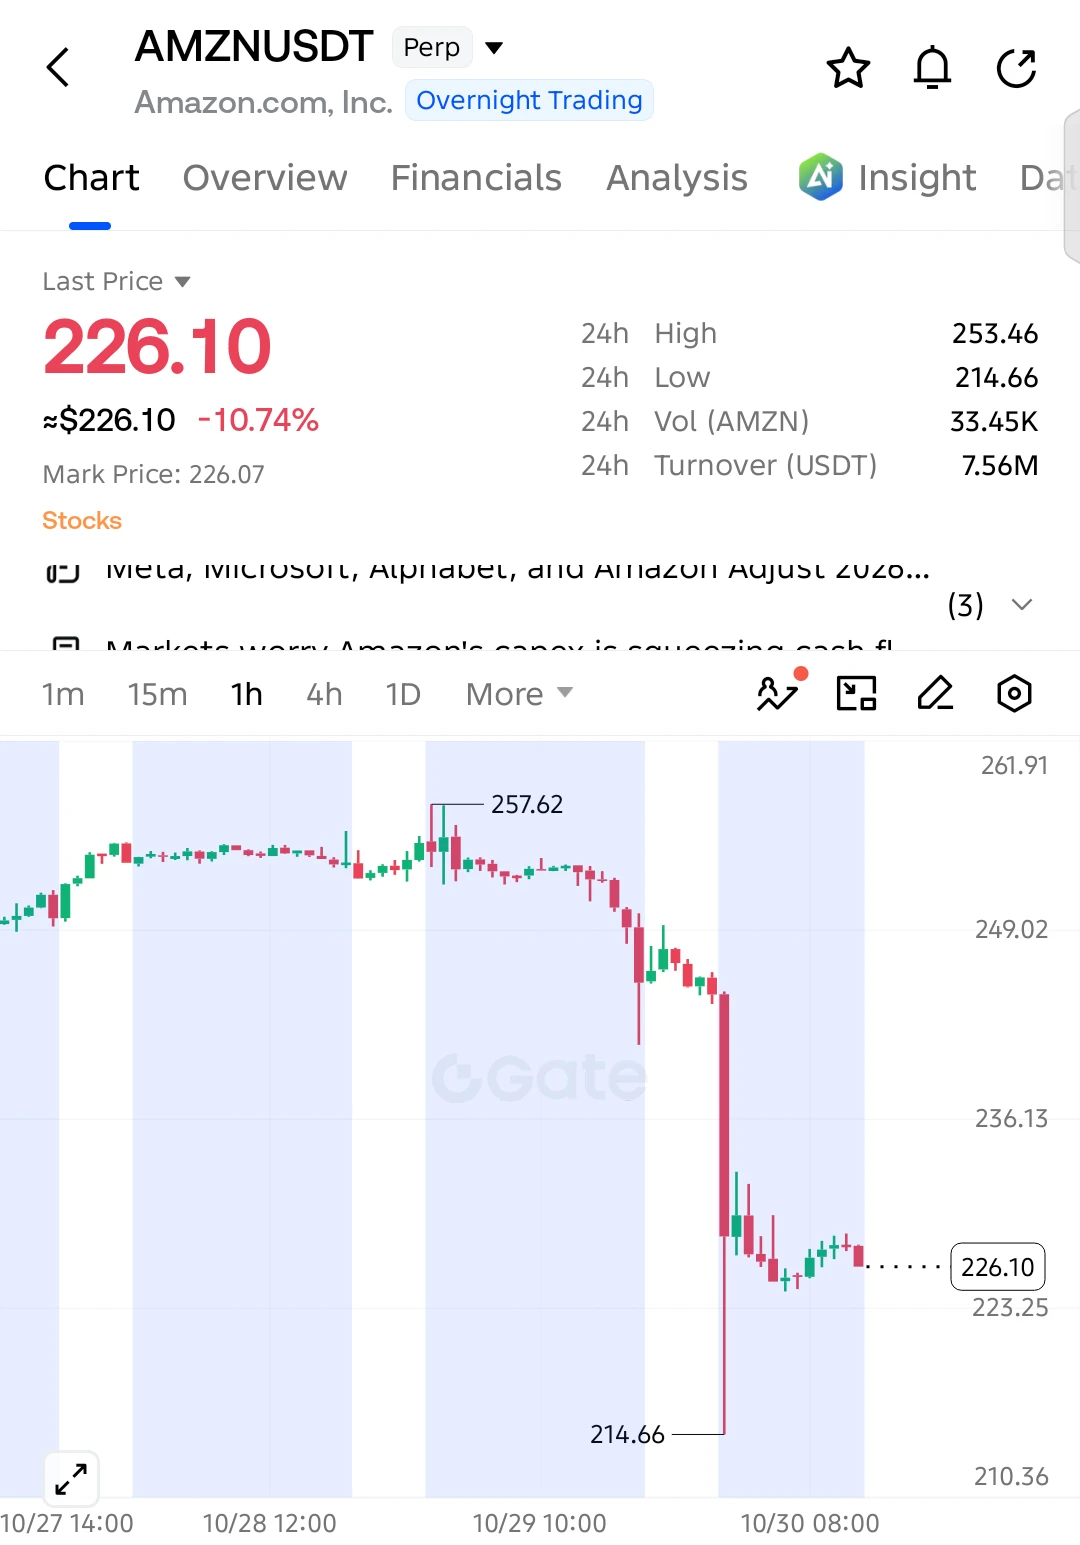
$AMZN SHORT SETUP — SELLERS REMAIN IN CONTROL!
$AMZN has dropped over 10% in the last 24 hours, breaking below its previous support and forming a clear bearish structure on the 1H chart. Price is now consolidating near 226 after a sharp sell-off, and another breakdown could extend the downside.
Entry: 226.10
SL: 231.50
TP1: 223.25
TP2: 219.50
TP3: 214.66
Extended Target: 210.50
The bearish setup remains valid below 231.50. A confirmed break below 223.25 could accelerate selling toward the recent low at 214.66, while a recovery above resistance would weaken the short setup.
Will $AMZN continue
post-image
AMZN+0.23%
  • 2
  • 1
Returning User Rewards: Get 100 USDT on Return and Trade to Earn Up to 800 SUI https://www.gate.com/campaigns/6799?ref=VLARBF1YAG&ref_type=132
post-image
SUI-1.05%
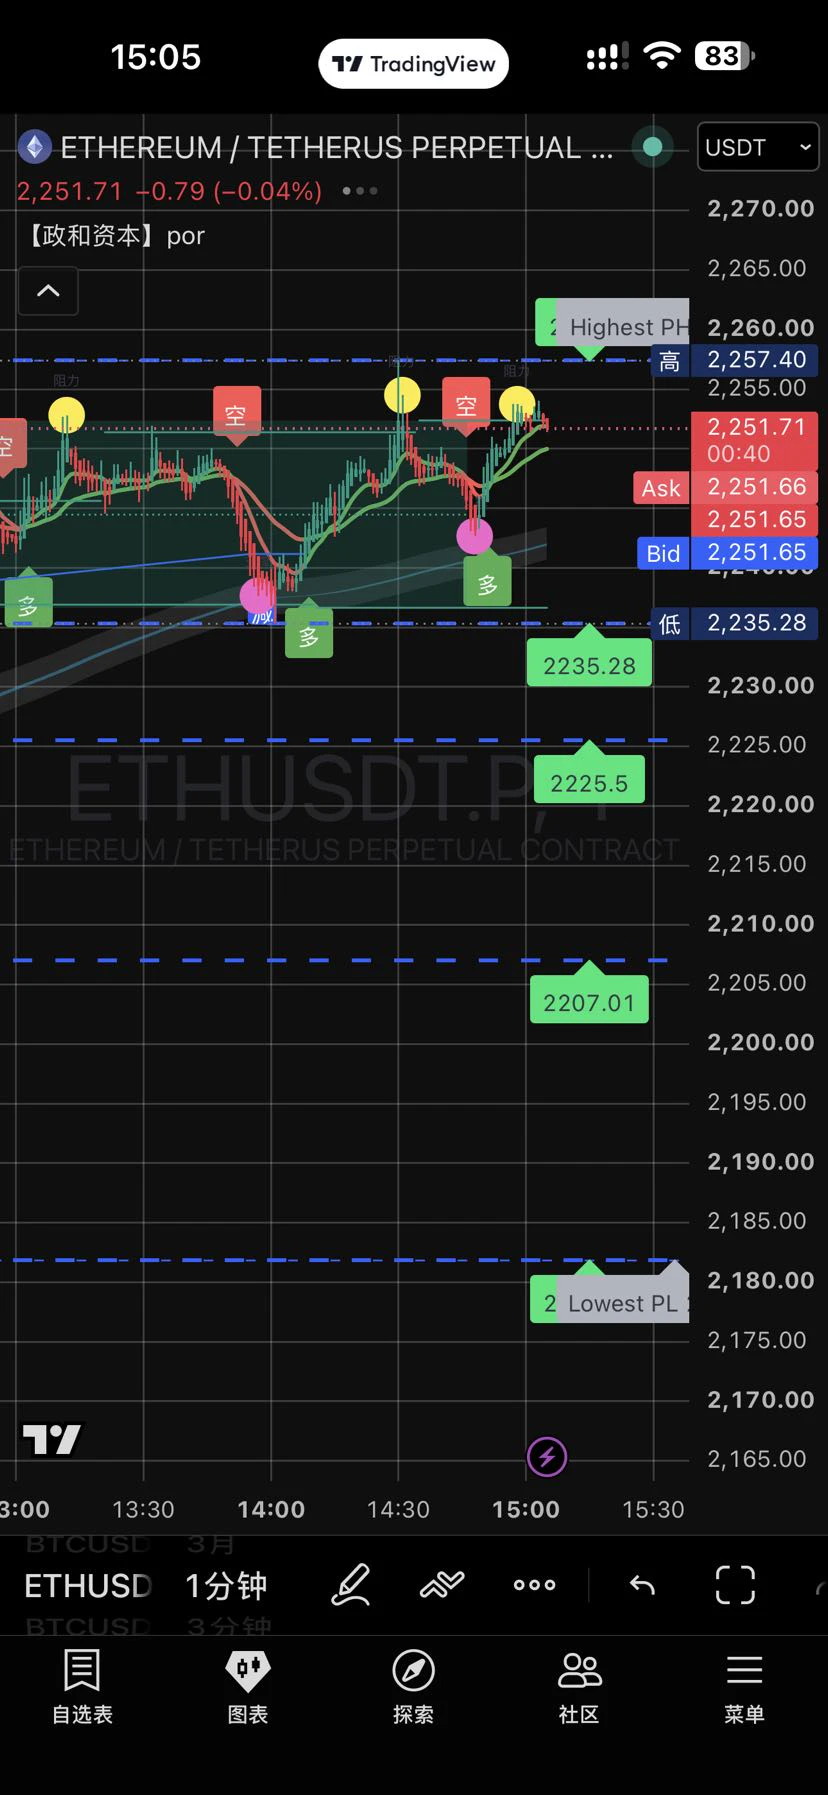
Today’s ETH Market Outlook: A Trend Down, Not a Routine Pullback

Unlike BTC, which was hit by a sudden event, ETH’s weakness today is the result of structural pressure and multiple bearish factors converging. As of October 30, ETH was trading around $2,200–$2,250, with its 24-hour decline at one point exceeding 7%. Technicals have confirmed a break below several key defenses:‌
• The lower boundary of the daily ascending channel has been decisively breached, and the short-term moving averages (7-day 2,346, 20-day 2,412, 50-day 2,532) are in a standard bearish alignment, with price under broa
post-image
ETH-1.23%
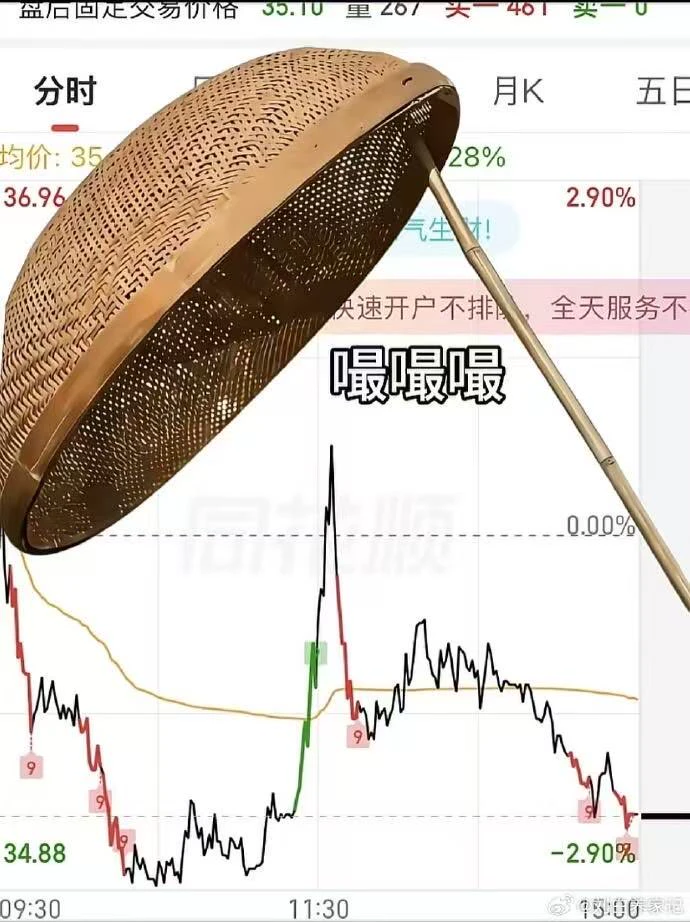
A-shares finished pumping, and I got fooled again
But
…
…
…
…
…
…
The good news is that October can't possibly fall any further
post-image
“So your Coldcard was hacked in July?”
“Yes.”
“And Liquid was hacked in September?”
“Yeah.”
“And your Ledger was hacked in October?”
“Yes, Dave.”
“And yesterday the largest crypto exchange in the world had the biggest hack in history?”
“Yes, that’s right.”
“And you’re still buying bitcoin?”
“That is correct, Dave.”
BTC-0.67%
Do gains and losses in percentage terms cancel each other out, leaving you back where you started?
When reviewing returns, I calculate them step by step based on the amount of capital, rather than adding several percentage changes directly.
Take a hypothetical example: $1,000 rises by 20% to $1,200; then it falls by 20%, leaving $960. The two percentages look like one gain and one loss, but the capital is actually $40 below where it started.
That’s because the second change is calculated on $1,200, so the base has already changed.
This also reminds me that when a record says “average earnings
post-image
Gate live Halloween 🎃 Candy challenge carnival week
live-cover
LIVE2,029
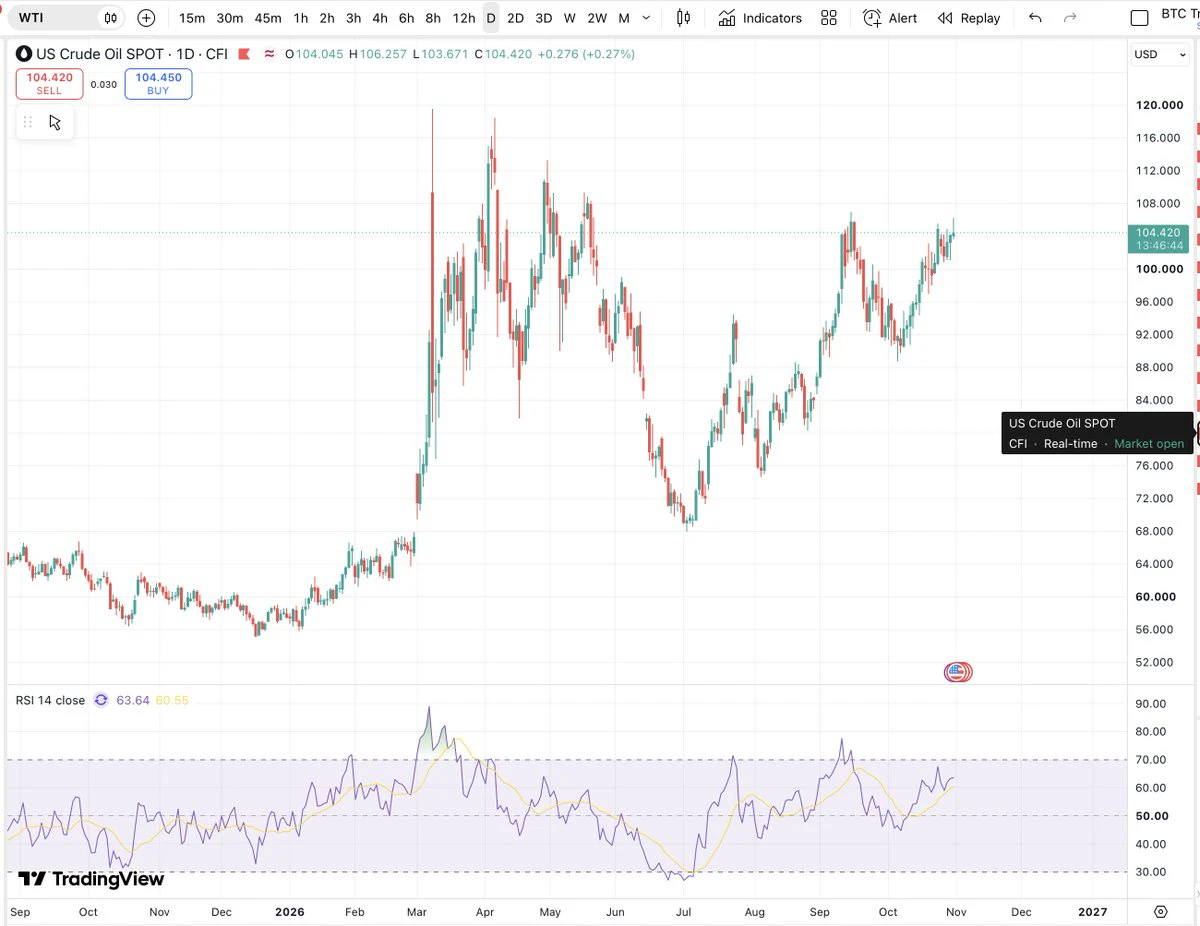
#OIL pushing higher again, adding another potential headwind for #BTC and #Crypto.
Sustained strength in energy prices risks keeping #inflation elevated and delaying monetary easing, weighing on risk appetite.
One pressure among several, rather than a direct explanation for every crypto dip.
post-image
BTC-0.67%
gogogogo
Follow gold, double your account in a week
post-image
GLDX-0.40%
PAXG+0.37%
XAU+0.38%
Looking back, it’s always easy to buy at the right time. Why is live trading different?
When you look at a chart after the fact, the highs and lows are clear. It’s easy to think: Why not just buy here and sell there?
But when I review a trade, I first cover up the part of the chart that hasn’t happened yet, then ask myself: If I’d only seen this much, would I really have made the same decision?
For example, if the rules require waiting for a candlestick to close before confirming a signal, I can’t use its final closing information in hindsight and also assume I got filled early at an ideal pri
post-image
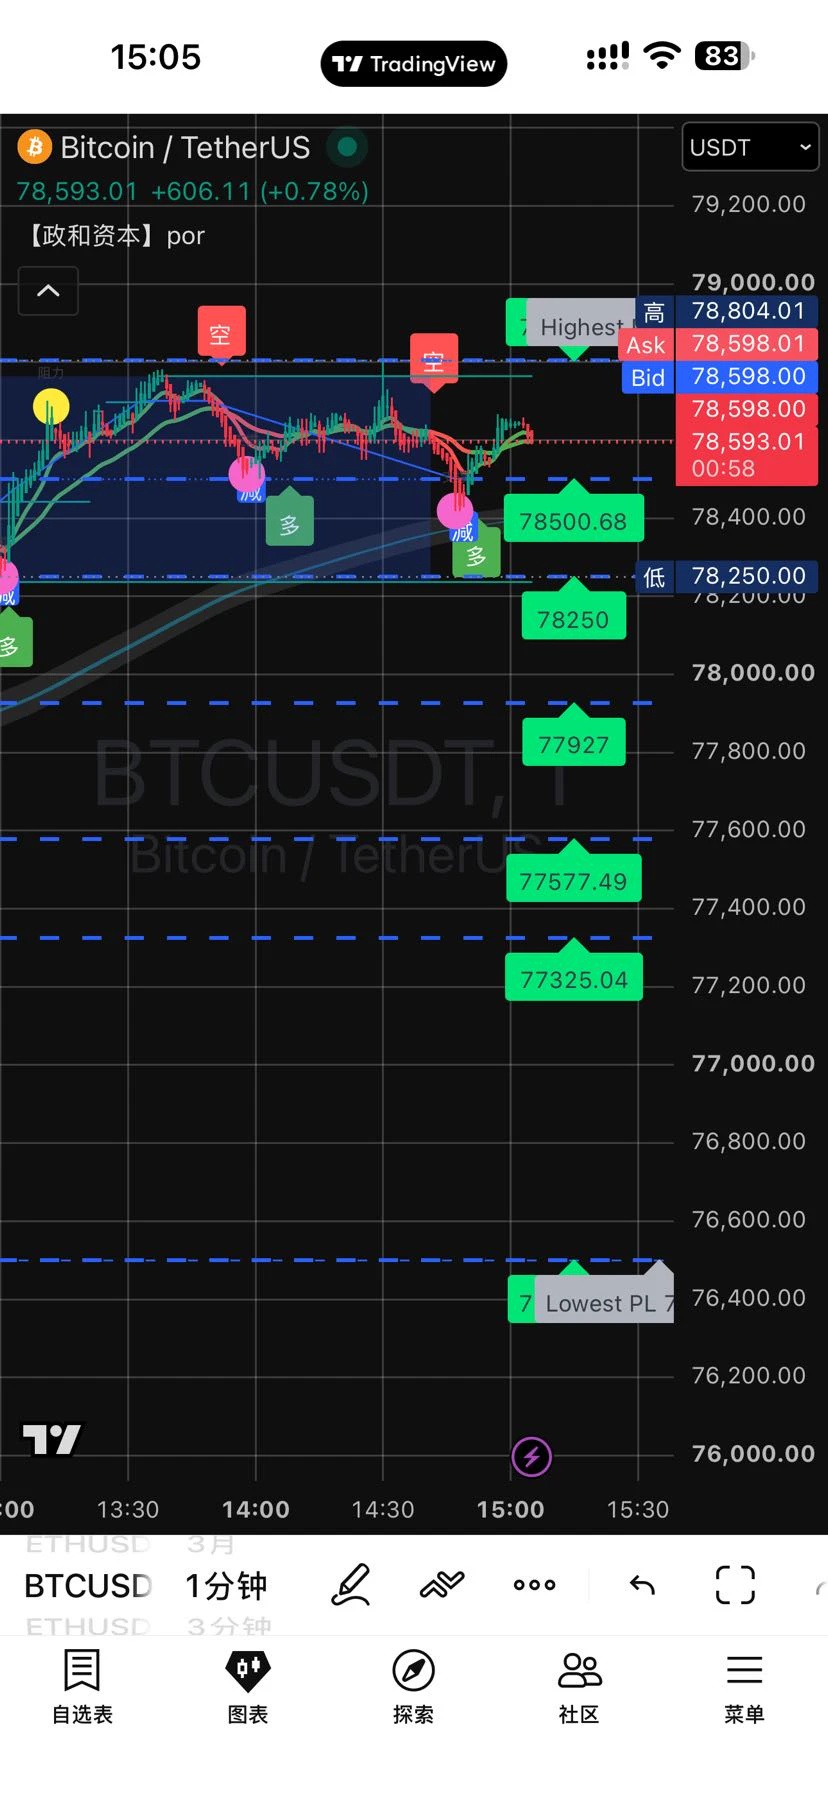
October 30, 2026 (Friday) BTC Futures Analysis and Strategy (as of around 00:05 PDT / corresponding HKT time)
Current Market Overview
BTC is currently trading in the $77,300–$78,500 range, with 24-hour fluctuations of around ±2–4%. After Friday’s open, the price fell sharply from around $81,000 yesterday and is now testing the $78,000 level. In the short term, it remains below most medium- and short-term moving averages.
After a sustained decline from around $84,500, the price accelerated downward, and the short-term structure has weakened significantly. Expectations for Federal Reserve policy
post-image
BTC-0.65%
  • 2
🔹Intel Plunges Over 17 After Hours! Both Earnings and Guidance Disappoint. Is Another Wave of Selli
live-cover
LIVE1,730
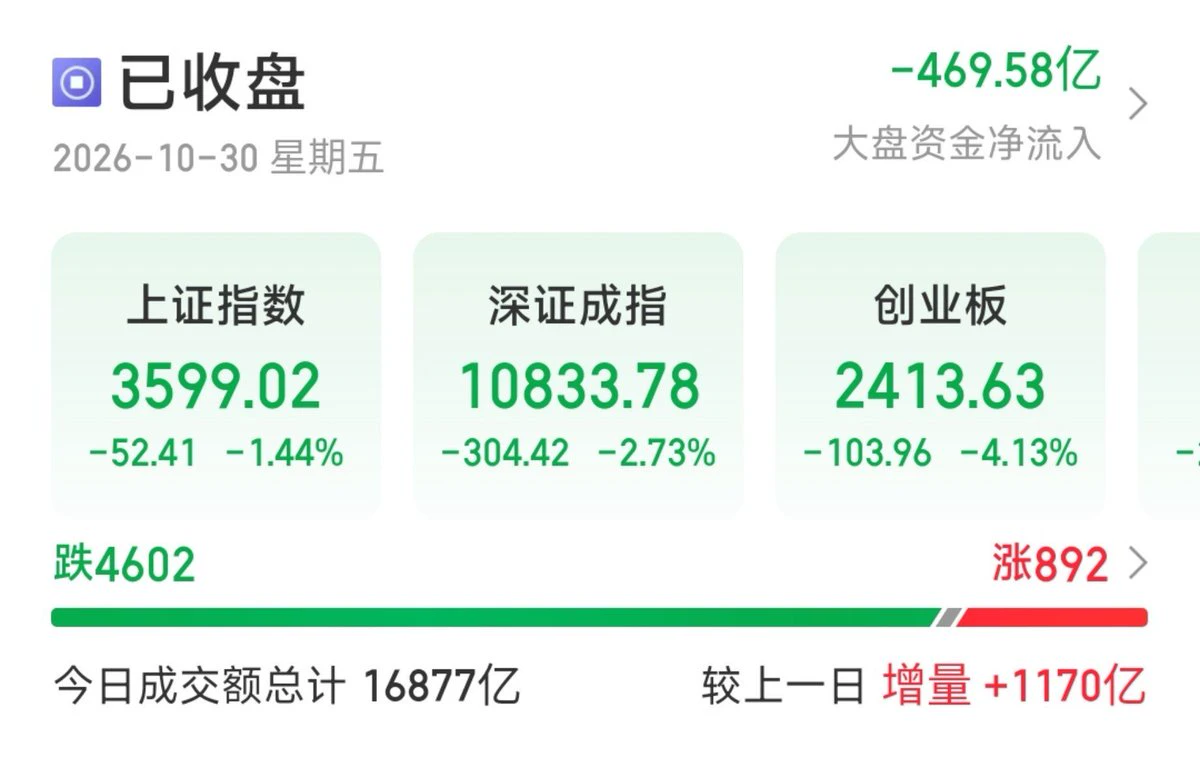
The ChiNext has been cut in half over the past 4 months, down 45%—a textbook case of “falling when others rise and falling harder when others fall”: it drops when U.S. stocks rise and plunges when they fall.
Today it sold off sharply on heavy volume, with the ChiNext Index plunging 4.13% and nearly 4,700 stocks declining.
Now that U.S. stocks are starting to pull back, don’t rush to buy the dip in “Mian A.”
Don’t just assume it’s cheap because it has fallen so much. In this kind of downtrend, once U.S. stocks finish falling, you’ll most likely have bought in halfway down.
Keep your hands off;
post-image
$PTB Quit pretending and hurry up and get down here
post-image
PTB-12.55%
  • 2
Gram chart its not true & not fair... my SL 1,1111 , hellooo market maker.
GRAM-0.97%
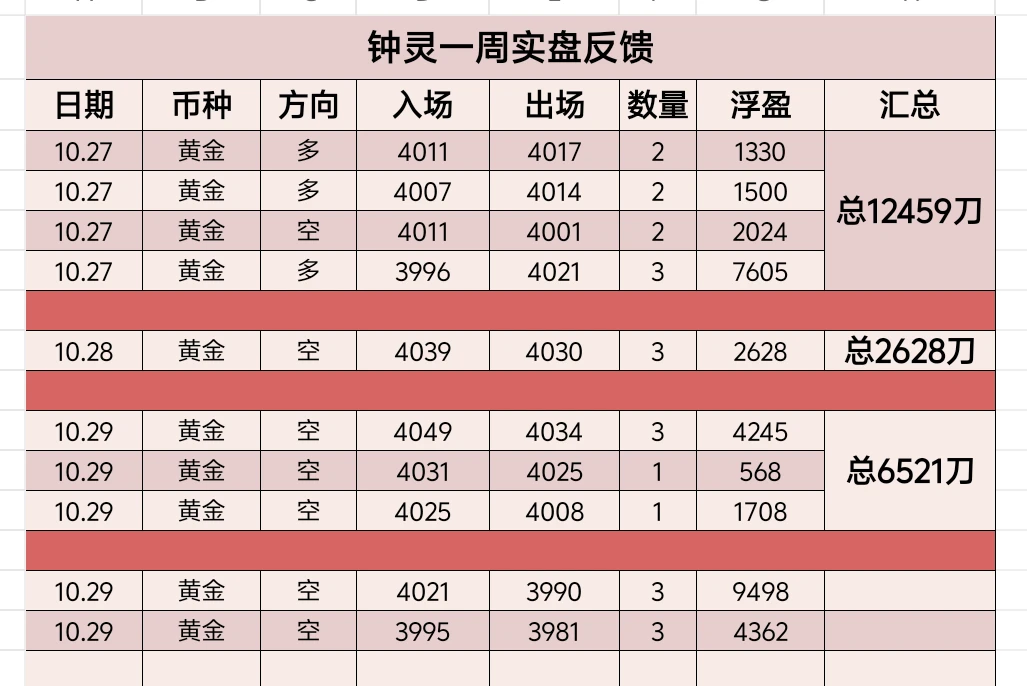
Just short the rebound—how could you not make money in this market? Went short decisively at 3995, caught a 14-point move, and pocketed $4362!
$XAU $BTC #英特尔财报超预期股价却暴跌 #Strategy优先股回归100美元面值 #Gate24小时净流入Top2 #美联储继续按兵不动
post-image
XAU+0.38%
BTC-0.65%
Intel's earnings clearly beat expectations, yet its stock plunged 23%! What exactly is Wall Street afraid of?
These days, a publicly traded company can make money without its stock rising, and getting top marks doesn't necessarily earn you a reward. Intel just gave the market a real-world lesson in investing: third-quarter revenue was $16.51 billion, up 21% year over year, and adjusted earnings per share were $0.52, beating market expectations. Yet its stock plunged as much as about 23% in after-hours trading!
Where did things go wrong? The answer lies in next quarter's report card.
Intel expe
INTC-3.60%
GOOG-12.46%
  • 20
Load More

Join 40 M users in our growing community

⚡️ Join 40 M users in the crypto craze discussion

💬 Engage with your favorite top creators

👍 See what interests you

Trending Topics

BTCDropsToward77000

70.31k Views39.22k Discussing

$BTC briefly fell below $77,000 and remains under pressure around the $77K zone, with its 24-hour decline still above 4%. With risk appetite weakening and Fed uncertainty rising, where is the next key support after losing $80K?

IntelBeatsEarningsButStockPlunges

4.58k Views589 Discussing

StrategySTRCNears100ParValue

5.79k Views3.97k Discussing

View More