
























#美联储继续按兵不动 #中期选举 US stocks plunge as midterm elections approach: What will November bring?
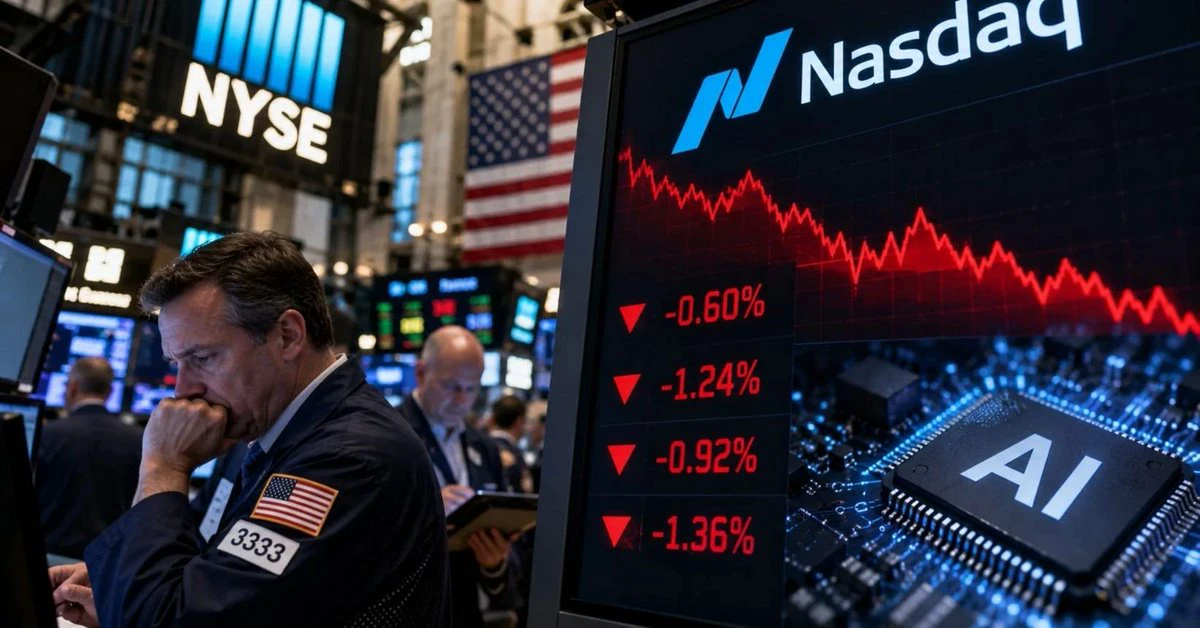
In the final two trading days of October, the US stock market was suddenly hit by a sharp sell-off. On October 30, the Nasdaq fell 2.86% in a single day, the S&P 500 fell 1.82%, and the Dow Jones fell 1.09%. The Nasdaq not only posted its biggest single-day loss since June, but also fell 5.3% over October as a whole, its worst monthly performance since March 2025.
The sell-off was triggered by earnings from tech giants. Alphabet, Google's parent company, and Amazon failed to fully meet market expectations, while Intel shares plunged nearly 29% in a single day after the company issued a weak earnings outlook. Investors began revisiting a key question: When will the hundreds of billions of dollars in capital invested in AI actually translate into profits?
Just as market sentiment was cooling noticeably, another major event was drawing near: the US midterm elections on November 3. This adds a political variable to the US stock market outlook for November. Interestingly, historical data offers a relatively optimistic signal: stocks have performed better than expected in November of US election years. On one side, tech stocks are tumbling and the AI investment thesis is being tested; on the other, history points to relatively strong post-election performance. So will US stocks continue their recent pullback in November 2026, or could clarity around the election results help spark a rebound? Will the historical pattern repeat this time?
I. Historically, US stocks have often performed better after midterm elections
According to research published by JPMorgan on October 7, 2026, the S&P 500 has posted positive returns in the 12 months after every US midterm election since 1950. The average gain in the 12 months after an election is about 15%. The average return in the fourth quarter of midterm election years is about 6.6%. Data from Hartford Funds also shows that since 1950, the S&P 500 has gained an average of about 15.17% in the year after midterm elections, compared with an average gain of about 7.30% in other years. This suggests that historical data does reveal a fairly clear pattern: markets tend to be affected by political uncertainty before elections, while a relatively strong period often follows once the elections are over.
II. Why do US stocks tend to rise after midterm elections?
There are three main reasons.
1. Political uncertainty declines. One of the things markets dislike most is uncertainty.
Before an election, investors have to consider: Will control of Congress change? Will new tax policies be introduced? Will government spending be adjusted? Will the tech industry face stricter regulation?
Once the election results are announced, some policy expectations gradually become clearer, allowing investors to reassess corporate earnings and the economic outlook.
2. A divided Congress may bring policy stability
A typical feature of US midterm elections is that the president's party often loses seats in congressional elections. If the two parties control the White House and Congress separately, major legislation may be harder to advance. This may appear to hinder policymaking, but for capital markets it also means a lower likelihood of sudden major policy changes. However, this does not mean that a divided Congress is necessarily good for stocks.
3. Markets refocus on economic fundamentals
After the election, market attention typically returns to: Federal Reserve interest rate policy, inflation trends, corporate earnings, returns on AI investment, and US employment and consumer data. These factors are what determine the core of the US stock market's performance over the medium to long term.
III. What is unusual about the 2026 midterm elections?
The US midterm elections will be held on November 3, 2026.
This election will involve: all 435 seats in the House of Representatives; 35 Senate seats; and gubernatorial elections in 39 states and territories.
The market is particularly focused on whether Democrats can regain control of the House of Representatives. According to a Reuters report on October 30, investors are also closely watching returns on AI investment, tech giant earnings, and employment data, in addition to the midterm elections. This means that the US stock market in 2026 faces multiple variables, not just the election.
IV. A note of caution: Historical patterns do not guarantee future gains
There is a point here that merits deeper analysis. Research published by BlackRock in October 2026 noted that US stocks have historically performed relatively weakly in midterm election years. But in the six months after an election, the S&P 500 has gained an average of 14.1%, compared with an average gain of 5.7% over the same period in non-midterm election years. However, historical patterns cannot be directly translated into future investment returns.
In particular, US stocks face several challenges in 2026: AI capital spending continues to grow, but whether returns on investment will materialize remains disputed. Tech giants are highly valued, and the market is becoming less tolerant of earnings disappointments. Federal Reserve monetary policy remains an important factor affecting markets. If the election results fuel new expectations for trade, fiscal, or regulatory policies, markets could see sharp volatility. $NAS100
In the final two trading days of October, the US stock market was suddenly hit by a sharp sell-off. On October 30, the Nasdaq fell 2.86% in a single day, the S&P 500 fell 1.82%, and the Dow Jones fell 1.09%. The Nasdaq not only posted its biggest single-day loss since June, but also fell 5.3% over October as a whole, its worst monthly performance since March 2025.
The sell-off was triggered by earnings from tech giants. Alphabet, Google's parent company, and Amazon failed to fully meet market expectations, while Intel shares plunged nearly 29% in a single day after the company issued a weak earnings outlook. Investors began revisiting a key question: When will the hundreds of billions of dollars in capital invested in AI actually translate into profits?
Just as market sentiment was cooling noticeably, another major event was drawing near: the US midterm elections on November 3. This adds a political variable to the US stock market outlook for November. Interestingly, historical data offers a relatively optimistic signal: stocks have performed better than expected in November of US election years. On one side, tech stocks are tumbling and the AI investment thesis is being tested; on the other, history points to relatively strong post-election performance. So will US stocks continue their recent pullback in November 2026, or could clarity around the election results help spark a rebound? Will the historical pattern repeat this time?
I. Historically, US stocks have often performed better after midterm elections
According to research published by JPMorgan on October 7, 2026, the S&P 500 has posted positive returns in the 12 months after every US midterm election since 1950. The average gain in the 12 months after an election is about 15%. The average return in the fourth quarter of midterm election years is about 6.6%. Data from Hartford Funds also shows that since 1950, the S&P 500 has gained an average of about 15.17% in the year after midterm elections, compared with an average gain of about 7.30% in other years. This suggests that historical data does reveal a fairly clear pattern: markets tend to be affected by political uncertainty before elections, while a relatively strong period often follows once the elections are over.
II. Why do US stocks tend to rise after midterm elections?
There are three main reasons.
1. Political uncertainty declines. One of the things markets dislike most is uncertainty.
Before an election, investors have to consider: Will control of Congress change? Will new tax policies be introduced? Will government spending be adjusted? Will the tech industry face stricter regulation?
Once the election results are announced, some policy expectations gradually become clearer, allowing investors to reassess corporate earnings and the economic outlook.
2. A divided Congress may bring policy stability
A typical feature of US midterm elections is that the president's party often loses seats in congressional elections. If the two parties control the White House and Congress separately, major legislation may be harder to advance. This may appear to hinder policymaking, but for capital markets it also means a lower likelihood of sudden major policy changes. However, this does not mean that a divided Congress is necessarily good for stocks.
3. Markets refocus on economic fundamentals
After the election, market attention typically returns to: Federal Reserve interest rate policy, inflation trends, corporate earnings, returns on AI investment, and US employment and consumer data. These factors are what determine the core of the US stock market's performance over the medium to long term.
III. What is unusual about the 2026 midterm elections?
The US midterm elections will be held on November 3, 2026.
This election will involve: all 435 seats in the House of Representatives; 35 Senate seats; and gubernatorial elections in 39 states and territories.
The market is particularly focused on whether Democrats can regain control of the House of Representatives. According to a Reuters report on October 30, investors are also closely watching returns on AI investment, tech giant earnings, and employment data, in addition to the midterm elections. This means that the US stock market in 2026 faces multiple variables, not just the election.
IV. A note of caution: Historical patterns do not guarantee future gains
There is a point here that merits deeper analysis. Research published by BlackRock in October 2026 noted that US stocks have historically performed relatively weakly in midterm election years. But in the six months after an election, the S&P 500 has gained an average of 14.1%, compared with an average gain of 5.7% over the same period in non-midterm election years. However, historical patterns cannot be directly translated into future investment returns.
In particular, US stocks face several challenges in 2026: AI capital spending continues to grow, but whether returns on investment will materialize remains disputed. Tech giants are highly valued, and the market is becoming less tolerant of earnings disappointments. Federal Reserve monetary policy remains an important factor affecting markets. If the election results fuel new expectations for trade, fiscal, or regulatory policies, markets could see sharp volatility. $NAS100

