Futures
Access hundreds of perpetual contracts
CFD
Gold
One platform for global traditional assets
Options
Hot
Trade European-style vanilla options
Unified Account
Maximize your capital efficiency
Demo Trading
Introduction to Futures Trading
Learn the basics of futures trading
Futures Events
Join events to earn rewards
Demo Trading
Use virtual funds to practice risk-free trading
CFD
U.S. stock CFD derivatives
US Stocks
Access real US stocks and ETFs
HK Stocks
Trade quality Hong Kong-listed stocks
Stock Futures
High leverage, 24/7 trading
Tokenized Stocks
Backed by real stock assets
IPO Access
Unlock full access to global stock IPOs
GUSD
Mint GUSD for Treasury RWA yields
Stocks Activities
Trade Popular Stocks and Unlock Generous Airdrops
Launch
CandyDrop
Collect candies to earn airdrops
Launchpool
Quick staking, earn potential new tokens
HODLer Airdrop
Hold GT and get massive airdrops for free
IPO Access
Unlock full access to global stock IPOs
Alpha Points
Trade on-chain assets and earn airdrops
Futures Points
Earn futures points and claim airdrop rewards
Promotions
AI
Gate AI
Your all-in-one conversational AI partner
Gate AI Bot
Use Gate AI directly in your social App
GateClaw
Gate Blue Lobster, ready to go
Gate for AI Agent
AI infrastructure, Gate MCP, Skills, and CLI
Gate Skills Hub
10K+ Skills
From office tasks to trading, the all-in-one skill hub makes AI even more useful.
Ethereum Q1 2026: Fees Drop, Users and Transaction Volume Reach New All-Time Highs
Author: Token Terminal; Translation: Peggy, BlockBeats
This Token Terminal Ethereum Q1 2026 report presents a set of seemingly contradictory yet crucial data: the number of Ethereum mainnet users, transaction count, and throughput all hit record highs, but transaction fees, TVL, trading volume, and fully diluted market cap all declined quarter-over-quarter.
Ethereum is actively entering a "lower fees for greater scale" phase. As Fusaka upgrades increase data capacity, block space becomes cheaper, and user and transaction growth begin to accelerate, but short-term fee capture is suppressed. The report explains this phenomenon as Jevons' paradox: when usage costs decrease, network demand may be further unleashed.
More notably, Ethereum's core narrative is shifting from a DeFi public chain to a global financial settlement layer. The report shows that Ethereum still dominates tokenized assets: stablecoins, tokenized funds, tokenized commodities, and tokenized stocks are all scaling on its platform, with particularly strong growth in funds and gold assets. The continued entry of institutions like BlackRock, JPMorgan, and Fidelity also pushes "institutional on-chain" from concept to product issuance and settlement practice.
The core value of this report is not to predict short-term ETH price movements but to demonstrate Ethereum’s structural position as financial infrastructure: it sacrifices short-term fee capture through expansion while trying to solidify its network effects in stablecoins, tokenized funds, on-chain credit, and institutional settlement. For investors and industry observers, the key question is: as more financial assets move on-chain, who will become the default settlement layer, and how will this settlement demand ultimately translate into ETH’s value capture?
Below is the original text:
Ethereum ($ETH) is a public, permissionless blockchain providing global settlement and computing power for financial applications in an open economy. It runs a shared ledger that anyone can build on, with no single party able to shut it down, and uses its native asset ETH to pay transaction fees; simultaneously, ETH is staked to secure the network.
The activities on Ethereum have historically been limited by traditional financial infrastructure costs and throughput: settlement takes days, with multiple intermediaries, each with counterparty risk. Tokenization and stablecoins are on-chain solutions addressing these frictions. As their regulatory frameworks mature from 2025 into 2026, institutional-level on-chain activity is transitioning from theory to reality.
Ethereum’s role in this shift is as the base settlement layer. Stablecoins, tokenized funds, tokenized commodities, and increasingly tokenized stocks are issued and settled on Ethereum; layer-2 networks extend throughput and settle back to layer 1. ETH, as the asset backing and paying for this settlement, accrues value, while the staking market reflects how much ETH is committed to this role.
Market positioning-wise, Ethereum remains the largest platform for tokenized assets. Across cross-chain metrics, Ethereum holds the majority share in stablecoins, tokenized funds, commodities, and stocks. Ethereum is driven by the Ethereum Foundation and a broad, independent community of client teams and researchers; meanwhile, institutions like Etherealize help traditional finance better understand this network.
The first quarter of 2026 can be clearly divided into two main themes. On one hand, usage hits record highs: monthly active users, transaction count, and throughput all set new records. On the other hand, dollar-denominated value and fee metrics show compression: fully diluted market cap, total value locked, trading volume, and two fee metrics all declined quarter-over-quarter. Key events shaping this quarter impacted both themes: the second Blob Parameters Only (BPO #2) fork during Fusaka upgrade in January increased data capacity; ERC-8004 launched on mainnet in February, establishing AI agent identity and reputation standards; the Ethereum Foundation outlined its 2026 Protocol Cluster priorities—scaling, user experience, and layer-1 strengthening; additionally, events like the March Institutional Ethereum Forum reflect increased institutional participation.
Key Metrics (Q1 2026)
Total Lock Value (TVL): $316.2 billion (QoQ -11.0%, YoY +22.8%)
Active Loans: $21.8 billion (QoQ -16.6%, YoY +39.0%)
Trading Volume: $134.5 billion (QoQ -24.0%, YoY -31.2%)
Fees: $2.0 billion (QoQ -16.9%, YoY -7.8%)
Tokenized Asset Market Cap: $203.4 billion (QoQ -0.7%, YoY +42.9%)
Stablecoins: $178.9 billion (QoQ -2.3%, YoY +37.6%)
Tokenized Funds: $19.4 billion (QoQ +4.9%, YoY +73.1%)
Tokenized Commodities: $4.7 billion (QoQ +60.0%, YoY +325.9%)
Tokenized Stocks: $365.1 million (QoQ +16.5%)
Monthly Active Users: 13.2 million (QoQ +53.5%, YoY +85.9%)
Transaction Count: 200.4 million (QoQ +38.0%, YoY +81.5%)
Transactions per Second: 25.78 (QoQ +41.2%, YoY +81.7%)
Fees Paid: $39.9 million (QoQ -47.9%, YoY -81.9%)
Fully Diluted Market Cap: $290 billion (QoQ -30.3%, YoY -9.9%)
Staking Ratio: 0.31x (QoQ +0.03x, YoY +0.03x)
Token Holders: 292.8 million (QoQ +8.1%, YoY +24.9%)
This report covers Ethereum Layer 1, i.e., the mainnet. Layer-2 networks are considered separate chains and are not included in Ethereum’s data.
Total Value Locked (TVL) measures the on-chain deposit value across applications within a project, serving as a leading indicator for income-generating activities like lending, trading, and staking. It reflects the capital deposited within the Ethereum ecosystem, which depositors can typically withdraw at any time.
In Q1 2026, the average TVL was $316.2 billion, down 11.0% QoQ but up 22.8% YoY. The quarterly decline aligns with overall asset price retracement, while the annual increase indicates the Ethereum ecosystem has still expanded significantly compared to a year ago.
Among the top five chains, Ethereum leads with $316.2 billion, surpassing Tron ($84.5 billion), Solana ($28.8 billion), BNB Chain ($10.3 billion), and Plasma ($5.7 billion), accounting for 71.0% of the top five total. The largest capital pools within this are concentrated in liquid staking projects like Lido, and lending platforms like Aave. Re-staking projects EigenLayer and ether.fi, as well as synthetic USD issuers Ethena and Sky, are also among the largest applications. Capital concentration remains Ethereum’s clearest structural advantage.
Active loans measure the portion of deposits that have been lent out to borrowers and are accruing interest, typically related to lending revenue. On Ethereum, it reflects the total outstanding loans across lending applications.
In Q1 2026, the average active loans were $21.8 billion, down 16.6% QoQ but up 39.0% YoY. Lending balances shrink along with total TVL, consistent with risk appetite decline, but remain significantly higher than a year ago.
Lending activity on Ethereum is concentrated in a few key money markets, with Aave dominating. At quarter-end, active loans on Aave were about $13.5 billion, comprising most of the ecosystem total; followed by Morphо (~$1.9 billion), Spark (a product of Sky, ~$1 billion), and Maple (~$840 million). The contraction this quarter was mainly driven by Aave, as declining prices and cooling borrowing demand shrank its loan book by about 24% during the quarter. Among the top five chains, Ethereum’s $21.8 billion far exceeds Solana ($2.5 billion), Plasma ($2.1 billion), BNB Chain ($760.8 million), and Avalanche ($392.4 million), accounting for 79.2% of the top five total. This is the highest share among all metrics in this section.
Trading volume measures the total value of trades executed on decentralized spot exchanges. Since traders pay fees, this metric is often correlated with fee revenue generated by these venues. It reports the total DEX trading volume within the Ethereum ecosystem.
In Q1 2026, total ecosystem trading volume was $134.5 billion, down 24.0% QoQ and 31.2% YoY. The decline in trading volume is more pronounced than in TVL, indicating reduced risk appetite during the quarter’s retracement.
DEX activity on Ethereum is concentrated in a few deep liquidity venues. Uniswap handled about $85.5 billion in Q1, roughly two-thirds of the ecosystem’s volume; followed by Curve (~$22.1 billion) and CoW Swap (~$12.4 billion). Trading volume is the only metric in this section where Ethereum does not lead cross-chain: BNB Chain’s volume was $162.5 billion, higher than Ethereum’s $134.5 billion; Solana’s was $104.9 billion; then Avalanche ($14.5 billion) and Polygon ($10.7 billion). Ethereum accounts for 31.5% of the top five chains’ trading volume, ranking second after BNB Chain’s 38.0%.
Fees measure the total value paid by users for utilizing specific applications, such as interest paid by borrowers and transaction fees paid by traders, reflecting the economic value generated. This metric aggregates fees from Ethereum ecosystem applications.
In Q1 2026, total ecosystem fees were $2.0 billion, down 16.9% QoQ and 7.8% YoY, consistent with weakening trading and lending activity.
Ethereum generated $2.0 billion in fees, significantly higher than Tron ($599.3 million), Solana ($532.5 million), BNB Chain ($231.9 million), and Polygon ($38.8 million), accounting for 58.4% of the top five chains’ total fees. Despite the decline,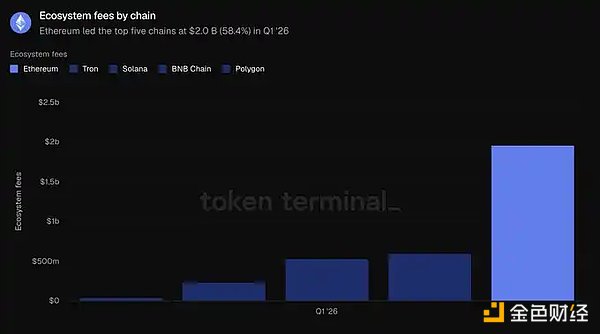 Ethereum remains the largest single source of application fees. Overall, Ethereum leads in TVL, lending, and fees, with only trading volume lagging behind.
Market cap of circulating assets measures the total value of tokenized assets on-chain, calculated as circulating supply times end-of-day price. For stablecoins, it refers to the outstanding supply; for tokenized funds, the on-chain asset management scale; for tokenized stocks, the value of issued stocks on-chain. This data covers assets issued on Ethereum.
In Q1 2026, the average market cap of tokenized assets on Ethereum was $203.4 billion, roughly flat (-0.7%) QoQ but up 42.9% YoY. Stablecoins account for the largest share, at 87.9% of the total, with the rest composed of funds, commodities, and stocks.
In Q1 2026, the average stablecoin market cap on Ethereum was $178.9 billion, down 2.3% QoQ but up 37.6% YoY, the only subcategory to decline within this quarter. Dominant issuers are Tether (USDT, $94.1 billion) and Circle (USDC, $54.5 billion), together comprising most of the stablecoin market cap on this network. Next are Sky’s USDS ($12.4 billion), Ethena’s USDe ($5.9 billion), and PayPal’s PYUSD ($2.9 billion). New entrants like Ripple’s RLUSD ($1.1 billion) are also live. Among the top five chains, Ethereum’s stablecoin market cap of $178.9 billion surpasses Tron ($84.5 billion), Solana ($14.5 billion), Arbitrum One ($6.8 billion), and Base ($4.7 billion), representing 61.8% of the combined total.
In Q1 2026, the average tokenized fund market cap was $19.4 billion, up 4.9% QoQ and 73.1% YoY. This category divides into two parts: one with leading yield-bearing on-chain USDs, such as Sky’s sUSDS (~$6.4 billion) and Ethena’s sUSDe (~$3.5 billion); and another supporting institutional narratives with regulated funds, which have scaled up, including BlackRock’s BUIDL (via Securitize, ~$1 billion), WisdomTree’s government money market fund (~$815M), Superstate’s USTB (~$620 million), and Ondo’s OUSG (~$320 million). Among the top five chains, Ethereum’s $19.4 billion leads, ahead of zkSync Era ($2.5 billion), BNB Chain ($2.3 billion), Solana ($1.3 billion), and Stellar ($1.1B), accounting for 73.0% of the total, the second-highest concentration among all asset categories.
In Q1 2026, the average tokenized commodity market cap was $4.7 billion, up 60.0% QoQ and 325.9% YoY, the fastest-growing tokenized asset class. It is almost entirely gold-backed: Tether Gold (XAUT, ~$2.6 billion) and Paxos’ PAX Gold (PAXG, ~$2.4 billion) comprise nearly the entire segment. Among the top five chains, Ethereum’s $4.7 billion far exceeds XRP Ledger ($736.6 million), Arbitrum One ($95.9 million), BNB Chain ($38.4M), and Solana ($29.8M), representing 84.0% of the top five total, the strongest lead in this report.
Tokenized stocks remain the smallest category. In Q1 2026, the average market cap was $365.1 million, a significant increase from nearly negligible a year ago, and up 16.5% QoQ. This category is almost entirely dominated by Ondo Finance, whose on-chain stocks and ETFs cover broad indices like S&P 500, Nasdaq 100, and dozens of individual stocks, constituting most of Ethereum’s tokenized stock market cap. Among the top five chains, Ethereum leads with $365.1 million, followed by Solana ($249 million), BNB Chain ($150.5 million), Arbitrum One ($29 million), and Stellar ($4.2 million). However, Ethereum’s share is only 45.8% of the total in this category, the narrowest lead and the only tokenized asset class where Ethereum does not hold a clear majority.
Overall, this quarter demonstrates Ethereum’s leadership in tokenized funds and commodities, even as stablecoin balances temporarily plateau.
Monthly active users measure the number of unique addresses engaging in revenue-generating transactions within a month. On Ethereum, it counts distinct addresses involved in on-layer transactions.
In Q1 2026, the average was 13.2 million, up 53.5% QoQ and 85.9% YoY, reaching a new high. After several quarters of moderate growth, user growth has accelerated significantly.
Transaction count measures the number of confirmed transactions added to the blockchain, reflecting network activity; transactions per second are the average rate of these confirmed transactions, measuring throughput and real-time usage. Both metrics here are for Ethereum Layer 1.
In Q1 2026, total confirmed transactions reached 200.4 million, up 38.0% QoQ and 81.5% YoY; throughput increased to 25.78 transactions per second, up 41.2% QoQ. Both metrics hit new highs, confirming that user growth is translating into substantial on-chain activity.
Fees here refer to the total transaction fees paid by users on Ethereum Layer 1, representing the cost of using the base network. This is different from the ecosystem application fees discussed in the second section.
In Q1 2026, total fees were $39.9 million, down 47.9% QoQ and 81.9% YoY. This sharply contrasts with the increase in transaction count, highlighting that as data capacity and block space prices decline, the average cost per transaction drops significantly.
This section illustrates an expansion story: more users, more transactions, all at lower total costs. As throughput growth outpaces demand, activity rises while fees fall, both can be true simultaneously.
Fully Diluted Market Cap measures ETH valuation assuming all tokens are in circulation, calculated as token price times total supply under the current economic model, including circulating, locked, unlocked, and future issuance.
In Q1 2026, the average fully diluted market cap was $290 billion, down 30.3% QoQ and 9.9% YoY. The quarterly decline is the largest among valuation metrics in this report and drives the declines in other dollar-based indicators.
Staking ratio measures the value of ETH staked to secure the proof-of-stake network relative to total ETH market cap. A reading of 0.31x indicates about 31% of ETH’s value is staked.
In Q1 2026, the average staking ratio was 0.31x, higher than the previous quarter and a year ago at 0.28x. Even as ETH’s market cap declines, the proportion of ETH committed to securing the network has increased, indicating stable staking participation during price retracements.
Token holders measure the number of distinct addresses holding ETH. On Ethereum, it counts addresses holding the native token.
In Q1 2026, the average was 292.8 million, up 8.1% QoQ and 24.9% YoY, continuing a stable upward trend over the past five quarters. Even as fully diluted market cap declines, the holder base continues to expand, indicating broader ownership during price retracements.
"The most notable tension this quarter is that Ethereum’s mainnet usage hit record highs, yet transaction fees declined. Ethereum is intentionally sacrificing short-term fee capture to expand the network, betting that cheaper block space will unlock more demand and ultimately generate more network revenue in the long run.
Token Terminal’s 'Ethereum Q1 2026 Report' shows this bet is paying off. Year-over-year, monthly active users grew 85.9%, transaction count increased 81.5%, and throughput rose 81.7%. This is the Jevons’ paradox at work. We expect that increased overall network demand will offset the impact of lower fees, similar to how the semiconductor industry today generates revenue several orders of magnitude higher than in 1975, when Intel co-founder Gordon Moore observed that transistor counts on chips roughly doubled every two years. Moreover, the benefits of expansion are still ahead: Glamsterdam’s upgrade in Q3 will increase gas limits by over 3x, and the Ethereum roadmap targets 10,000 TPS by 2029, along with a 'fast layer' network with second-level finality.
We agree with BlackRock CEO Larry Fink’s December statement that 'today’s tokenization is roughly equivalent to the internet in 1996—when Amazon only sold $16 million worth of books.' Back then, the consensus was that Amazon was just a loss-making online bookstore supported by the dot-com bubble. But Jeff Bezos saw the internet’s potential to reshape retail, prioritizing network effects and economies of scale over short-term profits. Ethereum is making similar trade-offs to solidify its role as the global financial settlement layer.
Another lesson from the internet is that open, permissionless networks tend to beat closed ones. In 1995, Bill Gates published 'The Road Ahead,' predicting digital commerce would run on proprietary 'information superhighways' like MSN, AOL, CompuServe, and Prodigy, with millions of paid users. France’s Minitel had more users than the entire web until late 1996. They all lost. No serious company would build on a competitor-controlled network; more importantly, no company can indefinitely keep pace with permissionless innovation. We’ve seen this repeatedly: Linux surpassing proprietary Unix, open networks replacing corporate walled gardens, Wikipedia replacing Britannica. Each time, proprietary solutions had initial advantages—focused products, stronger marketing, better business development—but once open systems crossed the thresholds of contribution, tooling, and trustworthiness, their lead was eroded.
Today, we see the same theme in financial infrastructure, and the data in this report proves Ethereum has crossed that threshold, dominating key metrics. Institutions building tokenized finance choose Ethereum not out of ideology but because of liquidity, composability, and institutional precedents. As highlighted, Ethereum accounts for 79.2% of active DeFi loans, 61.8% of stablecoins, 73.0% of tokenized funds, and 84.0% of tokenized commodities among the top five chains. Each new tokenized asset deepens liquidity, attracting the next; a neutral underlying layer is the only sustainable balance, as large players will never agree to settle on a competitor’s infrastructure. Moreover, institutions are realizing that privacy, permissioning, KYC, and transfer restrictions can be implemented via privacy-preserving environments and permissioned token standards on Ethereum, without sacrificing access to public liquidity; conversely, grafting public liquidity and open ecosystems onto closed chains is impossible.
If there is a change, it’s that institutional momentum accelerates after quarter-end. In May alone, BlackRock applied for two more tokenized funds; JPMorgan launched its second tokenized money market fund, JLTXX; Fidelity International launched FILQ, a Moody’s AAA-rated USD liquidity fund issued as an ERC-20. In stablecoins, Japan Blockchain Foundation’s JPY stablecoin EJPY will launch on Ethereum; a consortium of twelve European banks including BNP Paribas, ING, UniCredit, and BBVA is preparing to launch a regulated euro stablecoin.
The internet in 1990 seemed impossible, but by 2005 it was inevitable. If Fink’s view on tokenization’s stage is correct, the next few years could be among Ethereum’s most exciting. As argued in the 'Productive Money' report, network fees provide ETH with an intrinsic value floor, and the bull case is that ETH will absorb the $30+ trillion in monetary premium held by gold and Bitcoin, because ETH has superior monetary properties. ETH does not need high fees to succeed."
Metrics:
Ecosystem TVL: The dollar value of deposits across applications within a chain’s ecosystem, reported as an average over the period.
Active Loans: The dollar value of outstanding loans in lending applications within the ecosystem, reported as an average over the period.
Ecosystem Trading Volume: The total dollar value of trades executed on decentralized exchanges within the ecosystem, reported as a total over the period.
Ecosystem Fees: The total fees paid by users to applications within the ecosystem, reported as a total over the period.
Circulating Asset Market Cap: The dollar value of a tokenized asset class in circulation, calculated as circulating supply times end-of-day price, reported as an average over the period.
Monthly Active Users: The number of distinct addresses engaging in revenue-generating transactions with Ethereum, reported as an average over the period.
Transaction Count: The total number of confirmed transactions on Ethereum Layer 1, reported as a total over the period.
Transactions per Second: The average rate of confirmed transactions on Ethereum Layer 1 during the period.
Fees: The total transaction fees paid on Ethereum Layer 1, reported as a total over the period.
Fully Diluted Market Cap: The ETH price times the total supply under the current tokenomics, reported as an average over the period.
Staking Ratio: The value of ETH staked to secure the proof-of-stake network relative to total ETH market cap, reported as an average over the period.
Token Holders: The number of distinct addresses holding ETH, reported as an average over the period.
This report is published quarterly and is based on Token Terminal’s end-to-end on-chain data infrastructure. All metrics are directly sourced from blockchain data. Charts and datasets referenced in the report are available on the Token Terminal Ethereum 2026 Q1 dashboard.