Trade
Trading Type
Spot
Trade crypto freely
Pre-Market
Trade new tokens before they are officially listed
Margin
Magnify your profit with leverage
Convert & Block Trading
0 Fees
Trade any size with no fees and no slippage
Alpha
Points
Get promising tokens in streamlined on-chain trading
Leveraged Tokens
Get exposure to leveraged positions simply
Futures
Futures
Hundreds of contracts settled in USDT or BTC
Options
HOT
Trade European-style vanilla options
Unified Account
Maximize your capital efficiency
Demo Trading
Futures Kickoff
Get prepared for your futures trading
Futures Events
Participate in events to win generous rewards
Demo Trading
Use virtual funds to experience risk-free trading
Earn
Launch
CandyDrop
Collect candies to earn airdrops
Launchpool
Quick staking, earn potential new tokens
HODLer Airdrop
Hold GT and get massive airdrops for free
Launchpad
Be early to the next big token project
Alpha Points
NEW
Trade on-chain assets and enjoy airdrop rewards!
Futures Points
NEW
Earn futures points and claim airdrop rewards
Investment
Simple Earn
Earn interests with idle tokens
Auto-Invest
Auto-invest on a regular basis
Dual Investment
Buy low and sell high to take profits from price fluctuations
Soft Staking
Earn rewards with flexible staking
Crypto Loan
0 Fees
Pledge one crypto to borrow another
Lending Center
One-stop lending hub
VIP Wealth Hub
Customized wealth management empowers your assets growth
Private Wealth Management
Customized asset management to grow your digital assets
Quant Fund
Top asset management team helps you profit without hassle
Staking
Stake cryptos to earn in PoS products
Smart Leverage
NEW
No forced liquidation before maturity, worry-free leveraged gains
GUSD Minting
Use USDT/USDC to mint GUSD for treasury-level yields
More
Promotions
Activity Center
Join activities and win big cash prizes and exclusive merch
Referral
20 USDT
Earn 40% commission or up to 500 USDT rewards
Announcements
Announcements of new listings, activities, upgrades, etc
Gate Blog
Crypto industry articles
VIP Services
Huge fee discounts
Proof of Reserves
Gate promises 100% proof of reserves
Trending Topics
View More6.65K Popularity
155.55K Popularity
27.77K Popularity
75.82K Popularity
2.59K Popularity
Pin
New Version, Worth Being Seen! #GateAPPRefreshExperience
🎁 Gate APP has been updated to the latest version v8.0.5. Share your authentic experience on Gate Square for a chance to win Gate-exclusive Christmas gift boxes and position experience vouchers.
How to Participate:
1. Download and update the Gate APP to version v8.0.5
2. Publish a post on Gate Square and include the hashtag: #GateAPPRefreshExperience
3. Share your real experience with the new version, such as:
Key new features and optimizations
App smoothness and UI/UX changes
Improvements in trading or market data experience
Your fa🎉 Share Your 2025 Year-End Summary & Win $10,000 Sharing Rewards!
Reflect on your year with Gate and share your report on Square for a chance to win $10,000!
👇 How to Join:
1️⃣ Click to check your Year-End Summary: https://www.gate.com/competition/your-year-in-review-2025
2️⃣ After viewing, share it on social media or Gate Square using the "Share" button
3️⃣ Invite friends to like, comment, and share. More interactions, higher chances of winning!
🎁 Generous Prizes:
1️⃣ Daily Lucky Winner: 1 winner per day gets $30 GT, a branded hoodie, and a Gate × Red Bull tumbler
2️⃣ Lucky Share Draw: 10🎨 Gate AI Creation Contest | One Sentence, Draw Your 2026
On Gate Square, anyone can be a visual creator — truly zero barriers to entry.
With just one sentence, generate an image and bring your vision of 2026 to life.
Create and post your work using Gate Square AI Creation for a chance to win the Gate Year of the Horse New Year Gift Box.
📅 Duration
Dec 17, 2025, 10:00 – Jan 3, 2026, 18:00 UTC
🎯 How to Join
1. Go to Gate Square → Create Post → AI Creation
2. Enter one sentence to generate your image
3. Post with #GateAICreation
🏆 Rewards
5 winners: Gate Year of the Horse New Year
[America] PPI (Producer Price Index) for May fell below market expectations for both the total and core indices compared to the previous month | A clear explanation of important economic indicators of Japan and America | Manekuri Monex Securities' investment information and media useful for money.
Announcement on June 12, 2025 (Thursday) at 21:30 (Japan Time)
U.S. Producer Price Index (PPI)
【1】Results: Both the overall and core figures fell short of market expectations compared to the previous month.
[Figure 1] Summary of the U.S. Producer Price Index (PPI) for Final Demand Results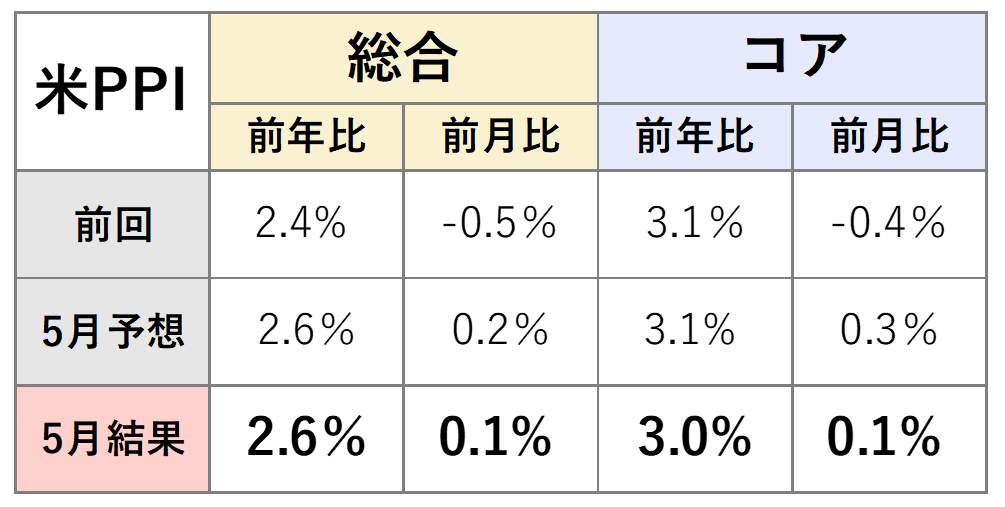 *Market expectations are the median of economist forecasts compiled by Bloomberg.
Source: U.S. Department of Labor, created by Monex Securities via Bloomberg
The Producer Price Index (PPI) for May rose by 2.6% compared to the same month last year, matching market expectations. This represents a slight acceleration from the previous increase of 2.4%. On a month-over-month basis, there was a rise of 0.1%, exceeding the previous result (a decrease of 0.5%), but falling short of market expectations (0.2%).
*Market expectations are the median of economist forecasts compiled by Bloomberg.
Source: U.S. Department of Labor, created by Monex Securities via Bloomberg
The Producer Price Index (PPI) for May rose by 2.6% compared to the same month last year, matching market expectations. This represents a slight acceleration from the previous increase of 2.4%. On a month-over-month basis, there was a rise of 0.1%, exceeding the previous result (a decrease of 0.5%), but falling short of market expectations (0.2%).
The core PPI, excluding the volatile food and energy sectors, rose by 3.0% compared to the same month last year, falling short of market expectations and the previous result (both at a 3.1% increase). On a month-over-month basis, it increased by 0.1%, exceeding the previous result (a decrease of 0.4%), but falling below market expectations (0.3%).
【2】Content and Highlights: The recovery of distribution margins is a positive factor.
What is PPI in the first place?
PPI refers to the Producer Price Index in the United States, which measures the price fluctuations of goods and services at the production stage, targeting raw materials and products.
For example, when considering furniture such as desks, PPI measures the price fluctuations of raw materials like wood and metal that companies procure to produce products like desks, whereas CPI measures the price fluctuations of desks at the point of purchase by consumers.
Although this is not always the case, generally speaking, fluctuations in the prices of raw materials that companies procure often reflect in the prices consumers ultimately pay, which is why the PPI is regarded as a leading indicator of the CPI. As the impact of the tariff policies under the Trump administration comes into focus, the attention on the PPI as a leading indicator is increasing.
[Figure 2] Trends in CPI and PPI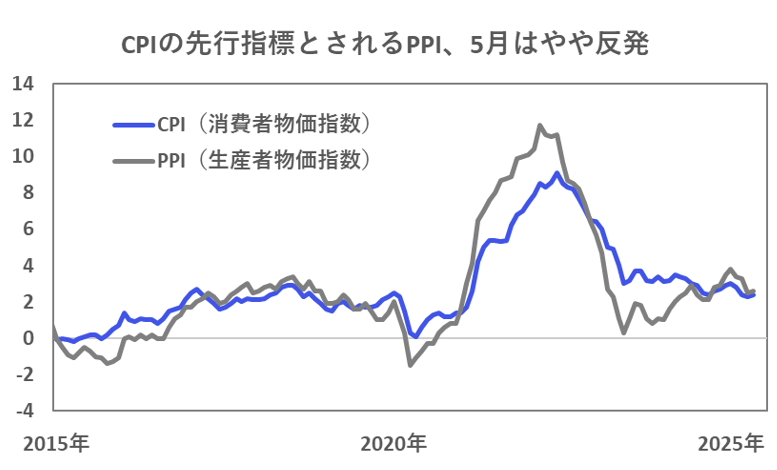 Source: U.S. Department of Labor, created by Monex Securities from Bloomberg
Additionally, among the items of the PPI, portfolio management fees, airfare, and outpatient medical expenses are said to be used in the calculation of the Personal Consumption Expenditures (PCE) price index, which is adopted by the Federal Reserve (FRB) as an inflation indicator. For this reason, the PPI draws attention not only for the PCE price index announced at the end of the month but also for predicting future trends in monetary policy.
Source: U.S. Department of Labor, created by Monex Securities from Bloomberg
Additionally, among the items of the PPI, portfolio management fees, airfare, and outpatient medical expenses are said to be used in the calculation of the Personal Consumption Expenditures (PCE) price index, which is adopted by the Federal Reserve (FRB) as an inflation indicator. For this reason, the PPI draws attention not only for the PCE price index announced at the end of the month but also for predicting future trends in monetary policy.
Breakdown and details of May results
Suggests a slight increase in future inflationary pressures.
The results of the PPI for May showed a slight rebound in the overall index from the previous month, suggesting a slight increase in future inflation pressures based on the headline figures.
[Figure 3] Breakdown of the U.S. Producer Price Index (Month-on-Month)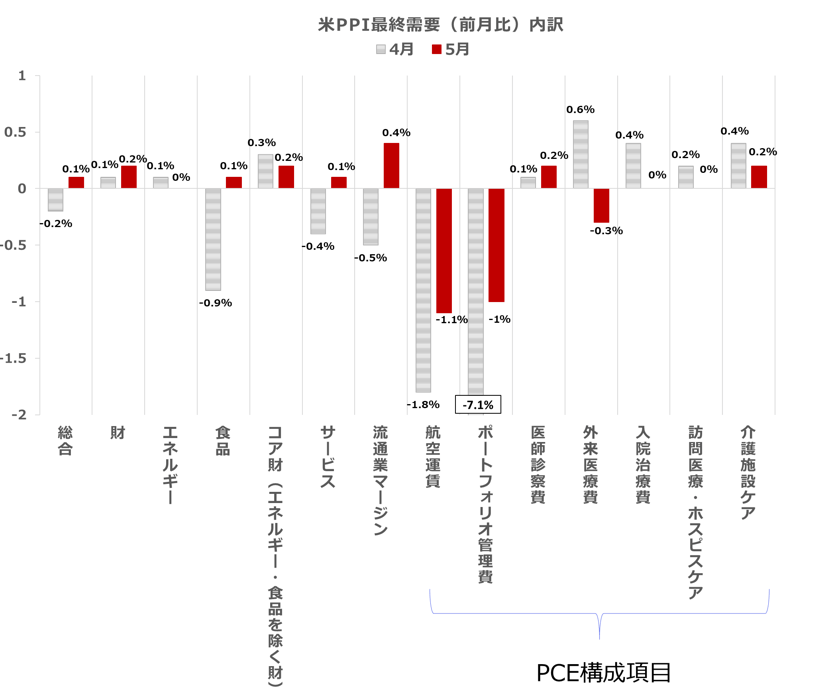 Source: U.S. Department of Labor, created by Monex Securities from Bloomberg
Food may be a contributing factor to the overall increase / Energy prices remained unchanged compared to the previous month.
As shown in Chart 3, when looking at the breakdown compared to the previous month, the price of goods accelerated slightly from +0.1% in April to +0.2% in May. The main factor was that food prices reversed from a decline of 0.9% in the previous month to an increase of 0.1%. The persistence of food inflation is also confirmed in the CPI, and food may continue to be a contributing factor to the overall increase.
On the other hand, energy prices remained flat compared to the previous month, with growth slowing from +0.1% last month. This movement aligns with the situation where, after the decline in WTI crude oil futures prices in early May, prices have been relatively stable (see Chart 4).
However, crude oil futures prices have risen since entering June and are on an upward trend. Therefore, in the next PPI, energy prices may contribute to an increase in the overall index.
[Figure 4] Trends in WTI Crude Oil Futures Prices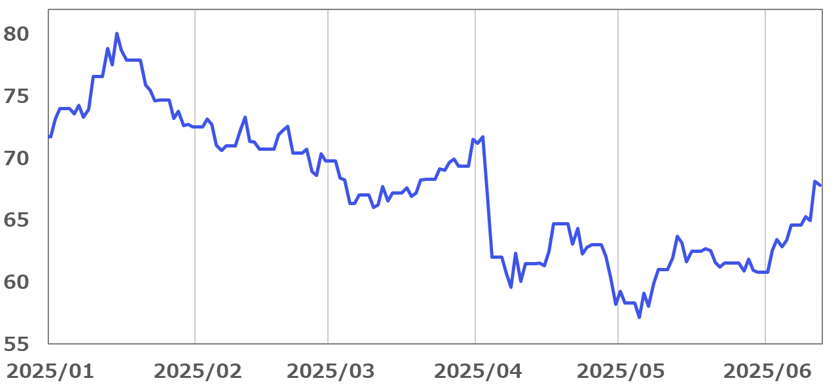 Source: Created by Monex Securities based on Bloomberg data.
Core tax prices increased by 0.2% compared to the previous month, showing a slowdown in growth.
Core goods prices excluding food and energy increased by +0.2% compared to the previous month, showing a slowdown from +0.3% in the previous month. Although core goods prices are susceptible to the direct effects of tariffs, no significant impact appears to have been observed at this time.
Among core assets, movements perceived as influenced by tariffs include an increase in private capital equipment such as industrial machinery, which is a target for corporate capital investment. Additionally, consumer durable goods have been on an upward trend since 2024, and recently, the pace of this increase has slightly accelerated. On the other hand, as a whole, including other non-durable goods, no significant impact has been confirmed (Figure 5).
[Figure 5] Year-on-year changes in private sector capital equipment and consumer durable and non-durable goods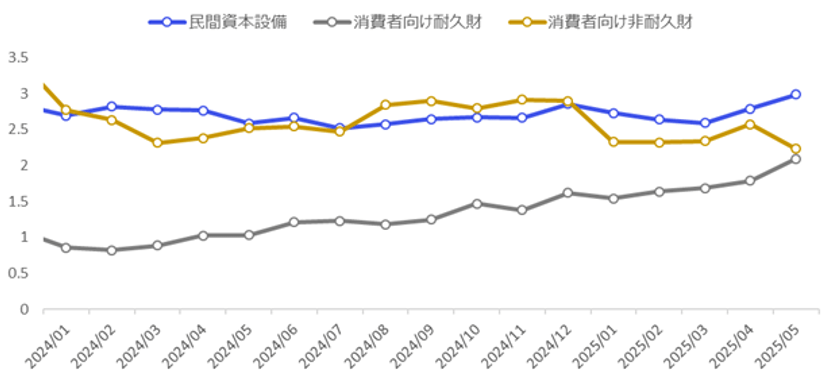 Source: U.S. Department of Labor, created by Monex Securities based on Bloomberg
The service price has reversed and increased from the previous month, within a healthy adjustment range.
On the other hand, service prices increased by 0.1% compared to the previous month, reversing from -0.4% last month. The main factor for this was the recovery of margin fees in the retail and wholesale sectors from -0.5% last month to +0.4%. Although this increase in this item will push service inflation up again, recently there had been concerns about the deterioration of profit margins in the distribution industry due to excessive declines in margins. Therefore, this recovery is seen as a healthy adjustment. Moving forward, a moderate level of fluctuation is desired.
And the items related to the Personal Consumption Expenditures (PCE) price index, which the Federal Reserve uses as a basis for its monetary policy decisions, have generally yielded restraining results.
【3】Impression: At this point, the impact of tariffs on prices has not been confirmed, and the focus shifts to economic trends.
The PPI for May showed a calm result, following the CPI from the previous day. Despite the attention on the impact of tariffs, the growth in prices remains moderate, and it seems that there is no significant impact on prices at this time.
In light of this outcome, an environment conducive to rate cuts is being established, which can be considered a positive factor for the U.S. economy and the stock market. Moreover, if inflation is deemed to be currently non-problematic, the focus of the U.S. economy will shift to economic trends.
In particular, it is concerning that the decline in airfares continues in both the CPI and PPI, reflecting the decrease in air travel demand (Chart 6). The reduction in air travel demand signifies a decrease in human flow and could lead to a contraction in the demand for various services at travel destinations, positioning it as an important leading indicator of the economy.
[Figure 6] The trend of passenger numbers counted by TSA (Transportation Security Administration) at security checkpoints.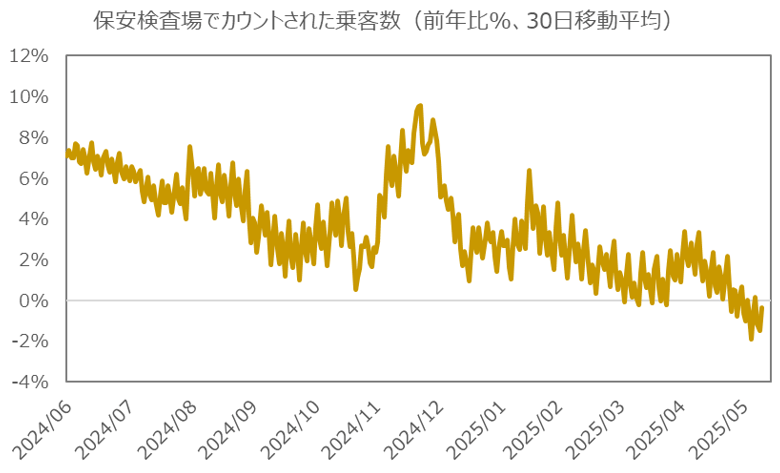 Source: Created by Monex Securities based on data from TSA (Transportation Security Administration) and Bloomberg.
In the future, an increase in air travel demand is expected as we approach summer, but attention is focused on how strong this will be compared to previous years. In this regard, it will be necessary to check the current state of U.S. consumption through the retail sales figures to be announced on June 17.
Source: Created by Monex Securities based on data from TSA (Transportation Security Administration) and Bloomberg.
In the future, an increase in air travel demand is expected as we approach summer, but attention is focused on how strong this will be compared to previous years. In this regard, it will be necessary to check the current state of U.S. consumption through the retail sales figures to be announced on June 17.
Financial Intelligence Department, Koji Okada