Trade
Trading Type
Spot
Trade crypto freely
Alpha
Points
Get promising tokens in streamlined on-chain trading
Pre-Market
Trade new tokens before they are officially listed
Margin
Magnify your profit with leverage
Convert & Block Trading
0 Fees
Trade any size with no fees and no slippage
Leveraged Tokens
Get exposure to leveraged positions simply
Futures
Futures
Points
Hundreds of contracts settled in USDT or BTC
Options
HOT
Trade European-style vanilla options
Unified Account
Maximize your capital efficiency
Demo Trading
Futures Kickoff
Get prepared for your futures trading
Futures Events
Participate in events to win generous rewards
Demo Trading
Use virtual funds to experience risk-free trading
Earn
Launch
CandyDrop
Collect candies to earn airdrops
Launchpool
Quick staking, earn potential new tokens
HODLer Airdrop
Hold GT and get massive airdrops for free
Launchpad
Be early to the next big token project
Alpha Points
New
Trade on-chain assets and enjoy airdrop rewards!
Futures Points
New
Earn futures points and claim airdrop rewards
Investment
Simple Earn
Earn interests with idle tokens
Auto-Invest
Auto-invest on a regular basis
Dual Investment
Buy low and sell high to take profits from price fluctuations
Soft Staking
Earn rewards with flexible staking
Crypto Loan
0 Fees
Pledge one crypto to borrow another
Lending Center
One-Stop Lending Hub
VIP Wealth Hub
Customized wealth management empowers your assets growth
Private Wealth Management
Customized asset management to grow your digital assets
Quant Fund
Top asset management team helps you profit without hassle
Staking
Stake cryptos to earn in PoS products
BTC Staking
HOT
Stake BTC and earn 10% APR
GUSD Minting
Use USDT/USDC to mint GUSD for treasury-level yields
More


EncryptedSixTreasures
No content yet
EncryptedSixTreasures
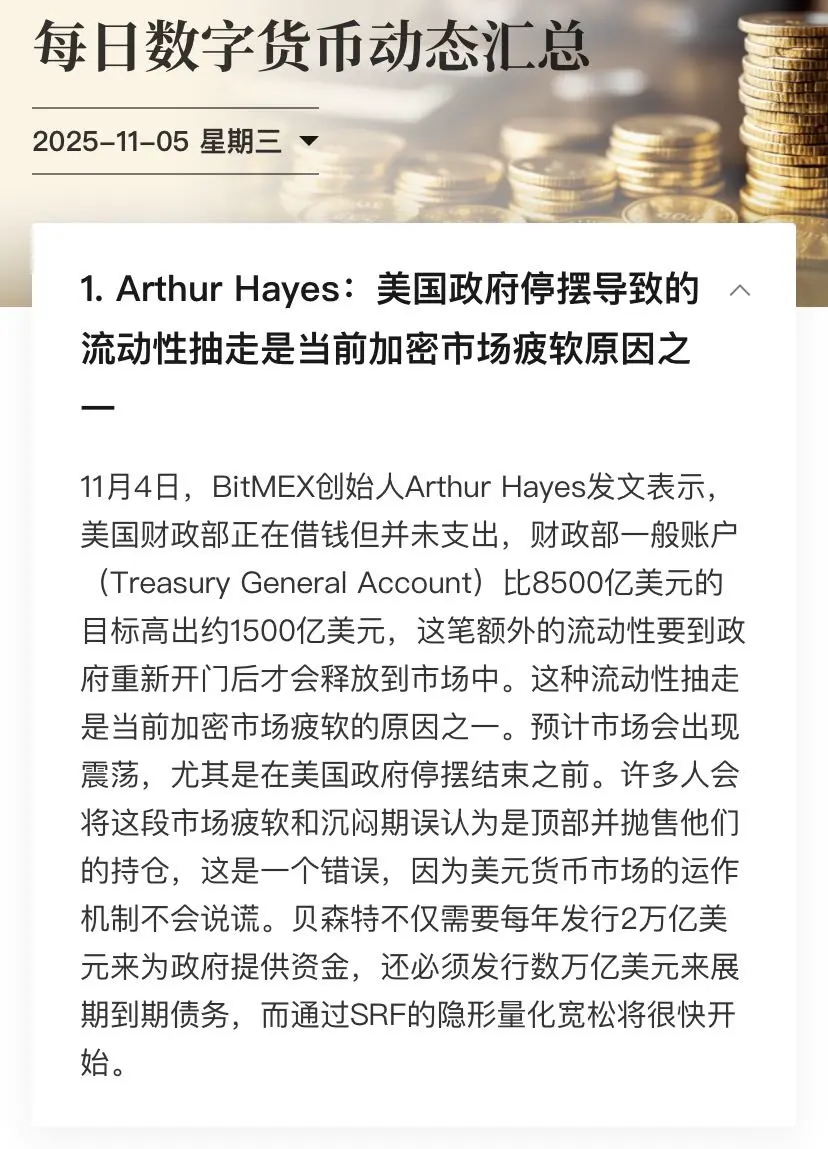
Is the crypto market wilting?
It turns out to be related to the U.S. government's "money control"! The crypto market has been lackluster lately, and it's not just due to poor market conditions; it actually has to do with the way the U.S. government "manages money"!
In simple terms, the U.S. Treasury currently holds $150 billion more than targeted, which has not been spent; this money is like being temporarily "frozen" and has not flowed into the market. In the crypto market, liquidity is the "living water"; with less living water, the market will naturally wilt. Moreover, he also menti
BTC-0.42%
- Reward
- 6
- 1
- Repost
- Share
EncryptedSixTreasures:
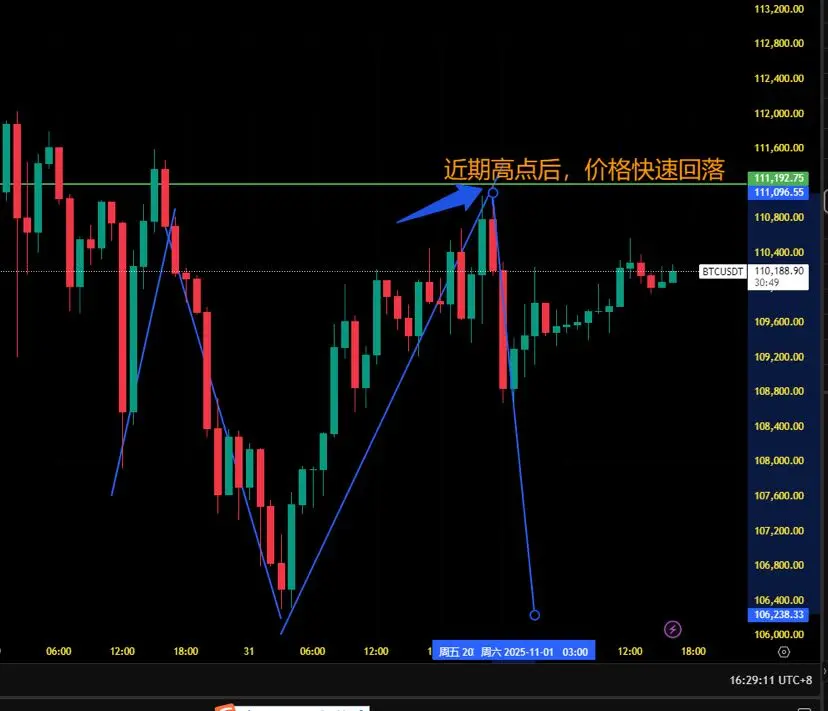
[大兵][大兵][大兵][大兵][大兵][大兵][大兵][大兵][大兵][大兵][大兵][大兵][大兵][大兵][大兵][大兵][大兵][大兵][大兵][大兵][大兵]Single Candlestick Pattern Analysis: Market analysis for November 1, 2025, the last Candlestick in the BTC's last 4 hours is a Bullish line, and it is a bullish candle, which is a strong signal indicating that during these 4 hours, long positions have dominated, driving the price significantly up⬆️.
From the 1-hour Candlestick chart, BTC quickly retraced after reaching a recent high, forming a potential M-top pattern together with the previous high, which is a typical top reversal signal. Currently, the price has broken below all short-term moving averages, showing a clear weakness.
Overal
From the 1-hour Candlestick chart, BTC quickly retraced after reaching a recent high, forming a potential M-top pattern together with the previous high, which is a typical top reversal signal. Currently, the price has broken below all short-term moving averages, showing a clear weakness.
Overal
BTC-0.42%
- Reward
- 6
- 1
- Repost
- Share
EncryptedSixTreasures:
[得意][得意][得意][得意][得意][得意][得意][得意][得意][得意][得意][得意][得意][得意][得意][得意][得意][得意][得意][得意][得意][得意]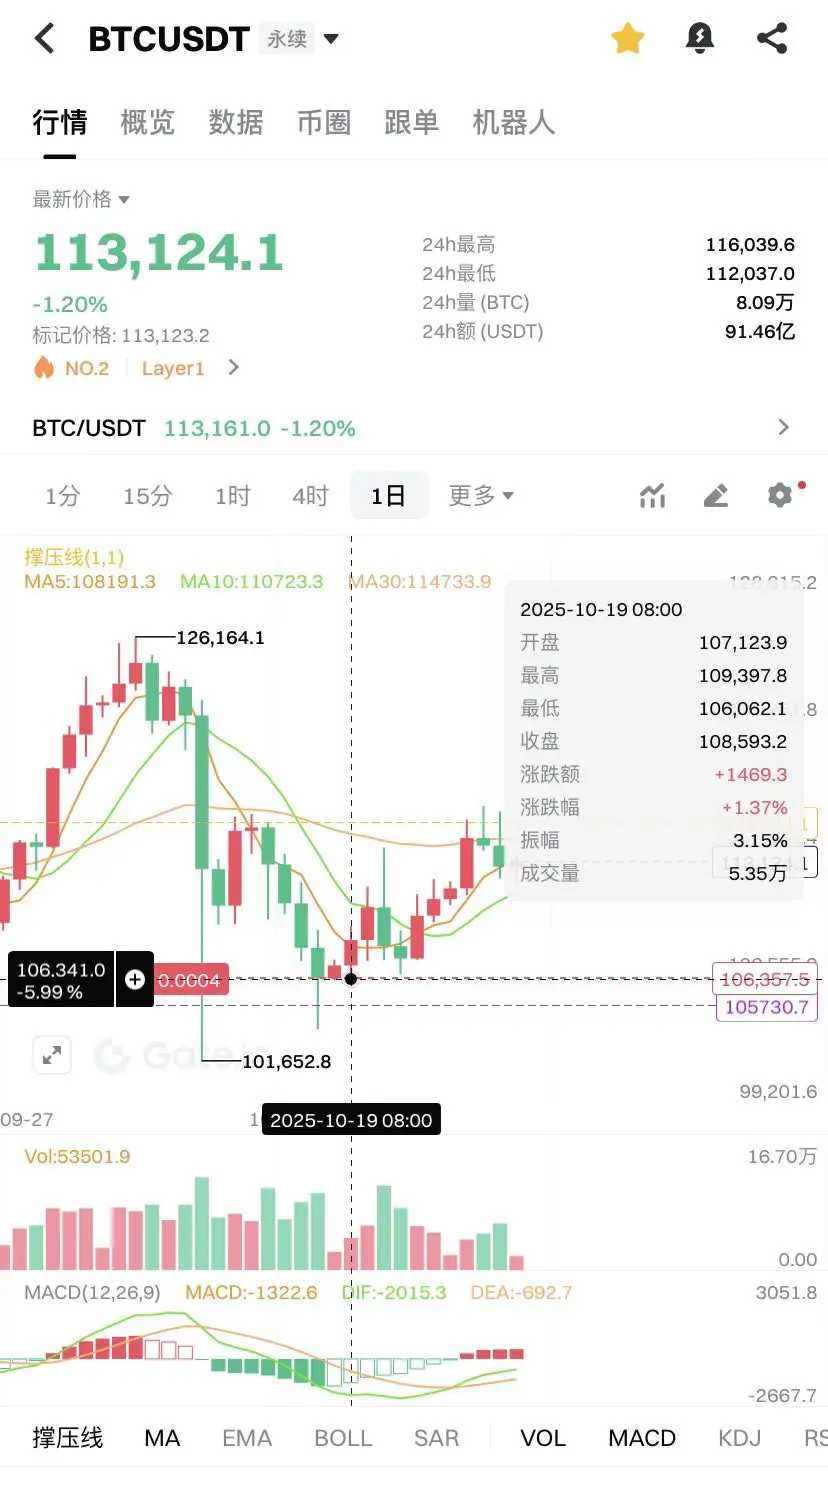
- Reward
- 6
- Comment
- Repost
- Share
When Uncle Hat checks virtual coin transactions, remember these three sentences!
"Hello, I am from the Public Security Bureau..." Receiving this call makes even the seasoned investors weak at the knees! But don't let panic control your rationality, remember these three tips that can save you:
First Key: Clarify Legal Boundaries
When asked about the legality of transactions, remember the standard statement: "The act of virtual coin trading between individuals does not itself constitute a violation of the law, but if the funds involved have illegal sources, corresponding legal responsibiliti
BTC-0.42%

- Reward
- 6
- 1
- Repost
- Share
EncryptedSixTreasures:
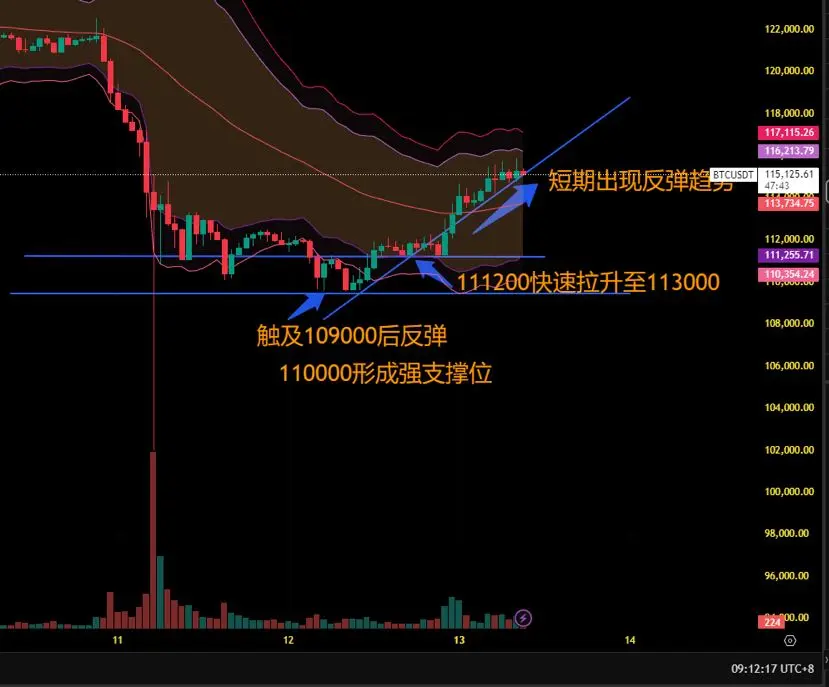
[得意][得意][得意][得意][得意][得意][得意][得意][得意][得意][得意][得意][得意][得意][得意][得意][得意][得意][得意][得意] Go Go GoBTC reached a low of 109561 on October 12 before rebounding, indicating strong buying support at lower levels. The daily Candlestick has formed a bullish engulfing pattern near the strong support level of 110000, suggesting potential for a rebound. The 2-hour Candlestick quickly pumped from 111297 to 113189, showing a short-term rebound trend, overall still looking bullish! [左太极][左太极]#BTC
BTC-0.42%
- Reward
- 6
- 1
- Repost
- Share
EncryptedSixTreasures:
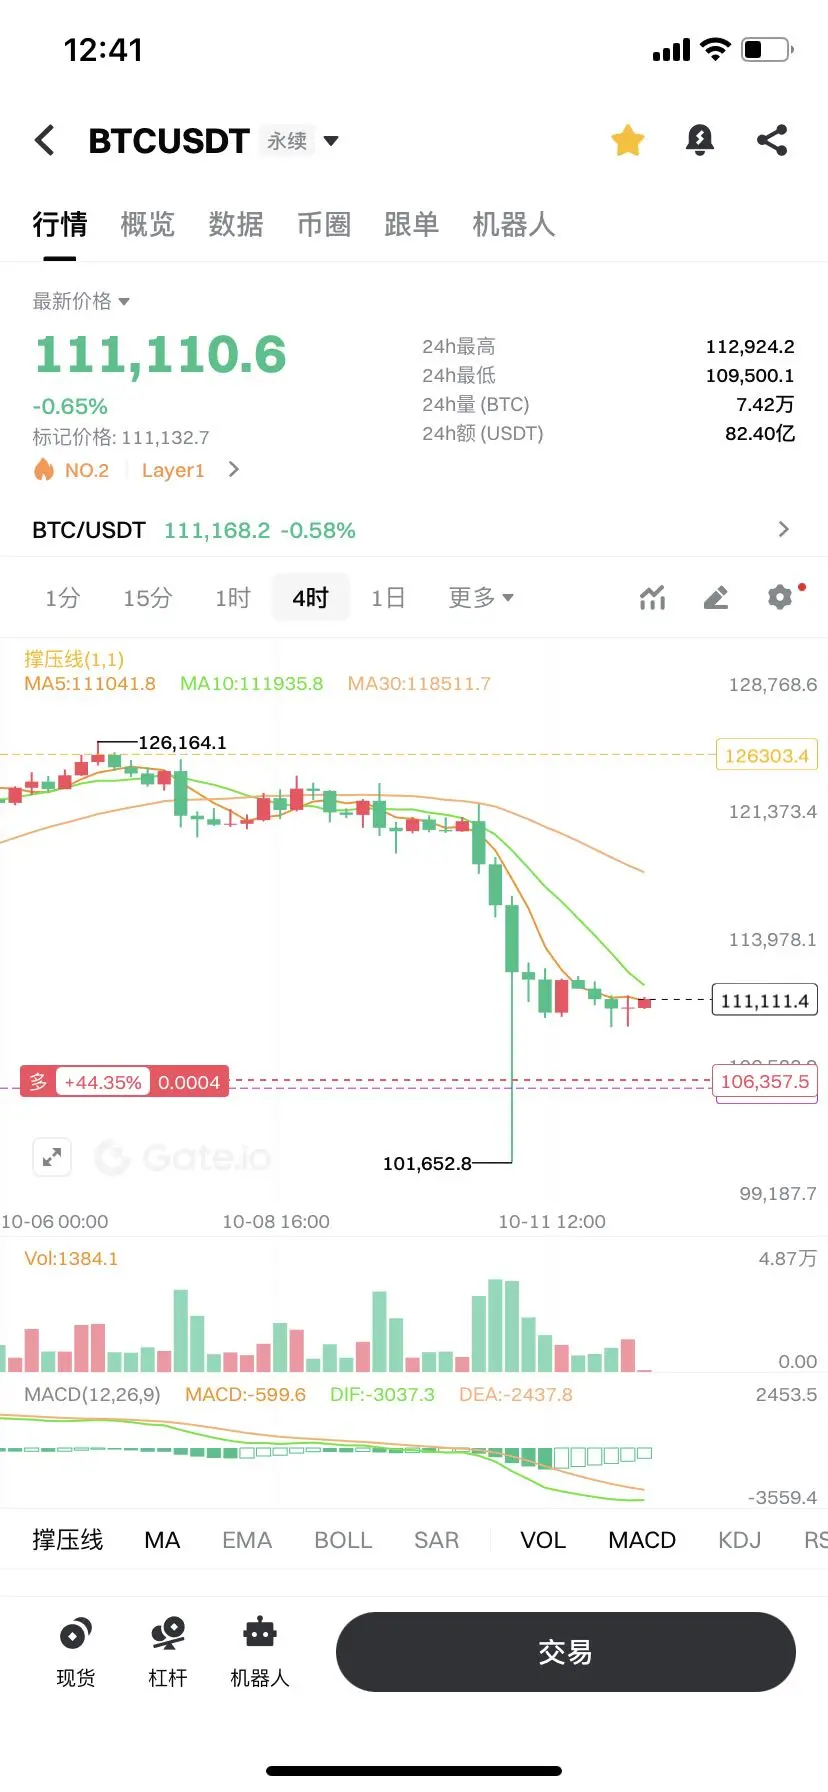
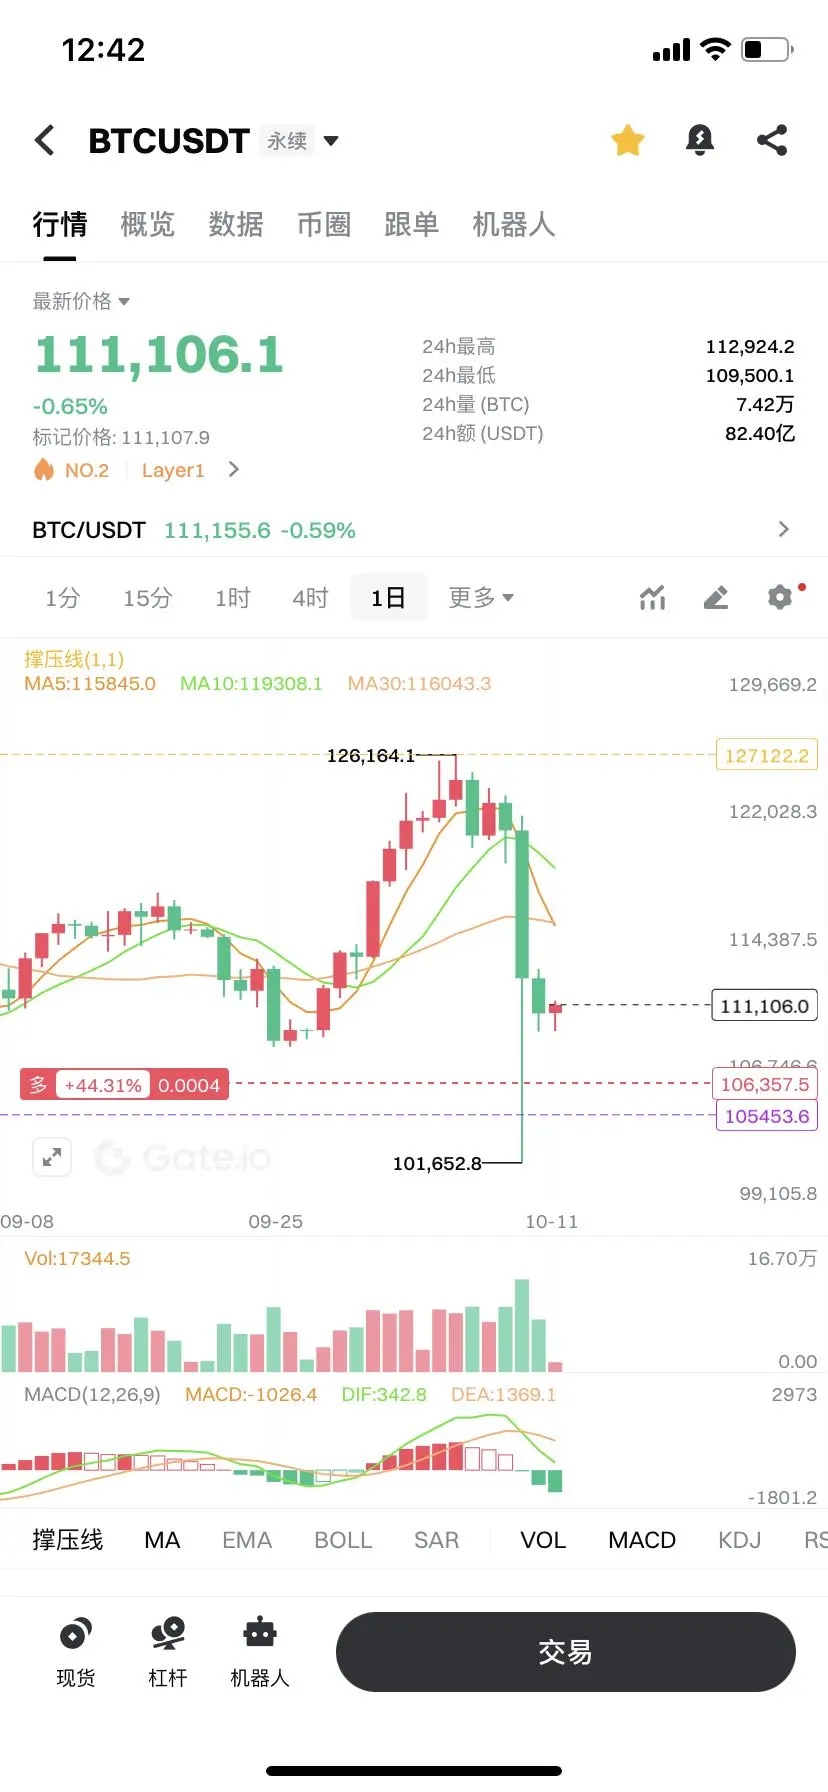
[得意][得意][得意][得意][得意][得意][得意][得意][得意][得意][得意][得意][得意][得意][得意][得意][得意][得意][得意][得意]From the daily chart perspective, Bitcoin experienced a significant fall on October 11, plunging over 13% within 24 hours, with a low reaching approximately $102,000. The daily chart formed a bearish belt hold, indicating strong short positions. As of October 12 at 00:10, the price of Bitcoin was $111,800, still in a downtrend, with the candlestick pattern showing a evening star, which is a bearish pattern, and the moving average system showing a bearish arrangement, indicating that market momentum is skewed downward.
From the 4-hour Candlestick chart, as of October 12 at 9:40, the most recent
From the 4-hour Candlestick chart, as of October 12 at 9:40, the most recent
BTC-0.42%
- Reward
- 6
- 1
- Repost
- Share
EncryptedSixTreasures:
[得意][得意][得意][得意][得意][得意][得意][得意][得意][得意][得意][得意][得意][得意][得意][得意][得意][得意][得意]On October 11, 2025, the price of Bitcoin plummeted from a high of $126,000, with a maximum daily fall of 13.5%, reaching a low of $105,900, marking the most severe decline since April of this year.
The recent big dump of BTC is the result of multiple factors working together, mainly including the following aspects:
• Macroeconomic policies and economic environment: On one hand, U.S. President Trump has threatened to significantly increase tariffs, raising concerns about escalating global trade friction, prompting investors to flee from risk assets, with Bitcoin being the most affected high-ri
BTC-0.42%

- Reward
- 6
- 1
- Repost
- Share
EncryptedSixTreasures:
[得意][得意][得意][得意][得意][得意][得意][得意][得意][得意][得意][得意][得意][得意][得意][得意][得意][得意][得意]


- Reward
- 6
- Comment
- Repost
- Share
- Reward
- 6
- 1
- Repost
- Share
EncryptedSixTreasures:
2025 Charge Charge Charge [得意] [得意] [得意] [得意] [得意] [得意] [得意] [得意] [得意] [得意] [得意] [得意] [得意] [得意] [得意] [得意] [得意] [得意] Looking at the BTC 4-hour Candlestick Chart, the price has recently formed a range of fluctuations, with the range oscillating roughly between 116600 and 118000 dollars, and the market lacks clear directional guidance.
Let's take a look at the 1-hour Candlestick Chart. The price shows a fluctuating downward trend during the early hours, with consecutive bearish Candlesticks, indicating that the bearish forces dominate during this period. However, the trading volume did not significantly increase during the price decline, which may suggest that the sustainability of the bearish forces remains t
Let's take a look at the 1-hour Candlestick Chart. The price shows a fluctuating downward trend during the early hours, with consecutive bearish Candlesticks, indicating that the bearish forces dominate during this period. However, the trading volume did not significantly increase during the price decline, which may suggest that the sustainability of the bearish forces remains t
BTC-0.42%


- Reward
- 6
- 1
- Repost
- Share
EncryptedSixTreasures:
Charge forward to 2025, make money[得意][得意][得意][得意][得意][得意][得意][得意][得意][得意][得意][得意]BTC 117900 is still far from 120000💵?
I posted something in May when BTC surged past 110,000, breaking the historical high and stabilizing at that level. At that time, there were also many positive news, such as the stablecoin legislation introduced in various states in the US, etc.
More institutions are injecting funds into the cryptocurrency market, and they are optimistic about this year's bull market. Breaking 120,000 is just around the corner!!! #BTC
BTC-0.42%

- Reward
- 6
- Comment
- Repost
- Share
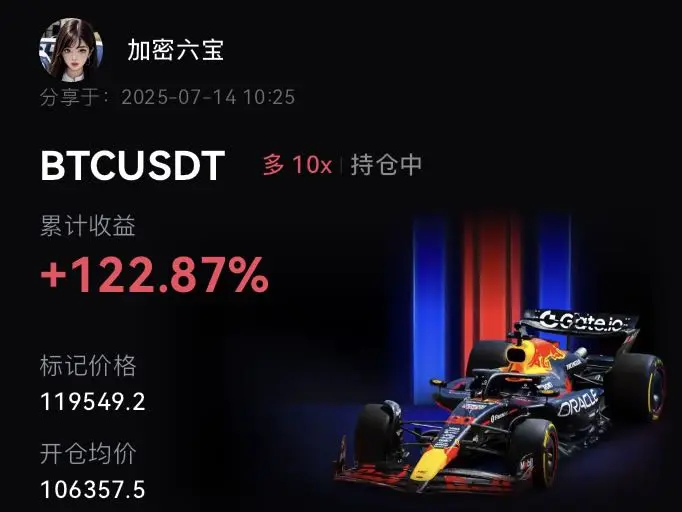
The pancake lives up to expectations and continues to rise👆
Long-term upward trend established: Since April, BTC has been in an upward channel, continually creating higher highs and higher lows. The breakout on July 10 is a continuation of this upward trend, with the daily closing above the high, demonstrating that bullish strength is dominant in the long-term trend.
Since the beginning of July, its price has repeatedly tested the range of $105,000 - $112,000, with significantly reduced market volatility and a daily fluctuation narrowing to around $1,500.
The current Bitcoin is i
BTC-0.42%
- Reward
- 6
- 1
- Repost
- Share
EncryptedSixTreasures:
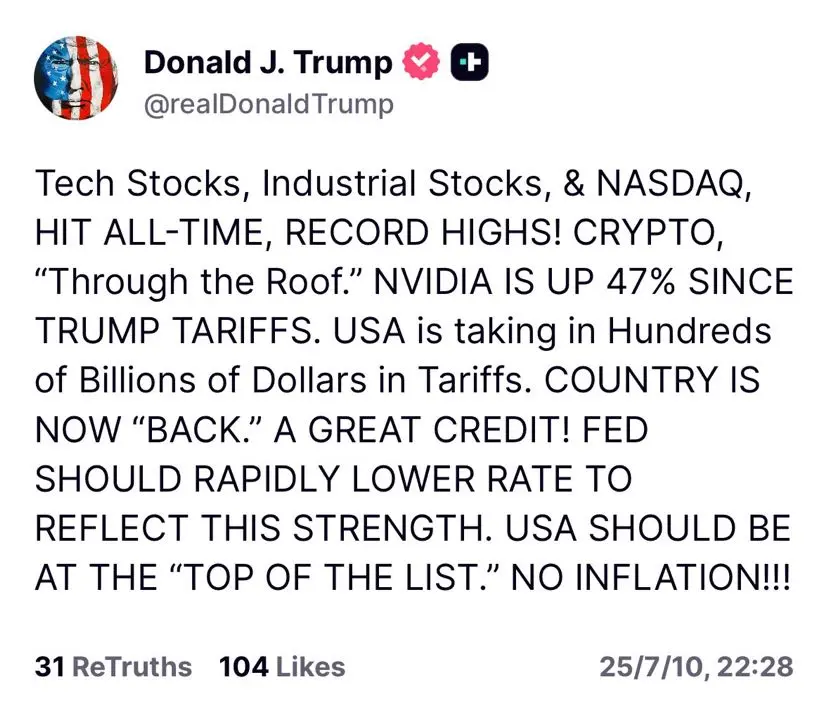
2025, Charge! [得意] [得意] [得意] [得意] [得意] [得意] [得意] [得意] [得意] [得意] [得意] [得意] [得意] [得意] [得意] [得意][Trump boasts about achievements and continues to pressure the Fed to cut interest rates]
U.S. President Trump stated on social media: Tech stocks, industrial stocks, and the Nasdaq index have reached all-time highs! Cryptocurrency is "breaking the ceiling". Since Trump imposed tariffs, Nvidia's stock price has risen by 47%. The U.S. is imposing hundreds of billions of dollars in tariffs. The nation is now "back". A great honor! The Fed should quickly lower interest rates to reflect this strength. The U.S. should be at the "top". No inflation!!
#BTC
BTC-0.42%
- Reward
- 6
- Comment
- Repost
- Share
BTC broke a new high, we made money again.
[得意][得意][得意][得意][得意][得意][得意][得意][得意][得意][得意]
[得意][得意][得意][得意][得意][得意][得意][得意][得意][得意][得意]
BTC-0.42%
- Reward
- 6
- 1
- Repost
- Share
EncryptedSixTreasures:
11111112025, Charge, Charge, Charge 🥰🥰🥰🥰🥰🥰🥰Citigroup announced that the interest rate cut threshold is decreasing.
Citigroup analysts indicate that the upcoming release of the Federal Reserve's minutes from the June 17-18 meeting may read more dovishly, with the threshold for interest rate cuts declining.
Citi believes that although Powell maintained a neutral stance during the press conference following the June interest rate decision, the meeting minutes better reflect the content he did not explicitly state. Recently, several Federal Reserve officials have signaled a dovish tone, and as of June 2025, the year-on-year increase in the
BTC-0.42%

- Reward
- 6
- 1
- Repost
- Share
EncryptedSixTreasures:
111112025, charge charge charge [得意][得意][得意][得意][得意][得意][得意][得意][得意][得意]The EU has issued MiCA licenses to 53 crypto companies, including 14 stablecoin issuers and 39 crypto asset service providers.
According to Patrick Hansen, the EU Policy Director of Circle, the MiCA regulation implements a 6-month period for cryptocurrency asset service providers (CASP) and a 12-month period for stablecoins. In July, there were new developments: 14 institutions from 7 EU countries were authorized to issue stablecoins, with 3 from France and 1 or 3 from Germany and other countries. They collectively issued 20 types of electronic currency tokens or single fiat currency stablecoi
According to Patrick Hansen, the EU Policy Director of Circle, the MiCA regulation implements a 6-month period for cryptocurrency asset service providers (CASP) and a 12-month period for stablecoins. In July, there were new developments: 14 institutions from 7 EU countries were authorized to issue stablecoins, with 3 from France and 1 or 3 from Germany and other countries. They collectively issued 20 types of electronic currency tokens or single fiat currency stablecoi
BTC-0.42%

- Reward
- 6
- Comment
- Repost
- Share

- Reward
- 6
- 1
- Repost
- Share
EncryptedSixTreasures:
In 2025, charge, charge, charge [得意][得意][得意][得意][得意][得意][得意][得意][得意][得意][得意][得意][得意]The Hong Kong "Stablecoin Regulation" will take effect on August 1st. The Secretary for Financial Services and the Treasury, Christopher Hui, stated on July 7th that the Hong Kong Monetary Authority is currently consulting the market on the implementation of the regulation's guidelines, which will be announced in July. The goal is to issue stablecoin licenses within this year, and the number of licenses granted will be in single digits. This initiative has multiple important implications:
• Establish a robust regulatory environment: The "Stablecoin Regulation" upholds the principle of "same ac
• Establish a robust regulatory environment: The "Stablecoin Regulation" upholds the principle of "same ac
View Original

- Reward
- 7
- 1
- Repost
- Share
EncryptedSixTreasures:
In 2025, rush rush rush [得意][得意][得意][得意][得意][得意][得意][得意][得意][得意][得意][得意][得意]