Trade
Trading Type
Spot
Trade crypto freely
Alpha
Points
Get promising tokens in streamlined on-chain trading
Pre-Market
Trade new tokens before they are officially listed
Margin
Magnify your profit with leverage
Convert & Block Trading
0 Fees
Trade any size with no fees and no slippage
Leveraged Tokens
Get exposure to leveraged positions simply
Futures
Futures
Points
Hundreds of contracts settled in USDT or BTC
Options
HOT
Trade European-style vanilla options
Unified Account
Maximize your capital efficiency
Demo Trading
Futures Kickoff
Get prepared for your futures trading
Futures Events
Participate in events to win generous rewards
Demo Trading
Use virtual funds to experience risk-free trading
Earn
Launch
CandyDrop
Collect candies to earn airdrops
Launchpool
Quick staking, earn potential new tokens
HODLer Airdrop
Hold GT and get massive airdrops for free
Launchpad
Be early to the next big token project
Alpha Points
New
Trade on-chain assets and enjoy airdrop rewards!
Futures Points
New
Earn futures points and claim airdrop rewards
Investment
Simple Earn
Earn interests with idle tokens
Auto-Invest
Auto-invest on a regular basis
Dual Investment
Buy low and sell high to take profits from price fluctuations
Soft Staking
Earn rewards with flexible staking
Crypto Loan
0 Fees
Pledge one crypto to borrow another
Lending Center
One-Stop Lending Hub
VIP Wealth Hub
New
Customized wealth management empowers your assets growth
Private Wealth Management
Customized asset management to grow your digital assets
Quant Fund
Top asset management team helps you profit without hassle
Staking
Stake cryptos to earn in PoS products
BTC Staking
HOT
Stake BTC and earn 10% APR
GUSD Minting
New
Use USDT/USDC to mint GUSD for treasury-level yields
More


- Trending TopicsView More
11.5K Popularity
29.8K Popularity
21.9K Popularity
4.2K Popularity
200.5K Popularity
- Hot Gate FunView More
- MC:$784.5KHolders:7149
- MC:$573KHolders:10610
- MC:$107.7KHolders:3257
- MC:$700.1KHolders:130
- MC:$59KHolders:7345
- Pin
- 🚀 #GateNewbieVillageEpisode3 ✖️ @CryptoSelf
📈 Share your trading journey | 💡 Discuss market insights | 🤝 Be part of the Gate Family
⏰ Event Date: Oct 17 04:00 – Oct 24 16:00 UTC
How to Join:
1️⃣ Follow Gate_Square + @CryptoSelf
2️⃣ Post on Gate Square with the hashtag #GateNewbieVillageEpisode3
3️⃣ Share your learning journey, trading insights, or personal growth stories
— The more genuine and inspiring your post, the higher your chance to win!
🎁 Rewards
3 lucky winners → $50 Futures Trial Voucher
✨ Every lesson counts—join us on Gate Square and grow smarter together! - Dear Gate Square users, we’re excited to announce a brand-new upgrade to our user interface! The new version is simpler, smoother, and packed with many thoughtful new features. Update now and explore what's new! What do you think of the new Gate Square experience? Which features do you like most? Have you noticed any surprises or improvements? Share your experience now to split a $100 prize pool!
🎁 We'll select 10 lucky users, each winning $10 Futures Voucher!
How to participate:
1⃣️ Follow Gate_Square;
2⃣️ Create a post with the hashtag #MyGateSquareUpgradeExperience, sharing your feedback a - 💥 Gate Square Event: #PostToWinFLK 💥
Post original content on Gate Square related to FLK, the HODLer Airdrop, or Launchpool, and get a chance to share 200 FLK rewards!
📅 Event Period: Oct 15, 2025, 10:00 – Oct 24, 2025, 16:00 UTC
📌 Related Campaigns:
HODLer Airdrop 👉 https://www.gate.com/announcements/article/47573
Launchpool 👉 https://www.gate.com/announcements/article/47592
FLK Campaign Collection 👉 https://www.gate.com/announcements/article/47586
📌 How to Participate:
1️⃣ Post original content related to FLK or one of the above campaigns (HODLer Airdrop / Launchpool).
2️⃣ Content mu - 🎒 Gate Square “Blue & White Travel Season” Merch Challenge is here!
📸 Theme: #GateAnywhere🌍
Let’s bring Gate’s blue and white to every corner of the world.
— Open the gate, Gate Anywhere
Take your Gate merch on the go — show us where blue and white meet your life!
At the office, on the road, during a trip, or in your daily setup —
wherever you are, let Gate be part of the view 💙
💡 Creative Ideas (Any style, any format!)
Gate merch displays
Blue & white outfits
Creative logo photography
Event or travel moments
The more personal and creative your story, the more it shines ✨
✅ How to Partici
Why Solana is likely to collapse to $105,000, according to expert
As Solana (SOL) trades just below the $200 mark amid broader market weakness, an analyst has suggested that the cryptocurrency could be on the verge of a sharp correction toward $105.
This outlook, shared by TradingShot in a TradingView post on October 21, is based on Solana’s trading pattern since bottoming out in early April. Since then, the token has moved within an upward channel, consistently forming higher highs and higher lows.
TradingShot TradingView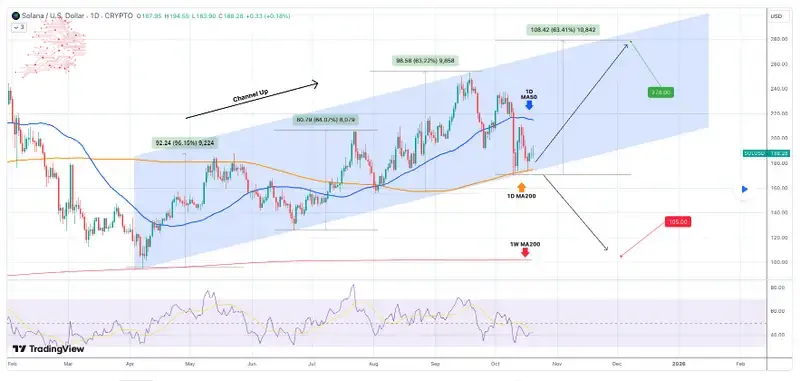 SOL price analysis chart. Source: TradingView**SOL price analysis chart. Source: TradingViewThe bullish structure has so far been supported by the 200-week moving average (MA), which acted as the foundation for the April rebound. However, the analyst noted that the latest pullback has exposed underlying weaknesses, bringing the token dangerously close to a key support level at the 200-day moving average around $165.
Despite holding this level on four successive tests, the outlook indicates that Solana’s price action shows signs of waning momentum. The Relative Strength Index (RSI) has softened, signaling fading bullish pressure, while the price remains squeezed between the short-term 50-day moving average at $194 and the long-term 200-day MA.
A decisive break below $165 could trigger a deeper selloff, aligning with the lower boundary of the ascending channel and potentially sending SOL back to the $105 region, coinciding with the 200-week MA support.
TradingShot’s model shows that Solana must hold above its 1D MA200 to avoid a breakdown of its bullish channel. A close below this level could trigger a reversal toward $105, while a holding firm could pave the way for a rebound toward $278
TradingShot’s ## SOL price analysis
By press time, Solana was trading at $188.94, down 1.3% in the past 24 hours, while on the weekly chart the token is down 3.5%
The 200-day SMA at $172.33 provides longer-term support, suggesting that while the broader trend remains intact, the asset is facing near-term headwinds.
At the same time, the 14-day RSI reads 42.34, placing Solana in neutral territory but leaning closer to oversold conditions. This points to consolidation rather than strong bullish conviction
Featured image via Shutterstock
Featured image via ShutterstockFeatured image via Shutterstock