Crypto trading tools combine on-chain data platforms such as Glassnode and CryptoQuant with charting and technical analysis platforms like TradingView to quantify capital flows, market sentiment, and price structure. These tools serve distinct roles—on-chain platforms expose blockchain-derived metrics and investor behavior, while TA platforms enable price pattern analysis and strategy testing—so practitioners typically use both types to form evidence-based observations.
2026-08-25 14:21:28
Reversal candlestick patterns are one- to multi-candle formations that can signal a potential change in an asset's prevailing price trend. When these patterns appear at significant support or resistance zones and align with momentum or volume confirmation, formations such as engulfing candles, doji-based stars, and three-candle sequences often reflect a shift in control between buyers and sellers. Reliable interpretation requires context, confirmation and awareness of limitations.
2026-08-25 08:41:16
Keltner Channels are generally better for tracking trend direction and smoother breakout conditions, while Bollinger Bands are usually better for identifying volatility expansion, compression and relative price extremes. For traders comparing Keltner Channels vs. Bollinger Bands, the choice depends less on which technical indicator is universally “better” and more on whether the objective is trend following or detecting unusually stretched price movements.
2026-08-25 07:20:21
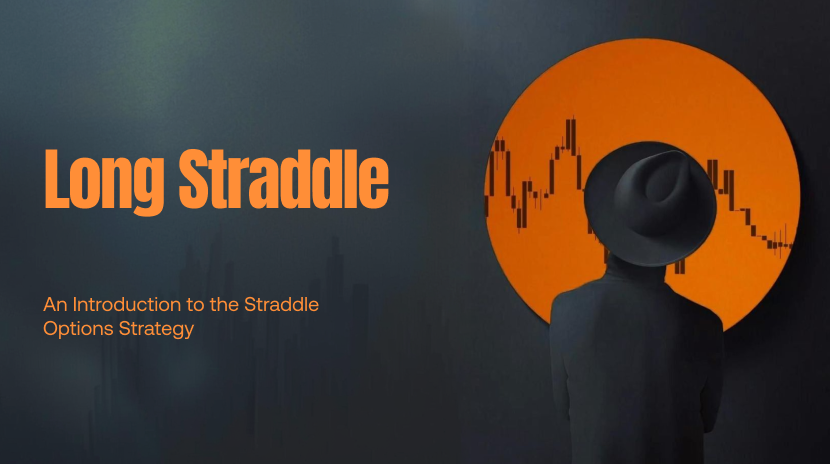
A straddle option strategy (long straddle) is a neutral options setup in which an investor buys both a call and a put with the same strike price and expiration to profit if the underlying—such as Ethereum (ETH)—moves significantly in either direction. The approach caps maximum loss at the combined premiums paid while exposing the position to implied volatility shifts and time decay; successful use depends on the size and timing of the price move.
2026-08-25 07:04:28
A long straddle is an options strategy that buys a call and a put on the same underlying, strike, and expiration to express a large-move, direction-neutral view. Maximum loss is limited to the combined premiums paid; outcomes depend on implied volatility, time decay, and how far price moves relative to two breakeven levels.
2026-08-25 06:28:49
Liquidity Provider (LP) tokens are transferable tokens that represent proportional ownership of a specific liquidity pool on an automated market maker (AMM) decentralized exchange. Holders can redeem them for underlying assets plus accrued fees, or transfer and stake them elsewhere, while facing risks such as impermanent loss and smart-contract failure.
2026-08-25 06:28:06
A range trading strategy targets repeated price swings between defined support and resistance. On liquid crypto markets such as Bitcoin and Ethereum, the pattern is to buy near the lower boundary, sell near the upper boundary, and place stop-losses outside the range, using technical confirmation and fixed risk rules.
2026-08-25 06:25:20
Kalshi and Polymarket are both prediction markets, but they differ mainly in regulation, market coverage, funding methods, and user experience as Kalshi is a CFTC-regulated exchange built around global event contracts and traditional funding methods, while Polymarket combines a regulated U.S. platform with a separate crypto-native international market offering broader coverage of politics, crypto, geopolitics, and culture.
2026-08-24 13:50:23
There is no single best time to sell Bitcoin. If you are asking when should I sell Bitcoin, the practical answer is: sell when your financial goals, time horizon, portfolio concentration, liquidity needs, tax consequences, or original reason for holding BTC have changed enough to justify reducing or exiting the position.
2026-08-24 09:25:33
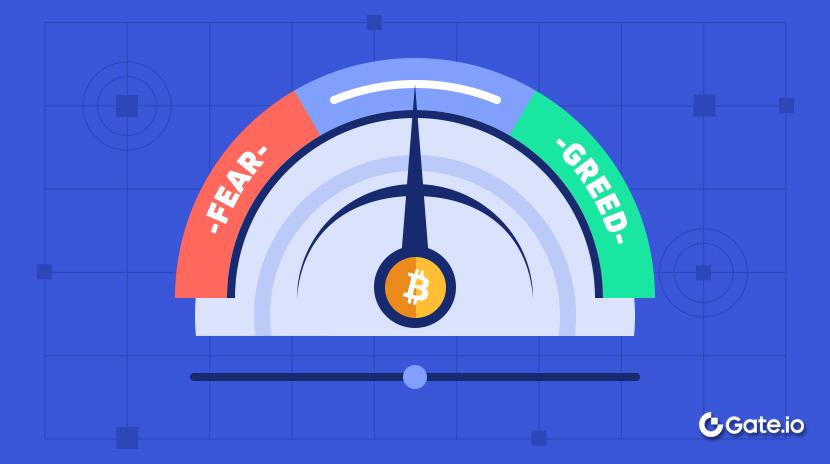
The cryptocurrency market is highly volatile, and prices are often driven by market sentiment. When the market is extremely optimistic, FOMO (Fear of Missing Out) spreads, and investors rush to buy, causing prices to rise rapidly. Conversely, when panic sets in, investors sell off their assets, leading to sharp price declines. In such situations, understanding market sentiment is crucial for traders. The Crypto Fear and Greed Index is a specialized indicator designed to measure market sentiment. This index not only helps investors gauge the current market sentiment but also serves as a reference for decision-making, avoiding blind chasing of rallies or panic selling.
2026-08-24 09:03:06
ATR is generally better for measuring the absolute size of price movement, while Bollinger Band Width (BBW) is better for showing whether volatility is relatively compressed or expanded. ATR expresses movement directly in price units; BBW measures the distance between the Bollinger Bands relative to their middle moving average. Comparing the two shows how each indicator is calculated, how their signals behave during low- and high-volatility conditions, and where each fits into practical market analysis.
2026-08-24 06:30:19
Bollinger %B is generally better for identifying where price sits relative to a volatility-adjusted range, while the Relative Strength Index is better for identifying momentum extremes. Bollinger %B shows whether price is near, inside or beyond the upper and lower Bollinger Bands, whereas RSI measures the strength of recent gains versus losses on a 0–100 scale. Comparing them side by side helps clarify how each indicator defines an extreme, when their signals may agree and when they can point to different market conditions.
2026-08-24 06:20:19
Hyperliquid is a decentralized exchange focused on on-chain perpetual futures trading. This article explains what Hyperliquid is, how it works, its advantages, risks, and how to use it.
2026-08-24 06:10:07
Dogecoin (DOGE) is an open-source, peer-to-peer digital currency based on the Scrypt algorithm, originally born as a technical fork of Litecoin. Despite its origins in the absurdity of meme culture, its exceptional transaction efficiency and ultra-low fees have allowed it to evolve into a significant instrument in the crypto payment landscape.
2026-08-24 06:04:46
RSI is generally better for measuring broader momentum and trend strength, while Stochastic RSI is better for detecting faster momentum shifts and timing short-term entries. This comparison explains how the two indicators are calculated, how their signals differ, and when each one may be more useful. It is intended for retail traders and new technical traders choosing between momentum indicators, because using the wrong oscillator for the current market condition can create late entries, premature exits, or repeated false signals.
2026-08-23 16:59:45