This article builds on stablecoin supply contraction as the definition and net-issuance frame. It focuses on the payments-versus-trading split that often confuses dashboards that show “busy chains” next to a shrinking or sideways total stablecoins market-cap line. The goal is to explain why transaction volume and everyday payment use can climb while the outstanding share of dollars locked in USDT, USDC, and peer issuers does not have to expand at the same pace.
Key Takeaways
- Circulating supply is a stock; payment volume is a flow—busy rails do not require a larger float if the same tokens turn over faster in day-to-day use.
- Gross minting and redemptions can both be large while net issuance is near zero, so the total float barely changes even when primary services stay busy.
- Trading-driven demand for new stablecoin liquidity on exchanges can fall even as consumers, merchants, and businesses expand payment use.
- Opportunity cost and non-stablecoin on-chain cash products can cap appetite to park idle dollars that pay no bank-like yield.
- Read payment volume metrics and supply metrics as complementary estimates, not interchangeable adoption signals for the whole crypto market.
Supply Is a Stock; Payments Are a Flow
Circulating supply asks: how many stablecoin tokens are outstanding right now? Payment volume and transaction counts ask: how many times value moved over a window? What stablecoin supply actually measures is the outstanding float of cash-like tokens—not trading intensity, not Total Value Locked in DeFi, and not “dry powder” parked only on exchanges. One wallet can pay many counterparties with the same dollars of USDC without any new minting. In that sense, velocity substitutes for float expansion and lets payment use scale on a relatively fixed inventory.
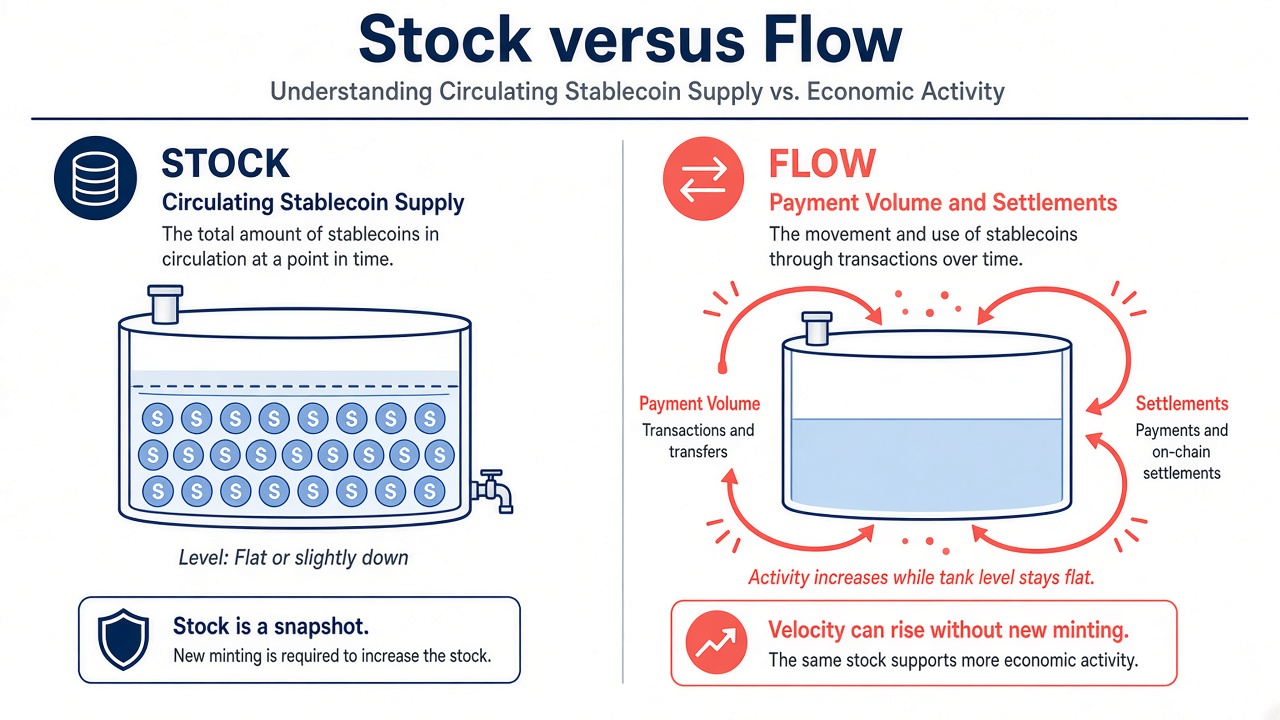
Figure 1. Left: circulating supply (stock) can stay flat or fall. Right: payment and settlement flows can still rise via higher velocity.
Media coverage through 2026 has highlighted periods when aggregate stablecoin market value—the total stablecoins market cap that many dashboards quote—moved little while reported payment notional and transaction volume rose substantially. Estimates from blockchain data firms and issuer disclosures can differ on exact dollars, but the mechanism behind those headlines is consistent once stock and flow are separated: activity can scale on a roughly fixed inventory of tokens.
Adjusted volume methodologies matter here. Raw on-chain transfer volume can double-count hops through bridges, exchanges, or mixers, so researchers often publish filtered estimates of “economic” or “adjusted” payment volume. Those cleaner estimates can still rise while circulating supply is flat. Tracking transaction volume therefore answers a utility question—how intensively people use stablecoins—rather than a float question—how large the outstanding share of dollars in stable form has become.
Businesses that settle invoices, pay suppliers, or run point-of-sale style crypto acceptance can increase payment volume without asking issuers to mint more tokens if existing balances already sit with treasurers, processors, or wallet services. Retail remittance use follows the same logic: repeated small transfers recycle the same float. Global trends in stablecoin transaction volume therefore track settlement activity and network choice as much as they track new issuance; drivers behind volume growth often include cheaper rails, merchant tooling, and cross-border payout activity rather than a larger warehouse of idle tokens.
Trading Liquidity Demand vs Payment Turnover
Much historical minting demand came from traders who needed dollar tokens as the quote asset for spot pairs, as collateral, or as dry powder on exchanges. When trading volume on major crypto exchanges cools, authorized demand for new minting can fall even if existing tokens remain in wallets or move through payment services. Exchange order-book use and consumer payment use are related dollar rails, but they do not share one demand curve.
Payment and settlement use cases—remittances, merchant settlement, payroll experiments, wallet-to-wallet transfers—can grow on a different curve. Those flows often recycle existing balances. Circle-style disclosures have shown quarters where minting and redeeming were both very large and nearly offset, leaving circulating USDC little changed despite heavy primary activity. That pattern is compatible with a payments boom and rising adoption of settlement services that does not expand net float.
Concentration also matters. A rising share of payment volume on a few chains or a few issuers can look like “crypto payments adoption” in headlines while the total circulating supply across all issuers stays sideways. USDT’s market share of the total stablecoins market cap can even tighten during a contraction if other issuers redeem faster—another reason not to read one ticker as the whole market. Always ask whether the volume series is global or venue-specific, and whether the supply series is aggregate or ticker-level. Beyond the contraction definition, stablecoin net issuance breaks mint and redeem into a checkable net change.
Businesses and payment processors may prefer to keep working capital lean: they use stablecoins as a transit layer into local currency or bank accounts rather than as a large idle reserve. That operating style lifts measured payment volume and settlement counts without a matching rise in outstanding dollars counted as stablecoin supply.
Offsetting Mint and Redeem: Busy Primaries, Flat Float
Primary markets can be extremely active without changing the end-of-period float. If eligible institutions mint a large dollar amount and redeem about the same amount in the same quarter, gross activity is roughly double while net issuance is near zero. Dashboards that only plot circulating supply will look “frozen” even though the issuer’s operational pipes and bank-connected redemption services were busy moving dollars on and off crypto rails.
Secondary-market trading of the peg can also stay lively without minting. Peg defense and arbitrage often involve inventory already in circulation across exchanges, OTC desks, and market-maker wallets. That inventory churn can add to observed transfer volume without changing the total outstanding share of tokens—the secondary side of stablecoin primary and secondary markets.
When analysts publish estimates of “utility” they sometimes compare adjusted payment volume to market cap (a velocity-style ratio). That ratio can rise while market cap—the total dollars represented by circulating supply—falls or stalls. The divergence is expected if the same float is put to more frequent use by households, businesses, and on-chain services.
Redemptions that send dollars back to a bank account shrink float; payments that leave dollars inside crypto wallets do not. Confusing those two paths is a common reason people assume every busy payment week must expand supply.
Why Holders May Prefer Not to Expand Idle Float
When short-duration government yields are attractive, holding large non-interest-bearing payment balances can look costly relative to T-bills, money-market funds, or tokenized cash products. Some capital may leave the counted “stablecoin supply” category without leaving digital finance: treasurers at businesses and crypto-native funds can park dollars in instruments outside the stablecoin total while still using stablecoins as a thin transit layer for payments.
Regulatory designs that limit issuer interest payments to holders can reinforce that opportunity-cost dynamic for idle balances, even as payment rails and merchant services keep growing. In that setting, adoption of payment use can rise while the willingness to warehouse large stablecoin balances falls. None of these points recommend a trade; they explain why payment volume growth and float growth can decouple, and why bank cash, on-exchange balances, and circulating supply can diverge in the same month.
Illicit-use and compliance screening also affect how researchers interpret volume. Compliance teams at exchanges and payment services may filter or delay flows; published volume estimates therefore already embed assumptions about which transfers count as economic use. Flat supply alongside rising filtered volume still fits a velocity story rather than a contradiction. Looking ahead, the future of onchain settlement can keep expanding payment activity on a slow-growing float if wallets, banks’ on-ramps, and merchant services keep recycling the same dollars more efficiently.
How to Read the Divergence
- Plot circulating supply (stock) and payment/transfer volume (flow) on separate mental axes; never treat one chart as a substitute for the other.
- Check issuer net issuance, not only gross mint headlines or a single day’s volume spike on exchanges.
- Compare trading-volume trends with payment-volume trends when both estimates are available, and note whether businesses or retail use dominate the payment series.
- Ask whether capital rotated into non-stablecoin cash products that some indexes exclude from the total stablecoin share of dollars.
- Use how to read stablecoin liquidity for exchange balances as a third series alongside bank-redemption signals and on-chain payment volume.
- Prefer methodologies that publish adjusted volume estimates when raw crypto transfer volume looks inflated by wash hops or internal services.
Summary
Payments can rise while stablecoin supply stalls or contracts because float is not turnover. Trading-driven mint demand on exchanges, velocity in everyday payment use, offsetting primary flows through bank-connected services, and opportunity cost on idle dollars all help explain the split. Businesses can increase settlement volume and adoption of payment rails without expanding the total circulating share of stablecoins. Read the payments split together with the contraction definition before treating any single dashboard line as a market verdict for crypto.
FAQ
Why can stablecoin payments rise while supply falls?
Because supply counts outstanding tokens and payments count movement. The same tokens can settle more activity if velocity rises, or mint/redeem can offset so float does not grow even while payment use and volume climb.
Does higher payment volume require more stablecoin issuance?
Not necessarily. Issuance expands float when net minting is positive. High turnover can serve more payments for households and businesses on a similar float, especially when dollars recycle through wallets, processors, and exchanges without returning to a bank via redemption.
What is the difference between gross minting and net issuance?
Gross minting is new tokens created; net issuance subtracts redemptions. Large gross minting with matching redemptions can leave circulating supply—and the total dollars counted in market-cap estimates—almost unchanged while primary services stay busy.
Is flat stablecoin supply always bearish for crypto?
No. Flat supply can reflect recycled balances, payment growth without new trading liquidity demand on exchanges, or rotation across cash products outside the stablecoin share of on-chain dollars. It is context for crypto adoption narratives, not a standalone crash signal.
Where should readers start if they only want the definition?
Start from the definition and net-issuance frame for stablecoin supply contraction, then use this page for the payments-versus-float split, volume reading tips, and how businesses use stablecoins without expanding idle float.