For traders and investors trying to understand why Bitcoin rallies, separating these Bitcoin rally drivers matters. A price move supported by sustained spot buying can behave differently from one driven mainly by derivatives and liquidations. Looking at demand, liquidity, leverage and price action together makes it easier to assess what is actually powering a move, rather than simply chasing price after momentum appears.
Key Takeaways
-
Bitcoin rallies are usually produced by several interacting forces rather than one news event or technical indicator.
-
Spot demand and institutional flows can create the underlying buying pressure, while derivatives may accelerate the price move.
-
Expanding global liquidity, falling yields or a weaker dollar can improve conditions for scarce and risk-sensitive assets such as Bitcoin.
-
Bullish market structure can attract momentum traders once previous resistance breaks.
-
Short squeezes can make a rally much faster, but liquidation-driven gains aren't necessarily evidence of lasting demand.
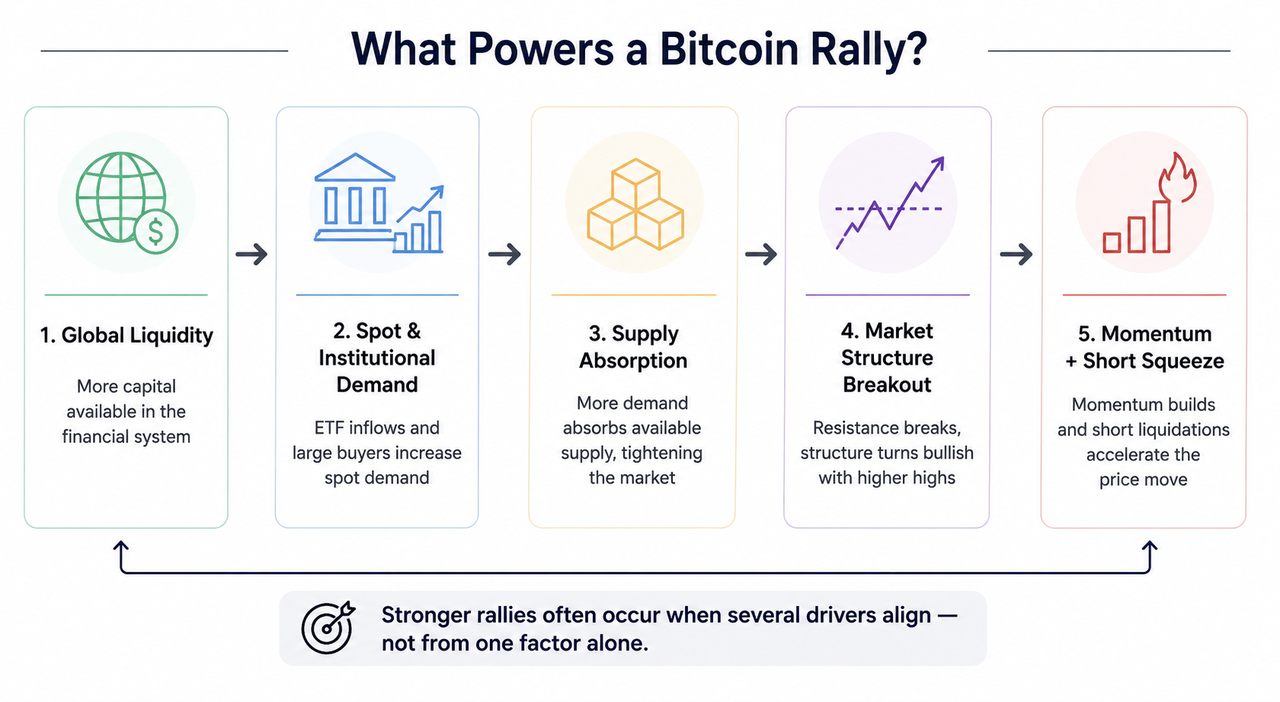
Bitcoin Rally Drivers: A Causal Framework
The simplest way to understand a Bitcoin rally is to separate primary demand from amplifiers.
Spot buyers purchasing actual BTC create direct demand. Bitcoin exchange-traded funds, companies, asset managers, funds and individual investors can all contribute. Because the amount of Bitcoin immediately available for sale is limited, persistent buying can raise the market price until enough sellers appear.
Other forces amplify that movement. Futures positioning, short liquidations, algorithmic trading and momentum strategies can accelerate an existing trend. Sentiment and regulatory expectations may bring additional buyers into the market.
A useful framework is:
Macro liquidity → capital availability → spot and institutional demand → supply absorption → breakout → momentum and liquidations → faster price appreciation
The order isn't fixed. Sometimes a regulatory announcement starts the process. In other cases, institutional accumulation occurs quietly before price action attracts broader attention.
How Spot Demand Changes the Market Price
Spot demand is one of the clearest BTC rally factors because each transaction involves a buyer taking BTC from a willing seller.
Price rises when buyers become increasingly willing to pay higher prices while sellers aren't willing to supply enough BTC at the existing level. Strong trading volume accompanying the move can indicate that substantial transactions are occurring rather than price drifting upward in a thin market.
Spot Bitcoin ETFs added another route through which traditional financial-market capital can obtain Bitcoin exposure. When ETF creations translate investor inflows into underlying BTC demand, persistent inflows can tighten the balance between available supply and buyers. The mechanism behind how Bitcoin ETF inflows affect price depends on creations, redemptions and the amount of available liquidity rather than ETF headlines alone.
A recent example illustrates the mechanism without turning it into a universal rule. U.S. spot Bitcoin ETFs recorded net inflows of about $297.5 million on August 17, $189.3 million on August 18 and $517.2 million on August 19, 2026, according to Farside Investors.
Institutional demand isn't automatically bullish every day. Funds can redeem shares, rebalance portfolios or hedge exposure through derivatives.
Why Institutional Demand Can Move Bitcoin
Large participants approach liquidity differently from many smaller traders. An institution managing a large order usually can't simply submit the entire transaction at the current market price without risking slippage.
Trading desks commonly divide large orders and use execution algorithms that distribute transactions across time, prices or venues. Their focus is often liquidity: finding areas where sufficient buyers and sellers exist rather than chasing price movements after a breakout.
Repeated large transactions can create institutional liquidity zones where meaningful supply and demand have previously interacted. These flows may influence price before familiar technical indicators clearly react because indicators generally derive their signals from price or volume that has already changed.
Institutional buying still shouldn't be treated as a guaranteed rally signal. Institutions also sell, hedge with futures and options, and alter allocation plans as risk conditions change.
Liquidity and Why It Matters for Bitcoin
Liquidity has two different meanings in this discussion.
Market liquidity describes the ability to buy or sell an asset without causing a large change in price. Highly liquid assets generally have deep order books, substantial volume and narrower spreads. Less liquid markets can produce larger price moves from the same amount of buying.
Global or monetary liquidity concerns the amount and availability of money and credit across the financial system. Easier financial conditions can encourage investors to allocate more capital toward equities, crypto and other risk-sensitive assets. The relationship between global liquidity and Bitcoin is therefore one potential macro transmission channel, not a mechanical formula.
For example, the U.S. Treasury announced in August 2026 that it would double certain long-duration bond buybacks to at least $4 billion per operation. The announcement initially pushed long yields lower and weakened the dollar while Bitcoin and gold rose. The Treasury operation wasn't equivalent to quantitative easing, however, and analysts questioned how persistent its market impact would be.
A weaker dollar can sometimes increase interest in scarce assets denominated in dollars, but Bitcoin doesn't respond to the dollar in exactly the same way during every market regime.
Why Cash Ratio and Quick Ratio Aren't Bitcoin Liquidity Indicators
The word liquidity can create confusion because financial analysis uses it in several ways.
A company's cash ratio compares cash and cash equivalents with current liabilities. The quick ratio considers liquid current assets such as cash, marketable securities and usually accounts receivable against short-term obligations. Businesses use these liquidity ratios to assess a company's ability to pay near-term debt without relying heavily on inventory.
Those ratios don't measure Bitcoin market liquidity.
For BTC, traders are more interested in trading volume, order-book depth, spreads, available supply and the ability to complete transactions without sharply moving price. Stocks and bonds traded actively on exchanges are also examples of relatively liquid assets, whereas some property or private-market assets may take much longer to sell and convert into cash.
Market Structure and Price Action During a Rally
Market structure describes how successive highs, lows, support areas and resistance zones organize price movements over time.
During accumulation, buyers may repeatedly absorb supply within a range. If demand ultimately exceeds selling pressure, price can break above resistance. Traders sometimes call a decisive move above a significant previous swing high a Break of Structure (BOS), particularly when it supports continuation of an existing bullish trend.
A typical bullish sequence might look like:
Accumulation → higher low → resistance break → higher high → pullback → continuation
Market structure helps traders identify what price is doing, but it doesn't explain every cause behind it. A breakout could reflect genuine spot accumulation, leveraged speculation or both.
Bitcoin's historical cycles also show why one indicator or event shouldn't be treated as destiny. Even the relationship between halvings, supply and bull markets has changed as ETFs, derivatives and institutional participation have altered Bitcoin's market-cycle structure.
For a live example, traders can compare volume and price structure on the BTC/USDT spot market on Gate.com or use Bitcoin price data on Gate.com to examine how highs, lows and turnover change during different market conditions.
How Short Squeezes Accelerate Price Moves
Derivatives can turn an ordinary rally into a rapid one.
Suppose many traders have shorted Bitcoin using futures contracts because they expect the market to fall. If spot demand instead pushes BTC upward, leveraged shorts begin losing money. Some traders voluntarily buy back BTC exposure to close positions. Others reach liquidation thresholds and are forcibly closed.
Those purchases add more upward pressure.
Price rises → shorts lose money → shorts close or liquidate → additional buying occurs → price rises further.
That feedback loop is a short squeeze. The mechanics of short liquidations during Bitcoin rallies explain why price can suddenly travel through several resistance levels once heavily leveraged positioning becomes unstable.
General crypto liquidation mechanics also show why leverage magnifies both gains and losses.
The catch is that liquidation buying can disappear quickly. Once vulnerable shorts have been removed, continued appreciation needs fresh buyers.
Sentiment, Regulation and Momentum
Narratives influence how investors interpret the same economic data.
Positive regulatory developments, institutional adoption, ETF demand or expectations of easier monetary conditions can improve sentiment. In August 2026, for instance, U.S. political discussion around the Digital Asset Market Clarity Act added to positive crypto sentiment. The proposed legislation aims to clarify parts of the federal regulatory framework for digital assets, but as of August 24 it had not become law and remained headed toward further Senate proceedings in September.
Once price begins moving, momentum can become another driver. Breakouts attract systematic strategies and traders waiting for confirmation. Buyers who previously planned to wait may enter as volatility rises.
That doesn't mean sentiment creates unlimited demand. If speculative positioning grows faster than underlying spot buying, a rally may become increasingly dependent on leverage.
How to Assess Whether a Bitcoin Rally Has Support
Instead of looking for one perfect indicator, assess whether several independent factors agree.
Strong rallies may combine rising spot volume, positive institutional flows, improving macro liquidity, constructive market structure and manageable leverage. A rally dominated by derivatives while spot demand stays weak has a different risk profile.
The distinction matters most near rapid price moves. High volume isn't automatically bullish, ETF inflows can reverse, macro conditions can change and a Break of Structure can fail.
Bitcoin rallies are ultimately dynamic interactions between buyers, sellers, available supply, money, derivatives and expectations.
Risks and Limitations
No combination of Bitcoin rally drivers guarantees that price will keep rising. Markets can reverse when institutions take profits, ETF flows turn negative, monetary conditions tighten or sellers appear at higher prices.
Leverage creates another vulnerability. The same derivatives mechanism that causes short liquidations on the way up can create cascading long liquidations during a decline.
Data also needs context. Exchange volume can differ across venues, institutional trades may be hedged elsewhere, and on-chain transfers don't always represent buying or selling. Technical market structure describes observed price behavior rather than future certainty.
Conclusion
A sharp Bitcoin rally is most convincing when several forces align. Spot buyers create underlying demand, institutions can absorb meaningful supply, favorable liquidity conditions increase available capital and bullish market structure attracts additional participation. Derivatives then have the ability to accelerate the move through momentum and short liquidations.
The practical question isn't simply “Why is Bitcoin rising?” It is “What kind of demand is pushing it higher, and can that demand persist?”
Separating durable buying from temporary leverage makes Bitcoin price drivers easier to interpret. It still can't predict the next move with certainty, but it gives investors and traders a clearer framework for judging what is actually happening beneath the price chart.
FAQ
What is the main driver of a Bitcoin rally?
There is no single main driver in every rally. Sustained spot demand relative to available supply is fundamental to higher prices, while institutional flows, macro liquidity, sentiment and derivatives can strengthen or accelerate the movement.
Do Bitcoin ETF inflows always make Bitcoin rise?
No. ETF inflows can add spot demand, but Bitcoin's market price simultaneously reflects selling pressure, derivatives positioning, macro conditions and activity on other exchanges. Large inflows can therefore occur without an immediate rally.
How does liquidity affect Bitcoin price?
Greater global liquidity can increase the amount of capital available for risk assets, while market liquidity determines how easily BTC can be traded without moving price significantly. These are related but distinct concepts.
What is a Break of Structure in Bitcoin trading?
A Break of Structure generally occurs when price decisively moves beyond an important previous swing high or low. In a bullish structure, breaking a prior high can support a trend-continuation interpretation, although false breakouts remain possible.
Why do short liquidations push Bitcoin higher?
A short position must effectively be bought back when it closes. When many leveraged shorts are forced to close during a rising market, that additional buying can accelerate the rally and create a short squeeze.
Can regulation cause a Bitcoin rally?
Regulatory developments can affect sentiment and institutional willingness to participate, but their impact depends on what actually changes. Proposed legislation, political statements and enacted rules should be distinguished because markets may react before any legal change takes effect.
Disclaimer: This content is for educational purposes only and does not constitute financial or investment advice. Cryptocurrency prices can be highly volatile, and historical market relationships, technical structures and institutional flows do not guarantee future results.