The label is unusually broad, so the arithmetic comes before the narrative. A positioning network that bills enterprises for centimeter-level corrections and a training-data market that pays contributors in newly issued tokens both report revenue, but only one reports money arriving from outside the network; the four-layer robotics token market separates those models, and the revenue check below only applies once the model is named.
Two dated figures show why a category total is not an income statement. CoinGecko listed roughly 849 million USD of market capitalization across its robotics category on 23 October 2026, while peaq's economics page showed 512,065 USD of trailing-twelve-month activation revenue against 0.00 USD of coordination and service revenue. The category is priced on a narrative; its cash flows are small and often off-chain.
Key Takeaways
- Revenue has four lines: gross fees, supply-side fees, protocol revenue, and holder revenue. Only the last line is a claim on the token.
- A dashboard that derives revenue from token burns cannot independently validate a burn rule, because the same number is used twice.
- Related-party payments and emission-funded activity look like demand until wallets are clustered and fees are compared with annualized emissions.
- Reproducing fees, stripping affiliates, comparing emissions, testing retention, and auditing burns bound the real number from above and below.
What Do You Need Before You Start a Revenue Check?
Fix three parameters and one method before running any arithmetic: the measurement window, the unit, the definition, and the approach used to normalize transfers. A robotics token analysis also spans technology, economics, security, governance, and data transparency, but the revenue check needs nothing beyond those four choices. Common calculation approaches differ mainly in how they treat refunds, incentive payments, and transfers between addresses controlled by the same operator. A 30-day window smooths weekly reporting noise; a twelve-month window captures seasonality; a token-denominated total is not comparable across assets without a price basis. The definition matters most, because gross fees, protocol revenue, and holder revenue differ by factors of five or more in the same network. The practical way to analyze robotics tokens is to reproduce fee inflows from on-chain transfers, strip out team and affiliated wallets, compare fees with emissions, test payer retention after incentives end, and audit buyback-and-burn claims against the rule. Because robotics tokens connect software incentives with physical hardware, credibility depends not just on token flows but also on whether governance structures are believable and whether the project provides transparent data that can be checked.
| Source |
What it answers |
What it cannot answer |
| Block explorer |
Transfer history, payer addresses, contract creation, burn transfers |
Whether the payer is a customer or an affiliate; off-chain fiat receipts |
| Revenue dashboard |
A normalized time series for one definition of fees or revenue |
Whether the series is derived from the same event it claims to measure |
| Project documentation |
The stated fee rule, allocation, and burn policy |
Whether the rule is followed in practice |
| Unlock calendar |
Emission schedule measured in tokens |
The dollar value of those emissions, or whether demand exists |
| Treasury and governance forum |
Who controls spending and distributions |
Operating revenue from customers |
The explorer is the only source that records what actually moved, so every later step returns to it. Data sources disagree often enough that the first task is to fix which one is authoritative for the fee definition being tested. Dashboards compress that history into a definition, and fee-calculation implementations vary between providers, so two dashboards can report different revenue for the same network. Documentation states an intention, and the unlock calendar prices dilution. None of the five replaces reading the transfer log against the stated rule. Real-world utility and hardware viability also matter, because the question is whether external demand supports the token.
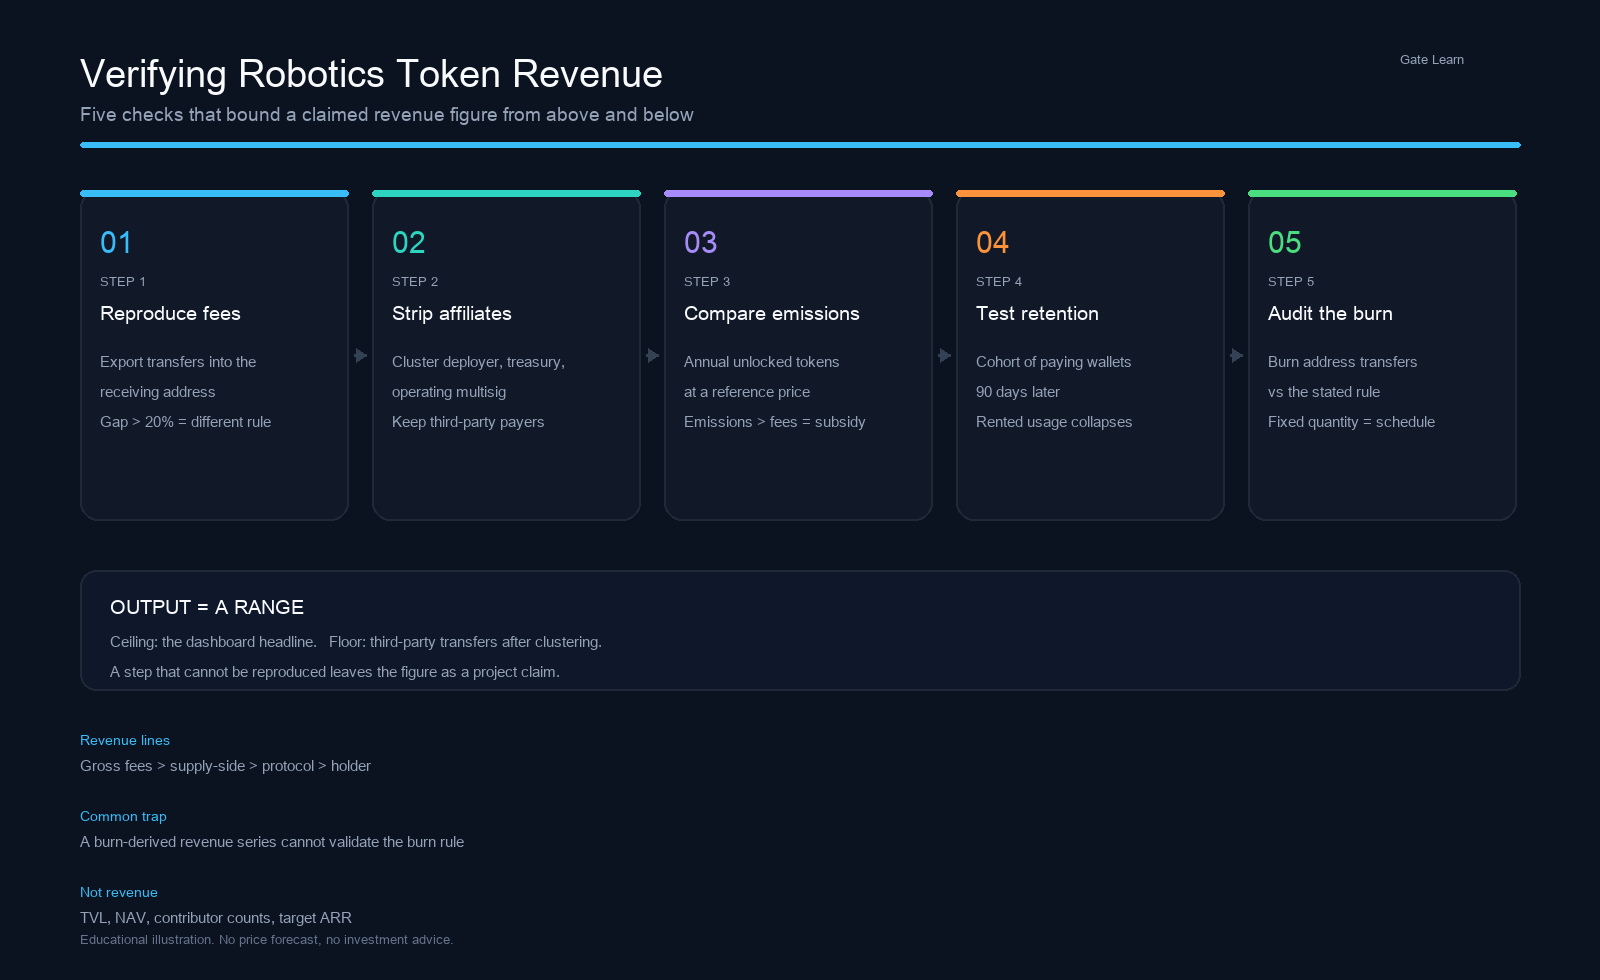
Figure 1. The five-step revenue check moves from raw transfers to affiliate removal, emission comparison, retention testing, and burn auditing.
Step 1: How Do You Reproduce the Headline Revenue Number and Total Fees?
Start from the receiving address, not the dashboard. Open the fee-receiving contract or treasury address in a block explorer, export token and native transfers for the stated window, and sum inflows on each chain the network uses. If the result differs from the published number by more than 20 percent, the project is counting something else: team top-ups, refunds, emissions through the same address, or multiple chains.
The standard definitions of fees, revenue, and holder revenue usually explain the gap. Gross inflow counts every transfer into the address, including the team's own funding. Net fees subtract refunds and returned balances. Third-party fees count only wallets outside the team cluster, and that is the figure worth carrying forward. Recurring and one-time revenue should be counted separately, because one integration payment can flatter a month without changing the year. A robotics network that routes contributor rewards through the same contract it uses to collect sponsor payments will show a large gross inflow with almost no external demand.
Axis Robotics illustrates the reporting gap without implying misconduct. The project reports more than 5.5 million accepted trajectories from over 200,000 contributors, and its published roadmap targets 1 million USD or more of annual recurring revenue by the end of 2026. Framework agreements it says exceed 1 million USD in total have not been independently verified. A contributor count, a signed framework, or a demo showing a robot arm completing tasks do not substitute for sponsor-wallet transfers because they describe supply, intent, or usage rather than cash received.
Step 2: How Do You Strip Out Team and Affiliated Wallets?
Identify the deployer first, then cluster outward. The contract's creation transaction names the address that deployed it, and that address usually funds the treasury, the operating multisig, and the wallets that pay contributors. Labelling those addresses turns a headline inflow into a payer list, and the payer list is what separates a customer from a circular transfer.
-
Pull the deployer address from the creation transaction, then list every address that received funds from it within two hops.
-
Mark known labels: treasury, team vesting, market maker, exchange deposit addresses, and the contributor reward distributor.
-
Rank payers by inflow and compute the third-party share, then check concentration. Separate recurring customers from one-off test or affiliate wallets. If the top five payers supply more than half of third-party fees, the demand base is thin regardless of the total.
Wallet clustering is probabilistic, so record the rule rather than a verdict. Two addresses funded from the same source may be one operator or one market maker; the output is a range. For a network that sells positioning corrections, the cluster should be small, because enterprise buyers are few and identifiable.
Step 3: How Do You Compare Transaction Fees With Token Emissions?
Convert the annual emission schedule into dollars, then compare it with third-party fees. Annualized revenue is a run-rate from a short window, not a receipt, so the comparison holds only when both sides share the window and the price basis. The emission budget is the number of tokens scheduled to enter circulation over twelve months multiplied by a stated reference price, because reference windows and price bases vary between dashboards. Comparing fees with market cap, rather than with another project's fee total, keeps the denominator consistent across assets. Emissions include contributor rewards, device subsidies, liquidity incentives, and anything else paid in newly issued tokens.
| Metric |
How to derive it |
Healthy pattern |
Warning pattern |
| Third-party fees |
Inflows from clustered-out wallets |
Grows without new incentives |
Flat while emissions rise |
| Emission budget |
Annual unlocked tokens at a reference price |
Below third-party fees |
Above third-party fees |
| Revenue take rate |
Protocol revenue divided by gross fees |
Stable across quarters |
Falls as volume grows |
| Accrual ratio |
Holder revenue divided by protocol revenue |
Above zero and rising |
Zero, with fees parked in a treasury the token cannot touch |
The two ratios are worth separating because they fail independently. A network can keep a healthy share of gross fees and still route none of it to holders, which is a revenue model for the protocol and not for the token. The crypto revenue definition used by data providers follows the same logic: fees are what users pay, while revenue is the value that reaches tokenholders through a treasury, burns, buybacks, or distributions, before operating expenses and emissions. Others earn that flow from service payments that never appear as an on-chain fee. For example, a network that bills per correction needs a different revenue metric from one that charges a flat subscription. Real yield only exists when holder revenue is funded by third-party payments rather than by emissions.
An emission-heavy network can show rising activity for months while paying customers stay flat, because the token is buying the activity it reports. When the emission budget exceeds third-party fees, the visible usage is a customer acquisition cost paid in dilution, and the network has not yet proved that anyone would pay for the service without it. That describes the mechanism, not the asset; early networks may rationally subsidize supply while demand is built. The network still needs a real product buyers will pay for once subsidies fade.
Step 4: What Is Left After the Incentives End?
Measure payers, not contributors. Take the cohort of addresses that paid in a given month, then check how many paid again 90 days later, and how many payment attempts reversed, before comparing that retention rate with the period before and after a rewards program ended. A network whose activity falls by 90 percent when emissions stop was renting its usage; a network that retains payers through the transition has a business underneath the incentives.
Contributor metrics belong on the supply side of the ledger. Trajectory counts, device registrations, and app downloads describe capacity, and capacity can be bought. Axis Robotics again provides a clean example: a 200,000-person contributor base and millions of accepted trajectories show that data can be produced at volume, while the commercial question is how many sponsors renew.
Post-incentive retention is the least cited and most informative test, because it is expensive to fake. A team can fund wallets to transact once, and it can pay contributors in tokens, but it cannot make unrelated enterprises renew a subscription they do not need. Read retention beside concentration: high retention from three payers is fragile, and low retention from a thousand payers is churn.
Step 5: How Do You Audit a Buyback-and-Burn Claim?
Compare the stated rule with the burn address, not the dashboard. Read the rule, convert it into a monthly implied amount from reported revenue, then build a monthly burn ledger from every transfer into the burn address and price it at the reference rate, noting the trade-off between daily and monthly averaging. A revenue-linked burn should move with revenue; a fixed daily quantity is a schedule that happens to be described as a revenue share.
GEODNET, a GNSS correction network used by robots and drones, publishes one of the cleanest rules in the category: customers pay in fiat, 80 percent of revenue buys GEOD on the open market and burns it, and 20 percent covers foundation costs. A third-party review counted 50 transfers into the burn address between 2 July and 20 August 2026, totalling 1,745,000 GEOD, 49 of them at exactly 35,000 GEOD. At the price used in that review, the burn was worth about 285,636 USD per 30 days against an implied 737,998 USD from the 80 percent rule, and the observed burn equalled 38.7 percent of the stated obligation.
Batch purchases, settlement timing, and price basis explain part of that gap, but not a factor of 2.5, and not a fixed burn while revenue rises. The behaviour fits a quantity schedule, not a percentage of receipts. The practical test is correlation: plot monthly revenue against monthly burn value and check whether they move together.
There is a second trap in the same case, and it applies across the category. The DefiLlama adapter for GEODNET states that fees are inferred from GEOD burns, because burns represent 80 percent of total fees, so total equals burns divided by 0.8. The revenue series is therefore the burn multiplied by the rule, which means a dashboard check cannot validate the rule itself and the burn-derived series should not be treated as independent yield or operating income. On-chain revenue is not the same thing as a buyback or a burn: the burn is a use of revenue, not revenue itself. As of 23 October 2026 the same series showed 919,182 USD for 30 days and 9.59 million USD for twelve months, and those numbers are arithmetically faithful but methodologically circular. The only independent evidence is enterprise receipts, an auditor attestation, or a burn series that varies with reported revenue.
What Are the Common Mistakes, and Where Does Market Cap Mislead?
The most common errors share one structure: a stock or a plan is read as a flow. Total value locked is a stock that moves with prices and double counts. Net asset value belongs to a tokenized equity basket, not to a protocol that sells services. Contributor counts and device registrations are capacity. A target ARR is a plan, and exchange volume is not revenue unless the venue keeps a fee.
| Claim |
Why it misleads |
What to read instead |
| Total value locked |
Rises with token prices and rented liquidity |
Fees paid, denominated in a stable unit |
| Net asset value |
Belongs to a fund structure, not an operating network |
The basket's holdings and its fee drag |
| Contributors or trajectories |
Supply-side capacity, often emission-funded |
Paying sponsors and renewal rate |
| Target ARR |
A forecast, not a receipt |
Third-party fees collected to date |
| Reported revenue on a dashboard |
Methodology may be derived from the same event |
The underlying transfer log |
The method also has limits that no amount of diligence removes. It cannot prove that a robot performed a physical task; it can only show that a payment was made and a record was written, which is why proof of physical work remains a design problem rather than an accounting one. It cannot see enterprise payments settled in fiat outside the chain, and it cannot price a private contract. The output is a bounded estimate, with a defensible ceiling from the dashboard and a defensible floor from third-party transfers.
Those bounds answer a narrow question well: is the revenue external, recurring, and routed to holders? They do not answer whether the token is worth holding, and they do not replace a supply check. Circulating supply, the unlock schedule, and the gap between market cap and fully diluted valuation determine how much each dollar of revenue is being asked to support, which is the next calculation after the revenue check, not part of it.
Summary
Verifying robotics token revenue is an exercise in removal: team funding, emissions, stocks that look like flows, and rules that are only described. What remains is a payer list, a retention rate, and a burn that either tracks revenue or does not. None of those numbers requires a price forecast, and all can be reproduced from a block explorer and a public document. The value is that it turns a narrative into a testable claim. A failed claim is still information.
FAQ
Which revenue number should I trust first?
Start with third-party fees: inflows from wallets that are not funded by the deployer, the treasury, or the team. Gross inflow overstates demand because it includes the team's own funding and refunds, while holder revenue is often zero even when protocol revenue is real. The third-party figure is the smallest defensible number and the hardest to manufacture.
Can a project's published burn data be trusted?
Only after the burn address is checked directly. Export every transfer into that address, price it at a stated rate, and compare the result with the implied amount from the rule. A burn that stays at a fixed daily quantity while revenue rises is a schedule, not a revenue share, even when the destination address is genuine.
Can contributor counts and trajectory volume be treated as revenue?
No. Contributors and trajectories measure supply-side capacity, and that capacity is frequently paid for with newly issued tokens, so a robot arm completing grasps is operational activity rather than revenue. Revenue requires a payer outside the network who buys a service and would buy it again. Contributor growth alongside flat sponsor demand is evidence of subsidy rather than adoption.
Does high token emissions mean the revenue is fake?
Not necessarily. Include all attempts in that comparison, not only successful outcomes, when judging whether subsidized activity is economically real. Early networks often subsidize supply while demand is built, and the activity may be genuine even when it is funded by dilution. The diagnostic question is what survives when the emission budget falls: if third-party fees cover the service and payers renew, the revenue is real but subsidized; if activity collapses, the usage was rented.
Does this framework work for AI agent tokens and DePIN tokens?
The five steps transfer, with one adjustment. AI agent tokens require the same affiliate removal, because agent teams commonly route fees through their own wallets; the difference is that digital actions are easier to verify than physical ones. DePIN tokens require the same emission comparison, because device rewards are the largest cost line in most of those networks.