Readers who already understand spot trading can treat the page as the start of a research workflow rather than a source of trade ideas. The leaderboard answers one narrow question: which spot USDT pairs moved the most over a rolling 24-hour window. It does not explain why a pair moved or whether an exit would fill near the displayed price.
Liquidity filters matter because percentage change says little about market depth. CoinGecko's top gainers endpoint, for example, includes only coins with at least $50,000 in 24-hour trading volume, a threshold documented as of October 2026 (Source: CoinGecko API documentation). Gate shows volume and market cap beside each pair so readers can apply a similar screen.
Key Takeaways
- Crypto Top Gainers is a ranking of spot USDT pairs by 24-hour percentage change, not a list of recommended assets.
- Read the 24-hour change together with 24-hour volume, market cap, and the 24-hour price range; the percentage alone cannot show whether a move is tradable.
- Tickers ending in 3L, 3S, 5L, or 5S are leveraged tokens whose percentage moves are amplified by rebalancing and are not directly comparable with plain spot tokens.
- Verify every candidate on the details page, check order-book depth against the intended trade size, and define an exit before placing an order.
What Is Crypto Top Gainers and What Does Gate's Page Show?
Crypto top gainers is a ranking category rather than an asset class. A gainers list sorts tradable pairs by percentage price change over a chosen window and places the largest positive movers at the top. Gate's Top Crypto Gainers page applies that rule to spot USDT pairs, so each row represents a pair that can be traded against USDT rather than a standalone coin.
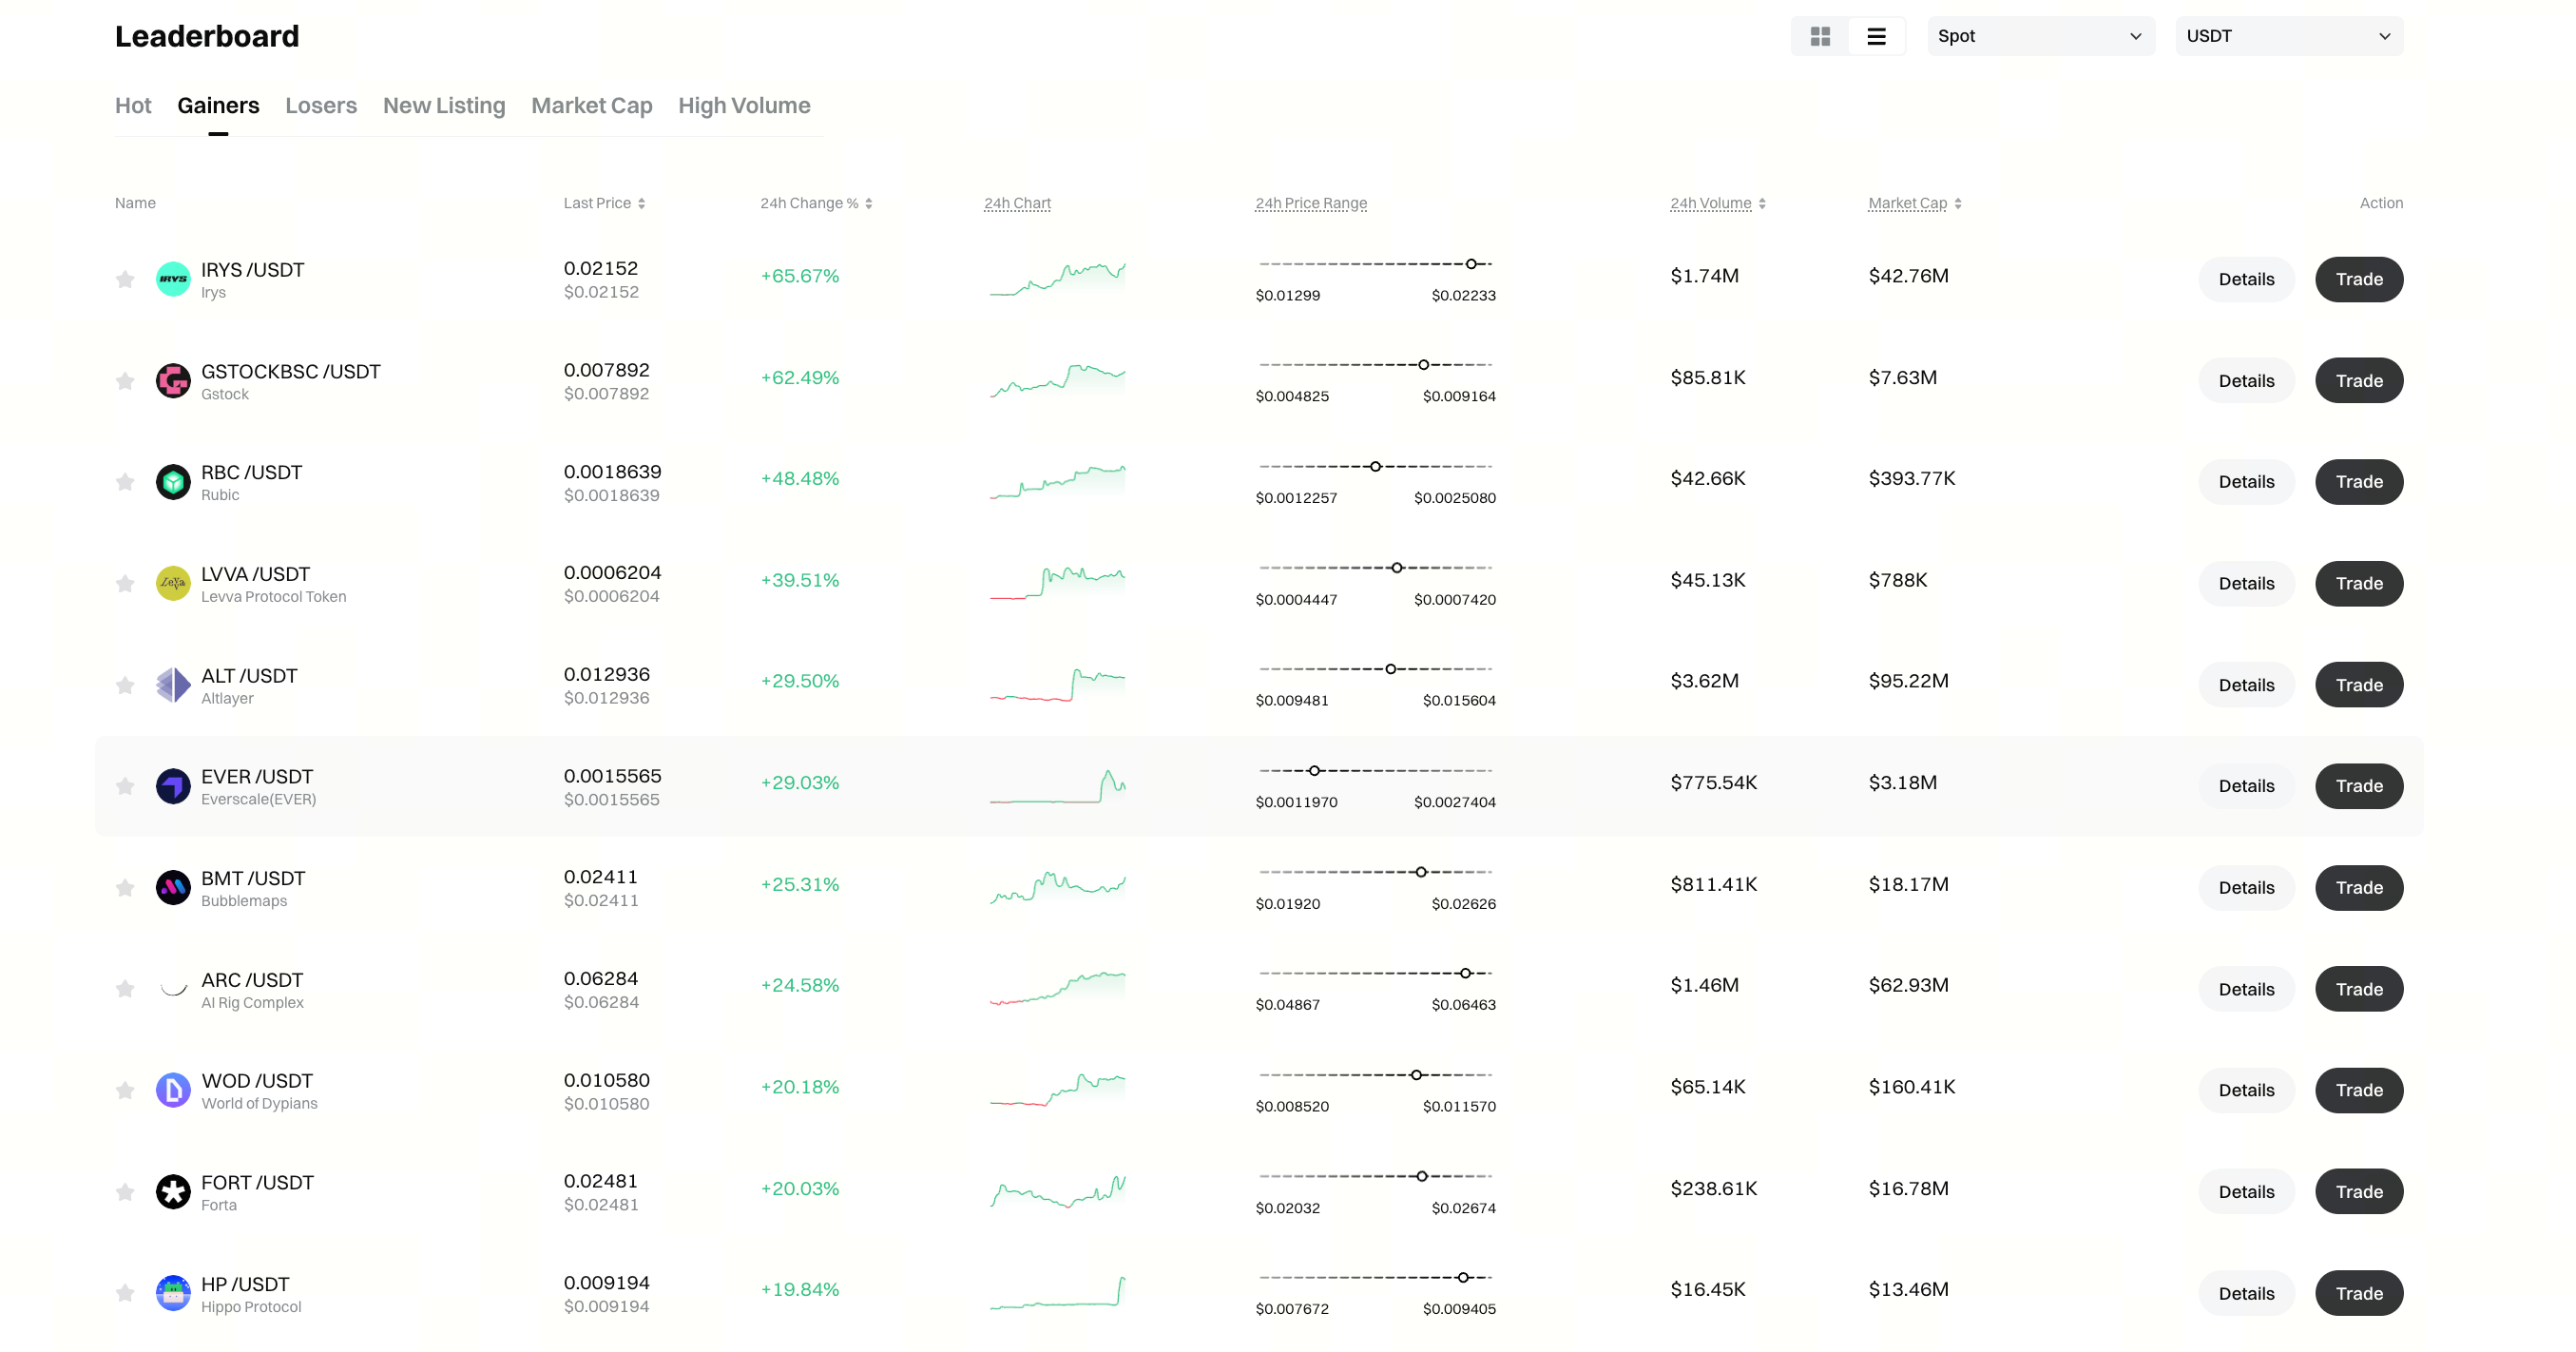
The page pairs the leaderboard with broader market context: a Fear & Greed reading, an Altcoin Season Index, an RSI moving average, a price change distribution, an Abnormal Markets feed for five-minute moves, and a heatmap. Those panels describe the wider market; the table describes individual movers. The ranking is a snapshot of the leaderboard at one moment rather than a permanent classification.
A top rank is arithmetic, not an endorsement. A pair can reach the top because of one large order in a thin book, a listing event, or a leveraged product tracking an underlying move. Top Crypto Gainers and Losers pages are usually read side by side: the gainers list shows where price rose fastest, the losers list shows where it fell fastest, and neither list explains the cause.
What Should You Check Before Using the Top Gainers Page?
Viewing the leaderboard is public, but placing an order requires a funded account and the identity verification level that applies to the account and region. The pair notation also matters: a row such as TOKEN/USDT names the base asset, its ticker, and the quote currency, which sets the unit for price, volume, and market cap.
Decide on filters before opening the list. A practical starting set includes a minimum 24-hour volume, a minimum market cap, an acceptable 24-hour range, a decision on leveraged tickers, and a position size with an invalidation level. Writing those rules down keeps the ranking from setting the agenda.
Understand order types before clicking Trade. Market orders prioritize speed and can fill across several price levels in a thin book; limit orders cap the worst acceptable price.
How Do You Read the Top Gainers Leaderboard?
The leaderboard is read left to right, then top to bottom, with one check at each stage. The order matters because the first column that looks impressive is also the easiest to misread.
- Open the page at the official Gate domain and confirm that the table is the spot USDT leaderboard.
- Read the 24-hour change to see the ranking order, then note the last price and the quote currency.
- Move to volume and market cap to judge whether the move occurred in a market that can absorb orders.
- Check the 24-hour price range to see where the last price sits between the period low and high.
- Compare the chart shape in the 24-hour sparkline: a single vertical candle and a sequence of higher closes describe different conditions.
- Open Details for the pair, and use Trade only after the verification steps below.
The leaderboard is a 24-hour ranking that updates as the rolling window changes. For 1-hour, 4-hour, and 1-day context, use the pair's chart rather than the ranking itself.
| Column |
What it shows |
How to use it |
| Name / pair |
Token name, ticker, and quote asset |
Confirm the exact pair and quote currency before comparing rows |
| Last price |
Last traded price |
Unit of account; it is not a fair-value estimate |
| 24h change % |
Change over a rolling 24-hour window |
Ranking field; check the reference point and the chart shape |
| 24h chart |
Sparkline of the period |
Distinguish a single spike from a sustained sequence |
| 24h price range |
Low and high for the period |
Judge whether the last price is near the high, mid, or low |
| 24h volume |
Quote-denominated turnover |
Gauge participation and exit capacity |
| Market cap |
Circulating supply multiplied by price |
Judge size and how easily a small flow can move the price |
| Action |
Details and Trade controls |
Research first, execution second |
The columns work as a set. A 40% gain on a small-cap pair with minimal turnover is arithmetically correct but structurally fragile; the same percentage on a larger, actively traded pair describes a different market.
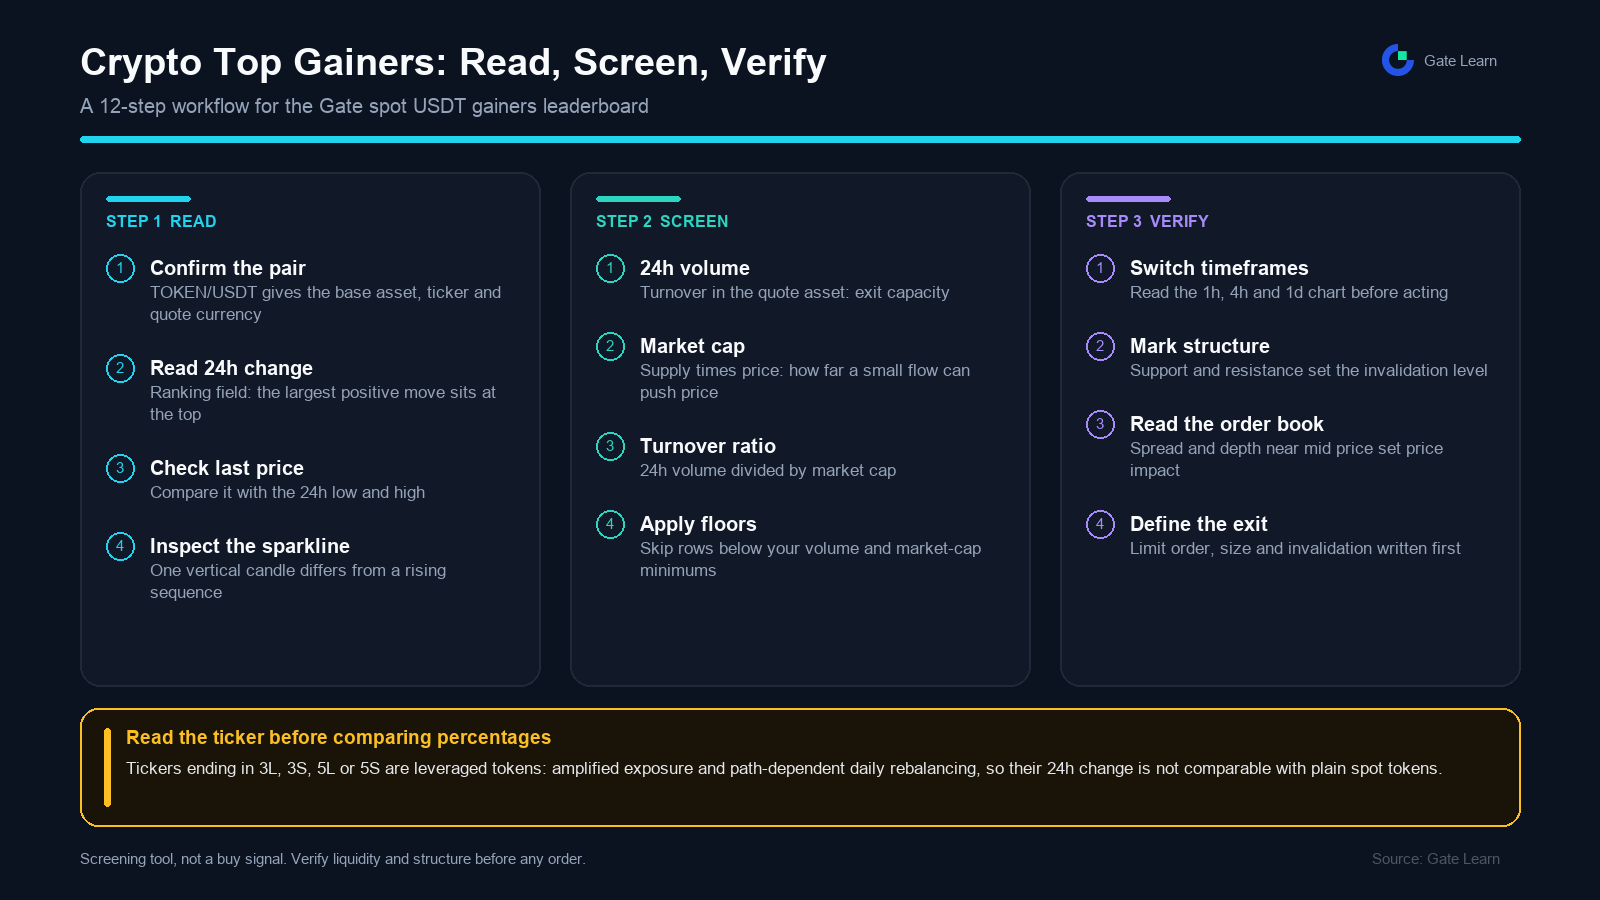
Figure 1. Gainers workflow: confirm the pair and the 24-hour change, screen with volume, market cap and turnover, then verify with timeframes, order-book depth and a defined invalidation level.
How Do You Screen Gainers With Volume and Market Cap?
Start with 24-hour volume rather than percentage change. Volume indicates how much trading occurred; market cap indicates the size of the asset. Comparing the two produces a turnover ratio that is more informative than either number alone.
The ratio is 24-hour volume divided by market cap. A pair with $2 million in 24-hour volume and a $200 million market cap turns over about 1%; the same volume against a $10 million market cap turns over about 20%. The first pair is large relative to its trading activity, while the second is being repriced by a flow that is small in absolute terms. Both readings require a depth check before any conclusion.
Market-cap size works as a filter even without a dedicated control: set a minimum and skip rows below it. Volume floors vary by provider; a stricter floor, such as $1,000,000, shrinks the list to larger, more liquid markets.
| Check |
What to compare |
Why it matters |
If the reading is weak |
| 24h volume |
Absolute quote volume |
Indicates participation and exit capacity |
Skip the pair or reduce intended size |
| Turnover |
24h volume divided by market cap |
Shows whether activity is large relative to size |
Inspect the order book before acting |
| Market cap |
Size relative to comparable assets |
Small caps can move far on small flows |
Treat the percentage as fragile |
| Price range position |
Last price versus 24h low and high |
Separates a fresh move from a late entry |
Wait for structure instead of chasing |
| Chart shape |
One candle versus a sequence |
Suggests a spike or a sustained move |
Require multi-timeframe confirmation |
A high turnover reading is not automatically healthy: incentives, bots, and listing events can inflate volume without durable two-way trade. Price range position adds a second filter. A last price at the top of the 24-hour range after a vertical move makes a new entry late by construction, while a price near the low after a spike means the move already failed for buyers at the high. Neither reading is a prediction; both describe where price sits inside the period.
Extreme percentages usually come from a small float, a new listing, a meme-coin cycle, or a leveraged product rather than broad demand. Token categories therefore cluster on gainers lists, while a trending list ranks attention or activity and may include assets that never top the percentage ranking.
How Do You Tell a Normal Token From a Leveraged Token?
Some rows are not ordinary tokens. Gate lists leveraged tokens on the spot market, and their tickers end in 3L, 3S, 5L, or 5S. BTC3L represents a 3x long Bitcoin product, while BTC3S represents a 3x short product. Because these products trade like spot assets, they can appear on a gainers list beside plain tokens.
Leveraged tokens maintain a target exposure through automatic rebalancing. They lack a margin-style liquidation threshold, but their net asset value can still fall, and daily rebalancing makes returns path-dependent. In choppy markets, that rebalancing can erode value even when the underlying ends near where it started — an effect called volatility decay.
A large 24-hour change on a 3S token may reflect a modest decline in the underlying asset rather than a broad repricing of the token itself. Comparing that percentage with a plain spot token's percentage is therefore misleading; the two numbers describe different exposures.
| Feature |
Plain spot token |
Leveraged token |
| Ticker pattern |
Base asset plus quote asset |
Ends in 3L, 3S, 5L, or 5S |
| Exposure |
1x to the underlying asset |
Target 2x, 3x, or 5x, long or short |
| Rebalancing |
None |
Automatic and path-dependent |
| Liquidation |
Not applicable |
No liquidation threshold, but net asset value can decay |
| Holding cost |
Trading fees |
Management fee plus volatility decay |
| Reading a 24h change |
Supply and demand for the token |
Amplified underlying move plus rebalancing effects |
The practical rule: identify the product type before comparing percentages. Leveraged tokens solve a different problem from spot exposure.
How Do You Verify a Candidate Before Trading It?
Verification turns a ranking row into a tradable idea. The goal is not to predict direction but to confirm that the pair, the chart, and the order book match the move that attracted attention.
- Open Details and confirm the pair. Check the base asset, quote asset, and contract or network information where shown; a ticker alone is not enough when similar names exist.
- Switch chart timeframes. Read the 1-hour, 4-hour, and 1-day candlestick chart. A 24-hour move that appears as one candle on the daily chart is a different event from a move built over several sessions.
- Mark structure. Identify nearby support and resistance so the invalidation level is based on market structure rather than a round percentage.
- Read the order book and trade tape. Compare the bid-ask spread and depth near the mid price, estimate price impact for the intended size using the principles of liquidity and slippage, and review whether trade prints reflect broad activity or repeated automated sizes.
- Write the exit before the entry. Define the invalidation level, position size, and order type. Use a limit order when depth is thin, and avoid market orders that can consume several price levels.
- Add the pair to a watchlist and set alerts. A watchlist keeps the candidate visible without forcing an immediate decision, and alerts reduce the urge to refresh the leaderboard continuously.
How Do You Interpret the List With Market-Context Panels?
The panels above the leaderboard answer a different question from the table: is the move part of a broad market shift or isolated to one pair? Reading both layers prevents a single row from being mistaken for a market-wide signal.
The Fear and Greed Index scores sentiment from 0 to 100, with lower readings associated with fear and higher readings with greed; it is a gauge, not a timing signal. The Altcoin Season Index compares altcoin performance with Bitcoin, and the RSI moving average summarizes market-wide momentum. Neither index says that a particular top gainer will continue to rise.
The price change distribution counts rising and falling assets. A large majority of advancers indicates broad participation; a small number alongside many decliners indicates isolated moves. Breadth is a useful sanity check because a thin rally can produce dramatic individual percentages without a healthy market underneath.
The Abnormal Markets feed lists five-minute movers, and the heatmap shows direction and relative size across assets. Both are short-horizon views: useful for noticing that a move is still in progress, but poor evidence of a durable trend.
The combination matters more than any single panel. Broad breadth, high altcoin participation, and elevated greed describe a different environment from negative breadth, low participation, and fear, even when the same pair tops the table in both cases.
What Are the Benefits, Limits, and Risks?
The value of the gainers page is compression: the page places the fastest-moving spot USDT pairs on one screen alongside volume, market cap, and the 24-hour range, so rows can be compared on a single basis instead of checked one coin at a time. Its limits are equally clear: the ranking sorts on one window's percentage change and says nothing about asset quality, contract safety, or fundamentals, so the page can only serve as a first-pass screen.
Three mistakes recur. Treating the ranking as a recommendation ignores that one variable can be moved by a small amount of capital in a thin market. Ignoring volume and market cap hides whether the move occurred in a market that can absorb orders. Comparing leveraged tokens with plain spot tokens mixes amplified short exposure and rebalancing with ordinary demand, producing a ranking that looks meaningful but is not.
Chasing a vertical candle without an invalidation level is a fourth error. The move that attracts attention has often already happened, and a market order in a thin book can fill far from the displayed price, leaving slippage larger than the edge the trade was meant to capture.
The structural risks are equally important:
- Thin liquidity. A small order book means wider spreads and worse exits, especially when several sellers arrive together.
- Manipulation. Pump-and-dump schemes can produce rankings that look like demand. The U.S. Commodity Futures Trading Commission advises against purchasing virtual currencies based on social media tips or sudden price spikes (Source: CFTC customer advisory).
- Leveraged product decay. Rebalancing and management fees can erode a leveraged token's value over time, even when the underlying asset trades sideways.
- Snapshot data. The 24-hour window rolls forward, so one candle can dominate and then drop out.
- Execution assumptions. Displayed prices are not guaranteed fills; depth and order size set the executed price.
A real move tends to show sustained volume, two-way trade, and follow-through across timeframes; a pump-and-dump pattern often shows a vertical spike, thin depth, and volume that fades as price stalls.
No list removes the need to verify the asset, the pair, and the exit. The crypto market metrics behind the page are descriptive tools, not forecasts.
Summary
Crypto Top Gainers on Gate ranks spot USDT pairs by 24-hour percentage change and places market-context panels above the table. Reading the page well means treating the percentage as a starting point, checking volume, market cap, and the 24-hour range, and identifying leveraged tokens before comparing moves. Verification continues on the details page, where the chart, order book, and structure determine whether a candidate is tradable at the intended size. The list is a screening tool; the risk checks turn it into a workflow.
FAQ
What are crypto top gainers?
Crypto top gainers are the assets or trading pairs with the largest positive percentage price change over a chosen period, usually 24 hours. On Gate, the Top Crypto Gainers page ranks spot USDT pairs and displays each pair's last price, 24-hour change, 24-hour price range, 24-hour volume, and market cap. The ranking identifies movers, not recommended purchases.
How do I find top gainers on Gate?
Open the Top Crypto Gainers page at gate.com/price/category-gainers and read the spot USDT leaderboard. The table is sorted by 24-hour change; use the volume, market cap, and range columns to screen candidates, then open Details for the chart and order book. An account with the required identity verification is needed before placing an order.
Are top gainers good to buy?
A top gainers list is a screening tool, not a buy list. A large percentage move can come from thin liquidity, a listing event, or a leveraged product, and the displayed price may not be executable at the intended size. Treat a candidate as a research starting point and verify liquidity, market structure, and risk before deciding whether to trade.
Why do some top gainers have very low volume?
A low-volume pair can post a large percentage change because relatively little capital is needed to move its price in a thin order book. That makes the gain fragile: spreads are wider, exits are harder, and the move may reverse when flow stops. Low volume also raises the risk of manipulation, which is why volume and market cap should be read together.
What is a 3L or 3S token on a gainers list?
A 3L token is a leveraged token designed to provide roughly 3x long exposure to an underlying asset, while a 3S token provides roughly 3x short exposure. These products rebalance automatically, can experience volatility decay, and trade on the spot market, so they can appear beside ordinary tokens in a gainers ranking. Their percentage moves are amplified and should not be compared directly with plain spot tokens.