For readers who want a practical checklist on BTC long vs short data: start from the boundary that matched notional does not imply symmetric account distribution, then apply one reading workflow across venues. Later sections show how to combine the ratio with the funding rate and open interest, and how to review Gate’s multi-exchange table without treating the metric as a standalone forecast.
Key takeaways
- Confirm whether the feed is an all-account ratio, a top-trader account ratio, or a top-trader position ratio before drawing conclusions.
- A value above 1 generally indicates long-side skew in that dataset; below 1 indicates short-side skew—always relative to that venue’s normal range.
- Extreme readings can flag crowding and liquidation risk narratives, but extremes can persist and do not equal directional predictions.
- Pair the long/short ratio with funding rates and open interest to see whether account heads and capital flows agree.
What is the Bitcoin long/short ratio, and why do long and short notionals still match?
In crypto perpetual futures and dated futures markets, every contract that opens a long requires a matching short of equal notional value. That zero-sum structure means aggregate long notional and aggregate short notional remain balanced, so the published Bitcoin long/short ratio does not prove that “more money is long than short.”
An account-based Bitcoin long/short ratio counts each qualifying account once by the sign of its net exposure. If sixty accounts are net long and forty are net short, the account ratio is about 1.5 even though total long and short notional still match one-for-one—the average short account simply holds larger size. That distinction is why a high account ratio often behaves as a retail-crowding or breadth gauge rather than a measure of net market exposure.
Size-weighted or top-trader position ratios answer a different question: among large accounts, what share of position notional is long versus short. Account-count and position-weighted series can diverge on the same day when many small longs face fewer, larger shorts.
How do common long/short ratio datasets differ?
| Dataset type |
What it counts |
Typical question it answers |
| Global / all-account ratio |
Net-long vs net-short accounts among all accounts with open interest |
How broad is long or short participation? |
| Top-trader account ratio |
Same account logic, limited to a top margin cohort (often top 20%) |
Are larger accounts leaning long or short by head count? |
| Top-trader position ratio |
Long vs short total notional among that top cohort |
Where is large-trader capital concentrated? |
| Taker buy/sell (related, not identical) |
Aggressive buy vs sell volume over a window |
Is short-term order flow lifting or hitting? |
Before reading any BTC long vs short chart, label which row in this table the source uses: head counts and position weights are not the same object. Mixing an all-account print with a top-trader position print is a common source of contradictory sentiment headlines.
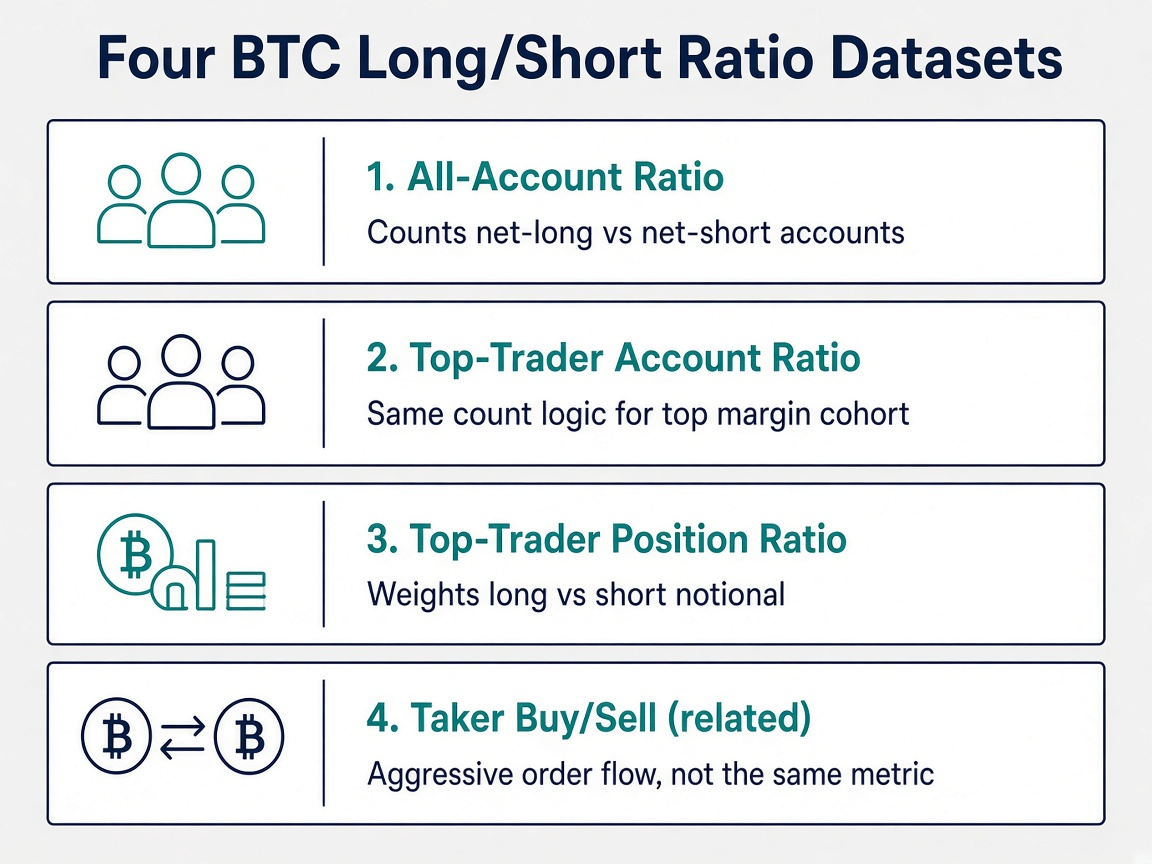
Figure 1. Four common Bitcoin long/short ratio datasets: all-account, top-trader account, top-trader position, and related taker flow.
How to read the Bitcoin long/short ratio step by step
- Fix the instrument. Confirm the chart is Bitcoin perpetual or a specific dated future, not a blended altcoin feed.
- Name the methodology. Account ratio, top-trader account ratio, or top-trader position ratio.
- Read level and change. Note whether the print sits above or below 1.0 and how it moved versus the prior day or week for that same venue.
- Normalize to the venue’s range. A 1.2 reading may be ordinary on one exchange and extreme on another; compare against that venue’s recent distribution instead of a universal threshold.
- Cross-check exchanges. Retail-heavy and mixed venues can print different skews for the same BTC move; divergence across Gate, Binance, OKX, Bybit, and others is information, not noise to ignore.
- Flag crowding only with context. Very high long skew or very low short skew becomes more meaningful when funding is stretched and open interest is rising together.
Exchange-level differences matter because broad averages can hide platform-specific positioning structure.
This sequence keeps “how to read bitcoin long short ratio” tied to process rather than to a single magic level.
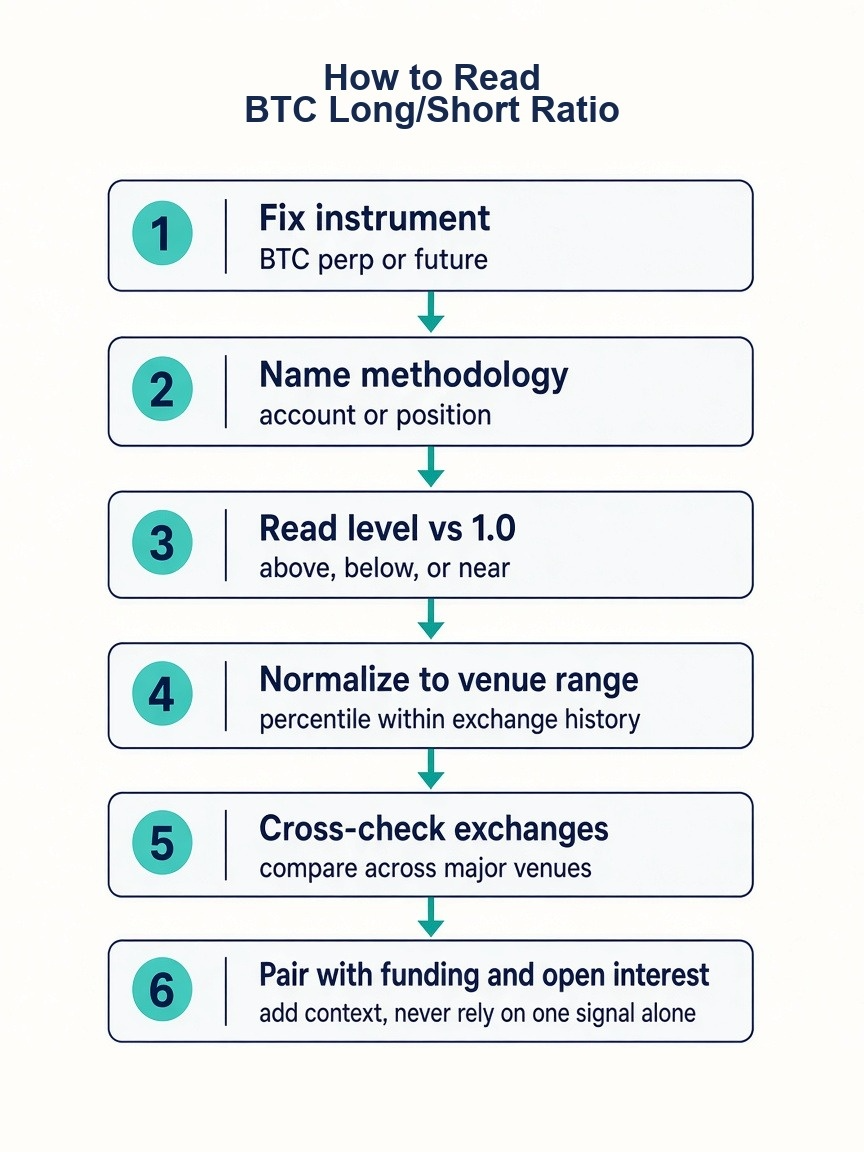
Figure 2. Reading checklist for the Bitcoin long/short ratio: fix instrument and methodology, then range, cross-venue, funding, and open interest.
How should the long/short ratio be combined with funding rates and open interest?
The long/short ratio is most useful as one panel in a positioning stack:
- Funding rate shows whether longs or shorts are paying to keep leveraged exposure open. High positive funding with a long-heavy account ratio can describe a crowded long narrative; negative funding with long-heavy accounts can show disagreement between head count and carry.
- Open interest shows whether exposure is building or washing out. Rising open interest with a one-sided ratio describes leverage accumulation; falling open interest can mark position unwind even if the ratio stays elevated.
- Price context (direction of the spot or mark move, without forecasting) helps classify whether the crowd is chasing or fading the move.
Use these combinations as descriptive diagnostics. They do not by themselves prescribe entries, exits, or position size, and they should be read alongside trading volume, not in isolation.
What are common misreads and limitations?
- Treating the ratio as proof that “more money is long than short,” which contradicts matched notional structure for account-based feeds.
- Applying one global threshold (for example “always fade above 2.0”) across every venue and coin.
- Ignoring hedging: large accounts may use futures to hedge spot or inventory, which can distort sentiment stories.
- Assuming extreme readings must reverse immediately; crowded positioning can persist through trends.
- Comparing unsynced timestamps or mixing taker buy/sell volume with account ratios as if they were identical metrics.
Methodology differences, reporting delays, and exchange-specific user bases all limit precision. The Bitcoin long/short ratio supports situational awareness; it is not a standalone predictor of Bitcoin price.
How to check BTC long vs short ratio data on Gate
Gate publishes multi-exchange Bitcoin long vs short tables and charts on its market-data pages, with an overview available for other assets. When reviewing the page:
- Identify the exchange row and contract type (perpetual versus dated future where shown), and remember one side can show more accounts while the other still holds more capital.
- Note long versus short percentage columns and any long/neutral/short labels the interface displays, and distinguish those percentages from position value where the interface provides it.
- Treat on-page values as live operational data that change as traders open and close positions; educational copy should describe the reading method, not freeze a temporary print as everlasting fact.
- Use the framing above—dataset type, range context, funding, and open interest—when interpreting what the table implies about positioning breadth.
Product pages remain the source of truth for the latest figures; the Gate BTC Long vs Short Ratio page is the multi-exchange entry point.
Summary
Reading the Bitcoin long/short ratio starts with dataset literacy: account breadth and position-weighted top-trader feeds answer different questions even though long and short notionals remain matched in the aggregate book. Interpret levels relative to each venue’s own history, compare exchanges, and validate crowding stories with funding rates and open interest. Used this way, BTC long vs short data becomes a structured positioning checklist rather than a one-number forecast.
FAQ
How do you read the Bitcoin long/short ratio?
Identify whether the feed counts accounts or position size, note whether the print is above or below 1.0, compare it with that exchange’s recent range, then cross-check funding rates and open interest before treating the reading as part of a crowding signal.
What does a BTC long/short ratio above 1 mean?
In most exchange publications, a ratio above 1 means the measured cohort has more net-long accounts—or more long-weighted notional in size-based feeds—than net-short participation. It describes skew in that dataset, not a guaranteed bullish price outcome.
Is the long/short ratio based on accounts or position size?
Both exist. Account ratios count heads; top-trader position ratios weight notional among large accounts. Always read the source methodology because the two series can diverge when many small longs face fewer large shorts.
Can the Bitcoin long/short ratio predict price?
No single long/short print reliably predicts Bitcoin price on its own. The metric is better used to describe positioning skew and potential crowding when combined with funding, open interest, and venue context.
How is the long/short ratio different from the funding rate?
The long/short ratio summarizes who (or how much size) is net long versus net short. The funding rate summarizes the periodic payment between longs and shorts that keeps the perpetual near the mark price. They often move together in crowded markets but measure different mechanics.