Square
Following
Hot
News
Notifications
Profile
Share your thoughts
placeholder
Article
🔹Apple is also stepping up its AI arms race! The CEO is personally urging the software team, and Si
live-cover
LIVE1,882
Getting back active on pump , my stats looking good
Always focus quality over quantity to make sure we eat
Looking to add a few to my group as well
post-image
Trenches
牛逼
牛
bade
b
牛逼
0x96...7777
Market Cap
$.
Change
.
24h Vol
$.
Holders
.
PIEVERSE
P
bade
b
PIEVERSE
0x0e...25a9
Market Cap
$.
Change
.
24h Vol
$.
Holders
.
STONK
S
bade
b
STONK
6GmA...UNgx
Market Cap
$.
Change
.
24h Vol
$.
Holders
.
BTC
B
bade
b
BTC
C5xp...pump
Market Cap
$.
Change
.
24h Vol
$.
Holders
.
ON
O
bade
b
ON
0x0e...1d48
Market Cap
$.
Change
.
24h Vol
$.
Holders
.
Is the get-rich cycle still here? It is, but the rules have changed.
First, let's look at the current market:
BTC fell from 86,000 in early October to 75,000, down 13% in just over a month.
SOL 86.
In this market, the people around you aren't getting rich; they're averaging down.
So here's the conclusion:
The get-rich cycle hasn't disappeared, but it's gone from “everything goes up” to “a lottery.”
Getting rich used to mean “buy and it goes up”:
In 2017, you could buy anything; in 2021, you could buy anything,
and as long as you held on, you'd end up tenfold up by the end of the cycle.
Back th
post-image
BTC-0.65%
$UVXY Down 18.96% in a day, plunging from 23.14 to 18.34 on a high-volume selloff with 20.6M in trading value—this isn’t a pullback; it’s panic selling and mass position closures. Source: Gate real-time market data.
Put into trading terms, it boils down to this: the market is rapidly stripping away the panic premium, and long-volatility positions are being forcibly liquidated. UVXY is a 1.5x leveraged long VIX short-term debt ETP; its nearly 19% drop means the VIX futures curve is cooling rapidly and the front-month discount is narrowing. This kind of single-day decline usually occurs in two s
UVXY-1.71%
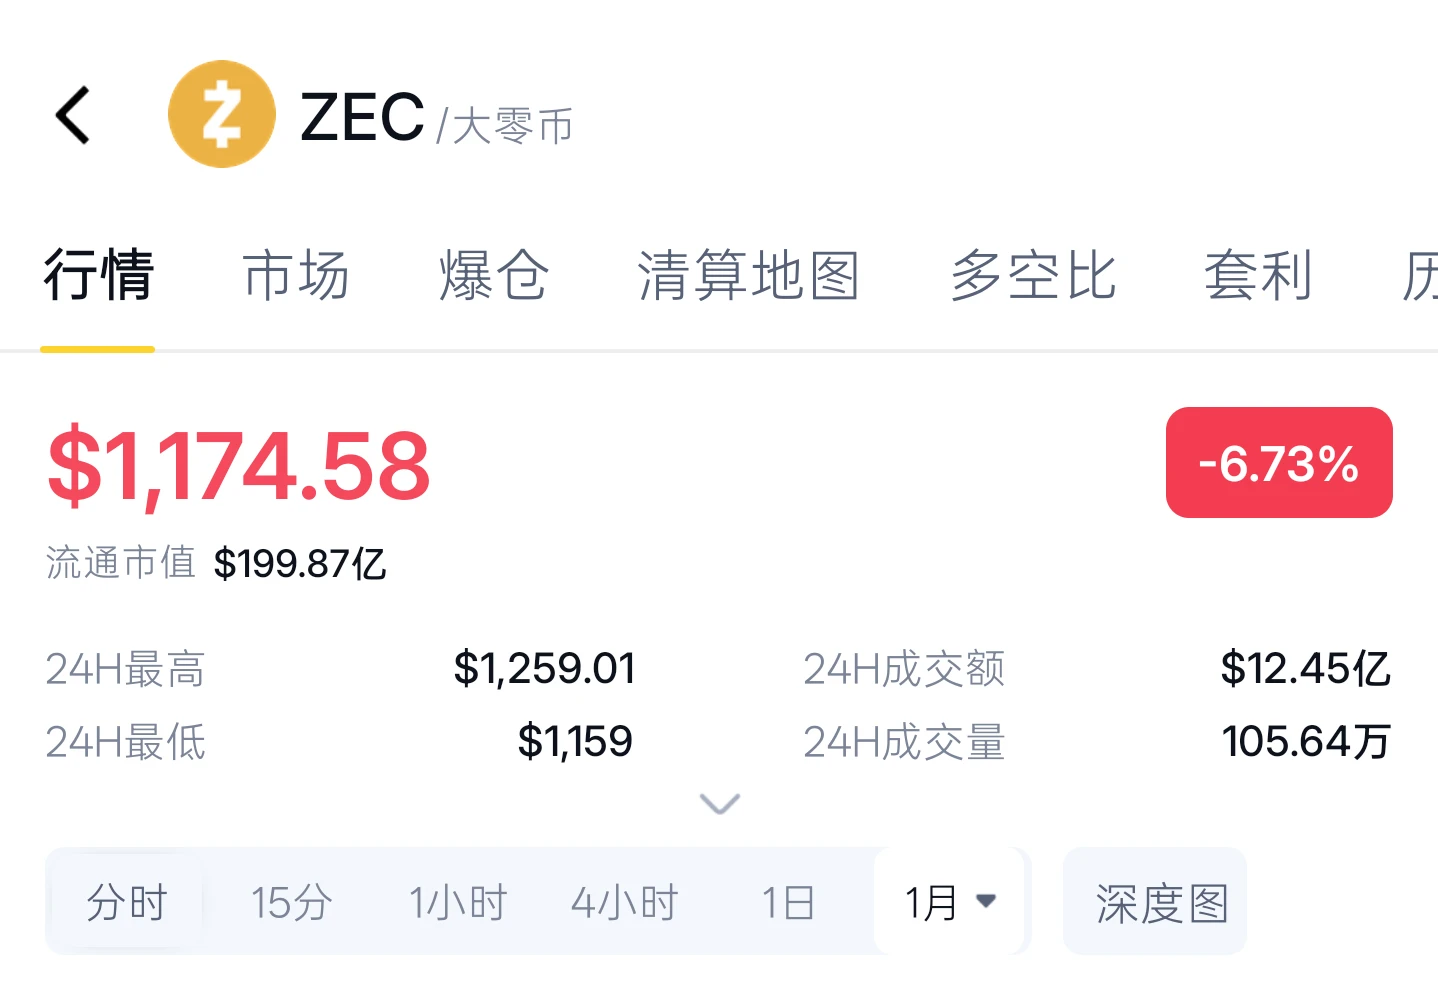
Zcash broke below support today, leading major cryptocurrencies in losses: it fell about 6.5% over 24 hours, dropping below the key 1,190–1,200 support band and reaching a low near 1,163. It is currently trading around 1167, with losses significantly greater than those of Bitcoin and Ethereum; yesterday’s “relative resilience” has shifted to today’s “leading the decline.” The 24-hour range was 1,163–1,270, once again highlighting its high volatility.

Structurally, the loss of the 1,190–1,200 support means the rebound structure that ZEC began forming from its low of 1,147 has been broken, with
post-image
ZEC+1.29%
BTC-0.67%
ETH-1.26%
$TIA — Short entry: 0.4380 Take profit 1: 0.4270 Take profit 2: 0.4180 Stop loss: 0.4490 The upward trend weakened near the 0.442 resistance area. If a position cannot be established above this level, there is still room for further downside.
post-image
TIA-0.60%
With 10ku, the most common thing I’ve seen isn’t failing to make money—it’s dying too fast.
There are five ways to die. See which one fits you.
First: going all in on one coin.
Bet it all with 10ku at 20x leverage, and a 4.5% move in the wrong direction is the end.
You think the market is bad, but really, your position never had a chance to “survive” from the start.
Second: adding to a losing position to average down.
The price drops, you refuse to accept the loss and add more. Then you add more again.
In the end, your account is empty, and you still hold the coins—except they’re no longer rea
post-image
GT-2.24%
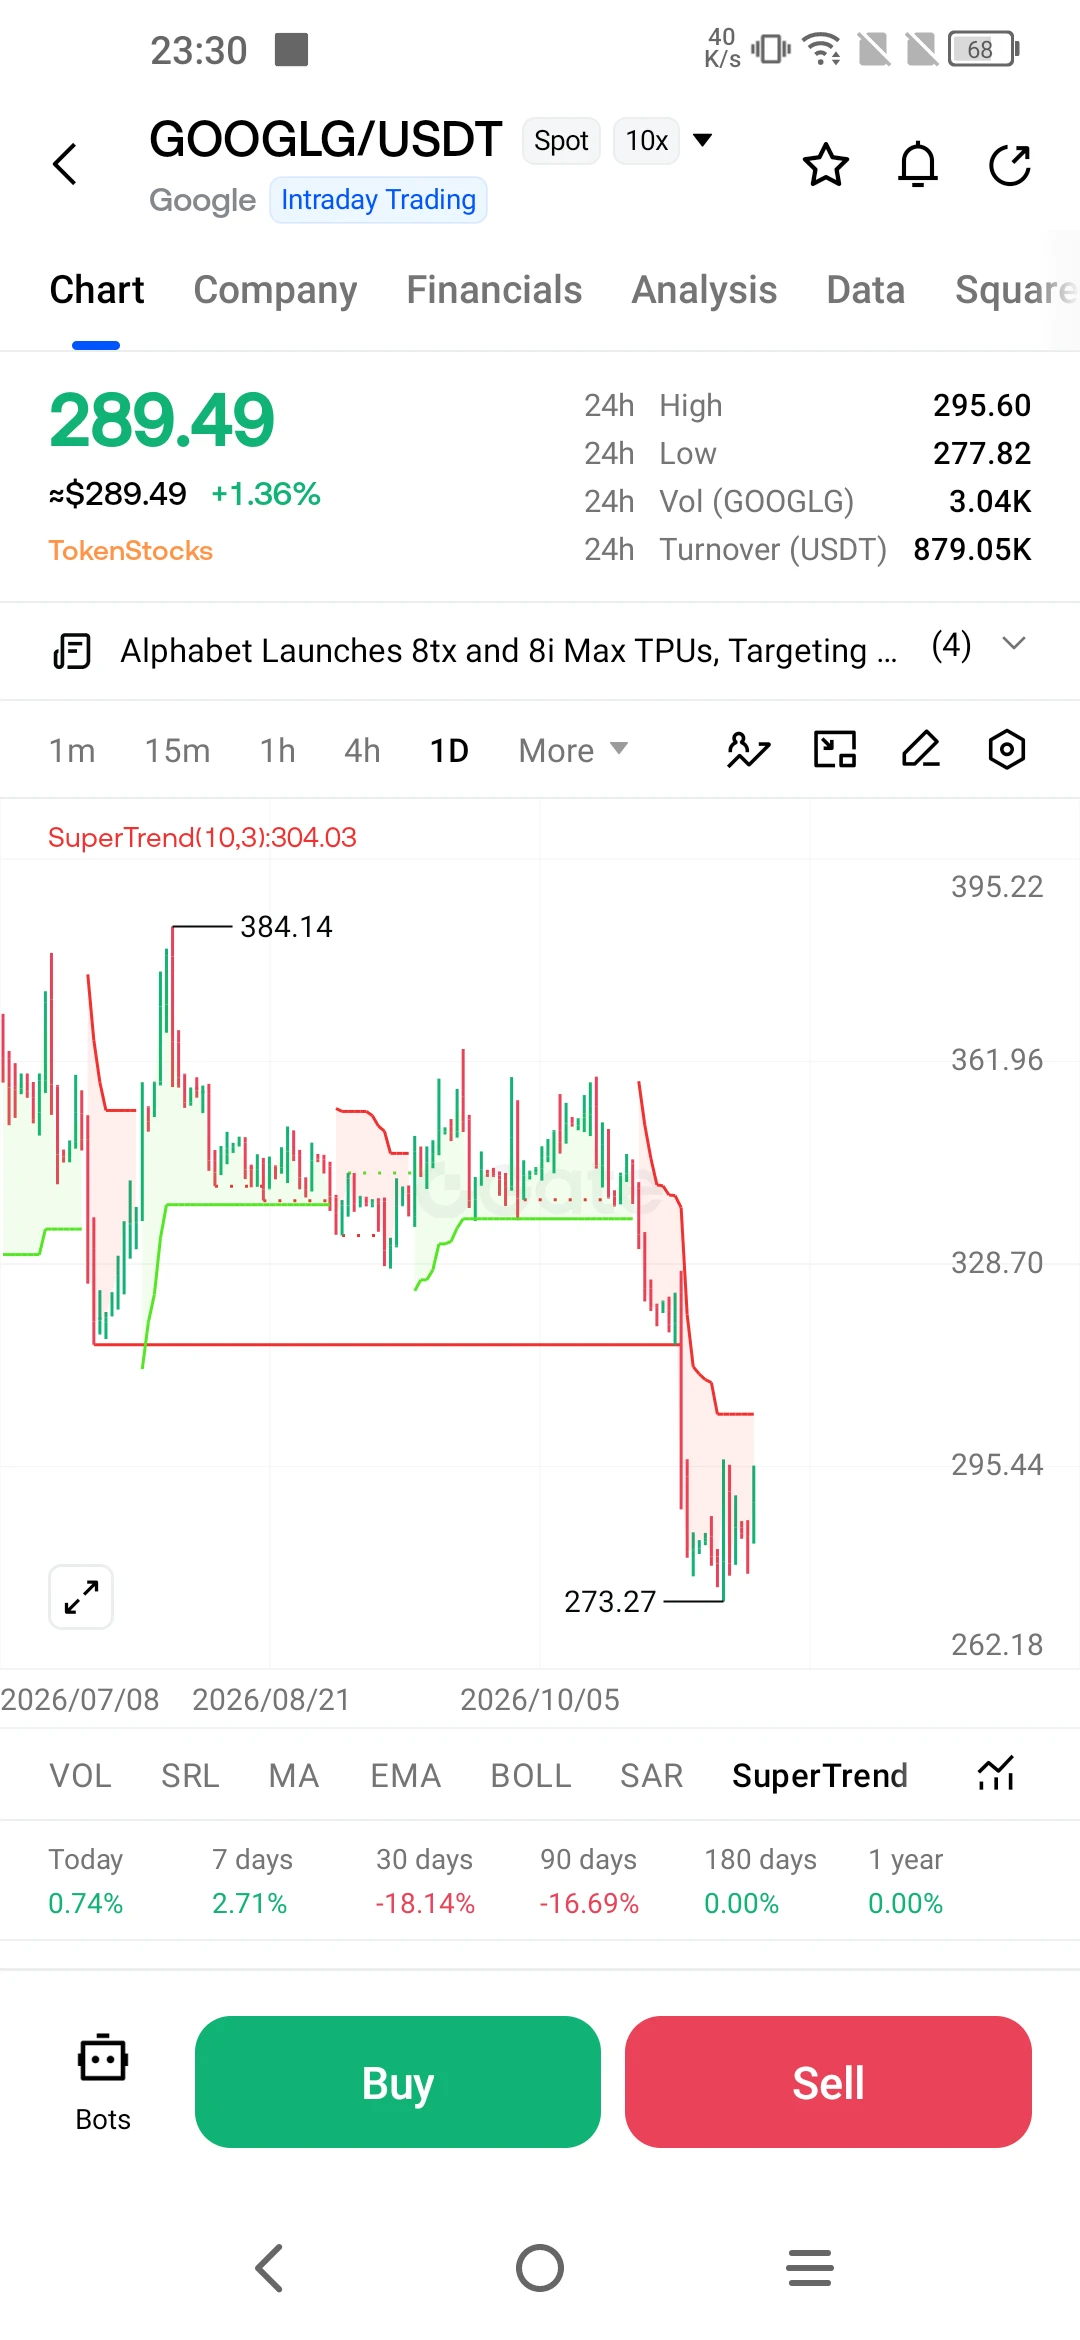
Sometimes, the market presents such peculiar moments—a stock hits rock bottom just as the company unveils a breakthrough in new technology. This is precisely what happened with GOOGL/USDT. The chart shows a sharp decline from $384 to $273, followed by an attempt at recovery. At first glance, one might attribute this drop to the new artificial intelligence chips introduced on November 9. In reality, however, the situation is more nuanced; the decline wasn’t caused by the chips themselves, but rather by Google paying the price for its own success.

The catalyst for the collapse was the earnings
post-image
GOOGLG+0.09%
GOOGL+0.11%
GOOGL+1.21%
GOOGL-0.04%
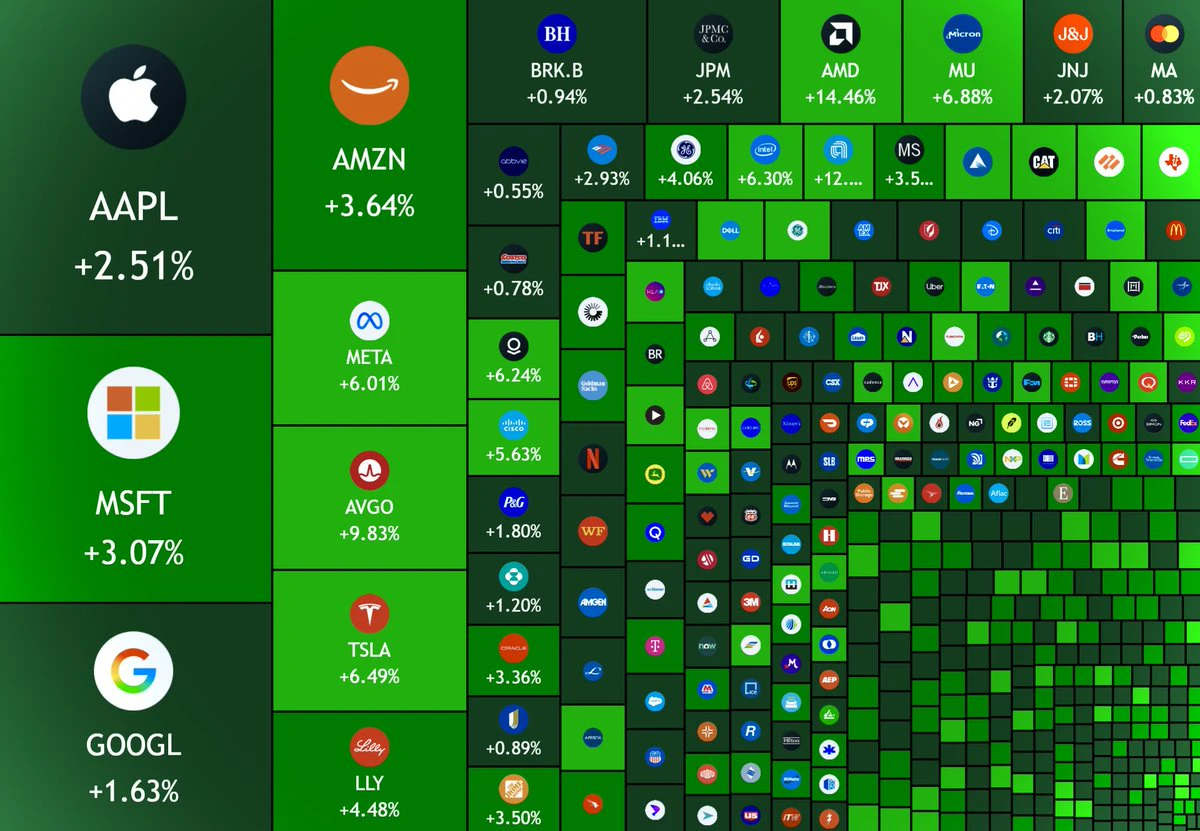
$1.8 Trillion added in US market today
S&P 500 +2.35
NAsdaq +2.74%
DOW +2.25%
Russell +3.16%
Memory stocks bounce after last week panic sale.
$MU +6.24%
$SNDK +6.16%
$AMD +13.2%
$INTC +5.49%
$WDC +9.86%
$STX +10%
$CRWV +5.56%
$SOXX +7.52%
post-image
SPX500+0.19%
NDAQ+1.29%
DOW-1.40%
MU+6.42%
SNDK+6.27%
$LIT Long, 3.25 is a key level on the 4H chart 👀 buyers need to defend this area. If it rebounds cleanly, I’ll consider entering; if it closes below, I’ll stay on the sidelines for now. Why this price level matters: - Price on the 4H chart is 3.26, above the EMA50 at 3.24, so the trend is on this side - Daily price is above the EMA200 at 2.77, and the daily trend also supports this view - Stop-loss distance is 3.4%, and the distance to TP3 is 5.5%; if the market continues rising, the risk/reward ratio is about 1.6R🟢 Long entry: 3.248–3.266Take profit: 3.324 / 3.369 / 3.436Stop loss: 3.145No
post-image
LIT-4.56%
We have all experienced that familiar feeling in our portfolios at some point: an asset climbs for a long stretch, then suddenly pulls back, leaving you wondering—has the trend ended, or is it just catching its breath? Looking at the GateToken chart, we find ourselves in exactly such a moment. The price has retreated from 11.52 to 9.62. The SuperTrend indicator is flashing red at 10.42, signaling a bearish trend in the short term.

This isn’t a situation that warrants panic, but it’s also not a signal to simply brush off as "business as usual." In short, the indicators suggest that bullish mom
GT-2.41%
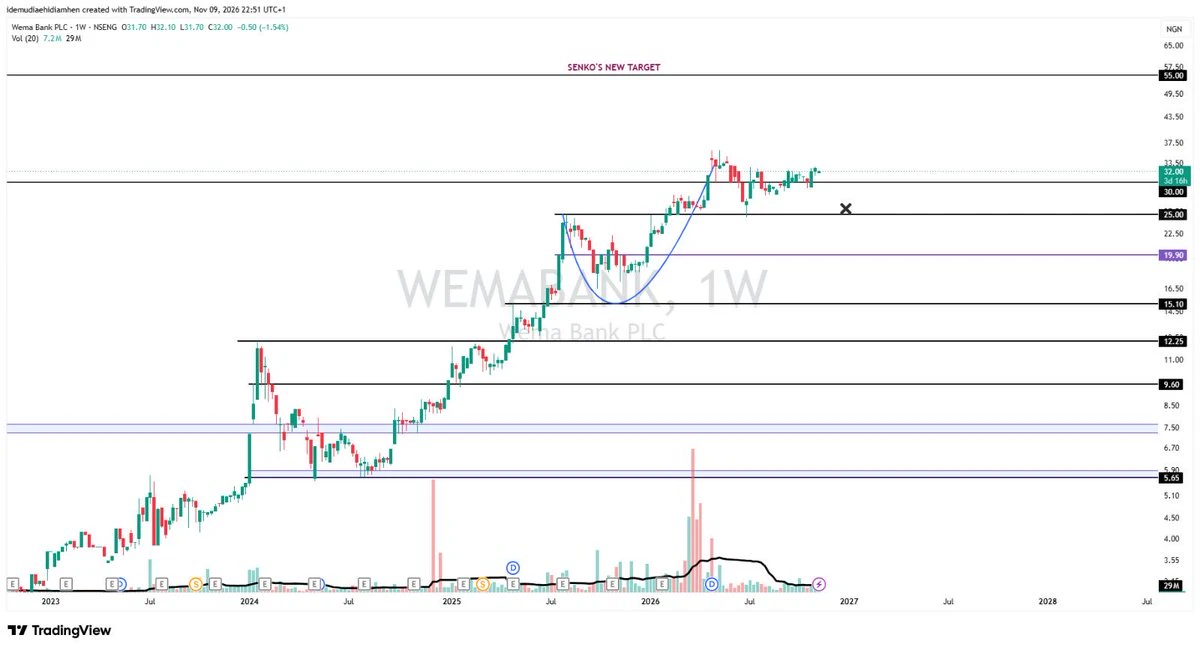
WEMABANK
WEMABANK is still in a proper uptrend, so I’m sticking with my chart. I’ve reviewed my target for the bank. Now it’s up to Wema to prove me wrong.
On the chart, I want to see the bulls defend ₦30 per share, the key psychological support. But what’s the catalyst that takes WEMABANK to new highs?
A healthy cash position, good results and even a 30–40% payout ratio are positives. I’m still looking for something that can make investors raise their expectations for the bank.
Mr. Market wants something different. Let’s see what Wema delivers
#NFA
post-image
JUST IN: 🇺🇸 $2 trillion added to the US stock market today.
post-image
$SOXL $TQQQ Across several positions today, the total from the low to the high came to 300k U, and I’ve secured the profits on all of them. I’ll leave the gains from here on to others. Thanks, market
post-image
SOXL-1.16%
TQQQ+10.32%
[NEW STREAMER] market update📉
live-cover
LIVE71
what?😂
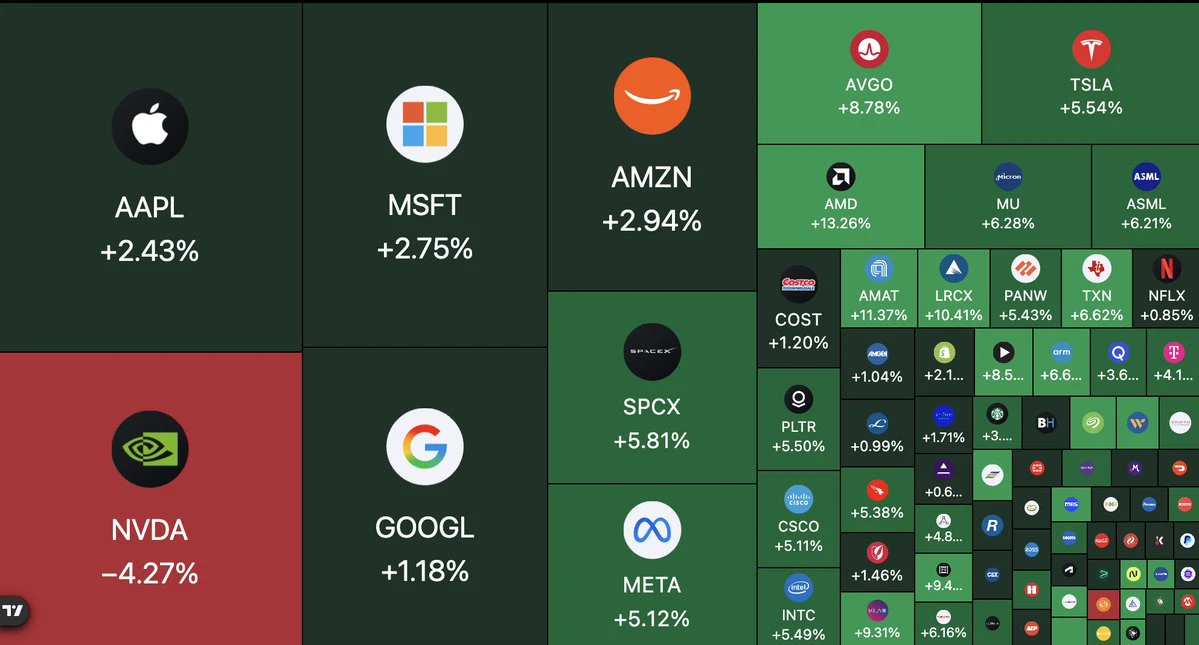
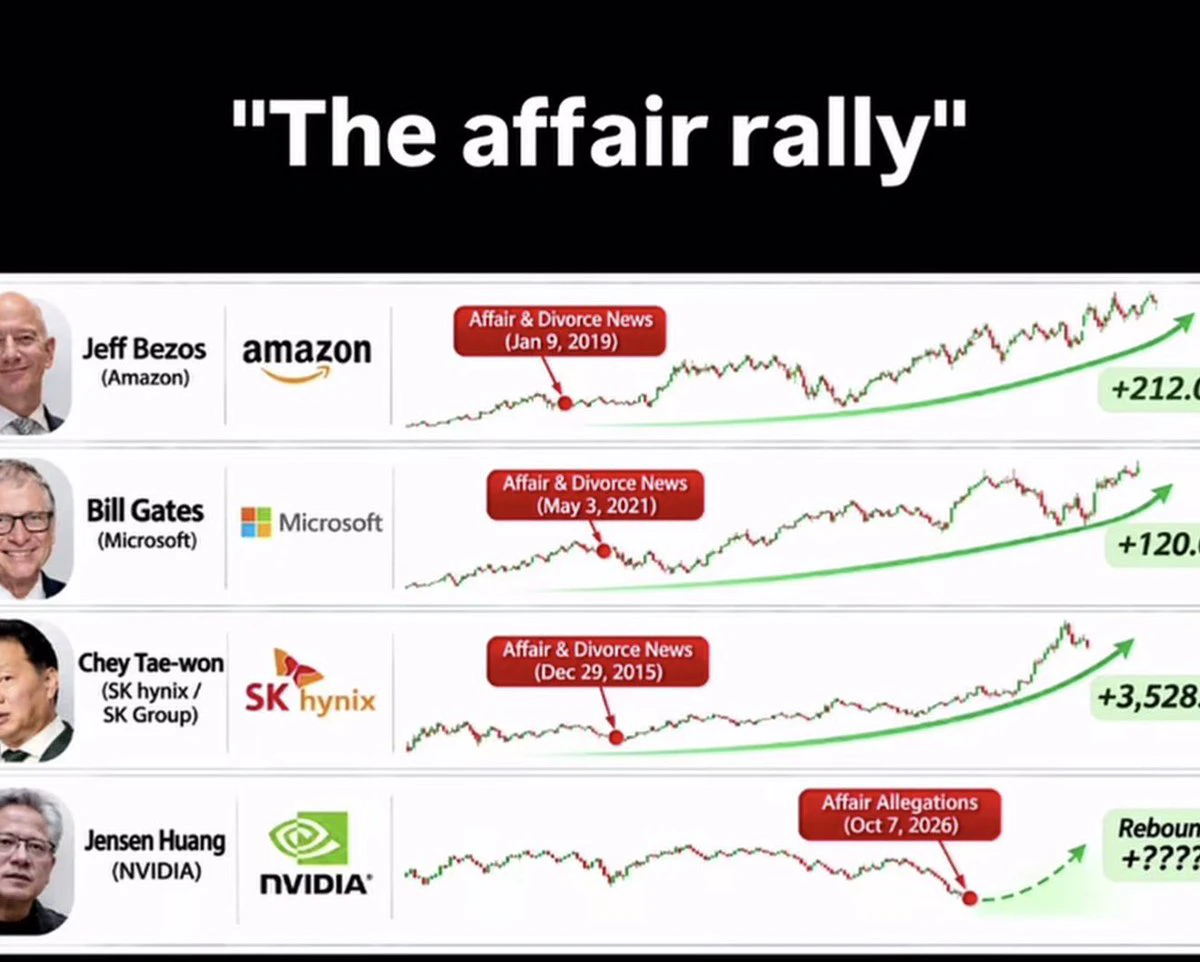
$AMZN $MSFT $NVDA
post-image
AMZN+2.95%
MSFT+2.75%
NVDA-4.34%
With less than 3 days left of minting, I’m giving a shout out to @MrEdogtagnft for being on the grind for 2 whole years in both the peak bull and the full bear market in ordinals for his Bitcoin Cyborgs 10k mint
While I’m at it, why not enjoy my dope ass Bitcoin Cyborg??
#NewProfilePic
post-image
ORDI-0.28%
BTC-0.67%
Load More

Join 40 M users in our growing community

⚡️ Join 40 M users in the crypto craze discussion

💬 Engage with your favorite top creators

👍 See what interests you

Trending Topics

USCPIDataIncoming

44.86k Views2.03k Discussing

The U.S. October CPI report will be released on November 10 at 8:30 a.m. ET. September CPI came in at 3.7% year over year, and markets will be watching closely for signs that inflation is cooling, especially in core CPI. A softer-than-expected reading could strengthen rate-cut expectations, while hotter inflation may pressure risk assets through higher Treasury yields and a stronger dollar. How do you think this CPI print will move $BTC, U.S. stocks and gold?

RedBullDoublePodiumInBrazil

10.37k Views30.59k Discussing

BTCFlashCrash

229.27k Views66.6k Discussing
View More