Square
Following
Hot
News
Notifications
Profile
Share your thoughts
placeholder
Article
particle-network:native — ANOTHER BOUNCE COULD BE COMING 👀
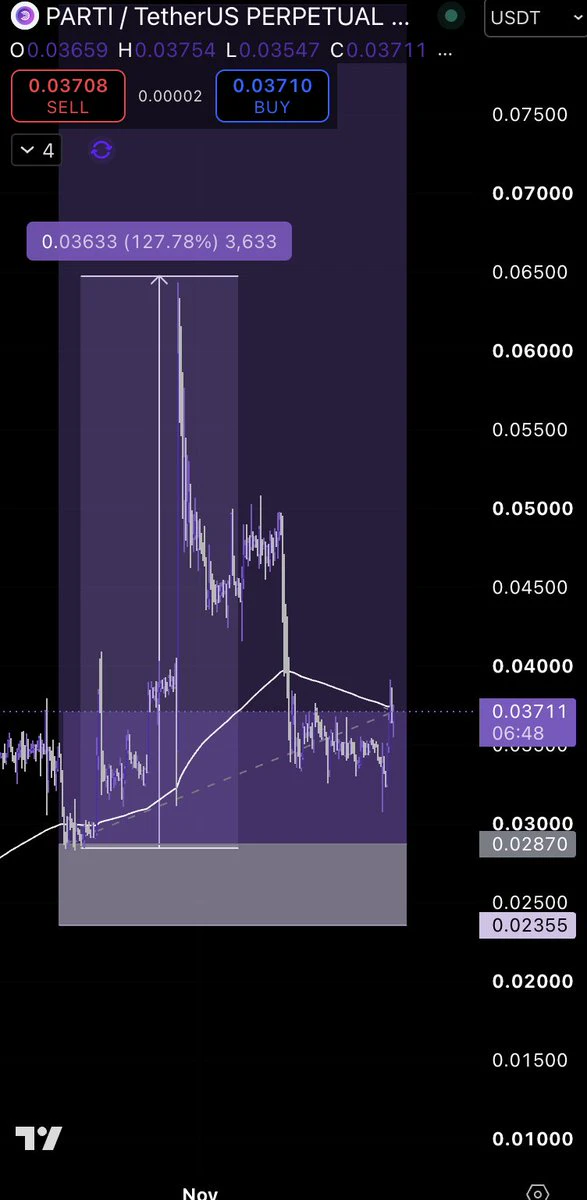
PARTI is showing signs of recovery after the sharp sell-off from its highs.
Price has been consolidating around $0.033–$0.036, with buyers continuing to defend the local support zone. Now we're seeing another push toward $0.037–$0.040, where the key resistance and moving average are sitting.
If buyers manage to reclaim this area, I expect another bounce attempt toward $0.045–$0.048.
The setup is getting interesting again. Watching for confirmation and a strong daily close. 🔥
post-image
PARTI-1.06%
Top 4 Altcoins that Crypto Banter (1.2 million followers) is watching for a potential reversal

Ran believes that Bitcoin and altcoins are currently overbought, so at current levels, it's possible to find good entry points with a reasonable risk-to-reward ratio.

🔸 Zcash ( #ZEC )

This token has retraced to the 0.618 Fibonacci level – an interesting level to gradually enter a long position.

$800-$830 – the main price range for accumulating a position. If it drops below this, the next important support level is in the $730-$750 range.

🔸 NEAR Protocol ( #NEAR )

NEAR has also reached the 0.6
BTC-0.67%
ZEC+1.16%
INJ-1.67%
ETH-1.26%
Trenches
IDOL
I
bade
b
IDOL
0x3b...ab07
Market Cap
$.
Change
.
24h Vol
$.
Holders
.
PIEVERSE
P
bade
b
PIEVERSE
0x0e...25a9
Market Cap
$.
Change
.
24h Vol
$.
Holders
.
FIONA
F
bade
b
FIONA
B34n...pump
Market Cap
$.
Change
.
24h Vol
$.
Holders
.
Singularity
S
bade
b
Singularity
7R4M...pump
Market Cap
$.
Change
.
24h Vol
$.
Holders
.
CLAUDIA
C
bade
b
CLAUDIA
2j5S...W2ZM
Market Cap
$.
Change
.
24h Vol
$.
Holders
.
$BULLA Don't rush to exit; triple upside is still ahead.
I’ve already opened a long position in the BULLAUSDT perpetual contract, currently up +0.74USDT in unrealized profit, with BULLA up +12.90% at the current price.
The market has just started moving. Hold your position and wait for the main rally.
Risk warning: Contract trading carries extremely high risk. The above is only a record of my personal trading activity and does not constitute investment advice.
post-image
BULLA+10.92%
When the market is good, everyone is a genius.

Only when the market turns bad do you realize how important having a clear strategy and acting on it is.

The market has been extremely volatile over the past two days, and I reckon plenty of people have been left holding the bag again.

Tell me your price levels. Some problems are better dealt with early than left until the very end, when you're scrambling for a solution. If you're not thinking about solving them, do you want to short housing prices in your neighborhood or elbow the concrete floor?
$BTC $ETH $ZEC
#BTC跌破6万美元关口
#Gate直通IPO第三期ANT配
BTC-0.65%
ETH-1.23%
ZEC+1.29%
Crypto Trade Today
live-cover
LIVE835
AAPL-1.83%
AMD-13.27%
PLTR-6.45%
NVDA-13.84%
MU-13.88%
$IDOL This rally is pretty intense—up 52.3% in 24 hours, with futures trading volume surging to 123.7 million USDT. The current price is 0.032374, just 1.3% below the 24-hour high of 0.032785.
Looking at the chart, for bulls to push higher, they first need to break through 0.032785 and hold above it to open up room for further gains; 0.020182 remains the key support to watch closely. On the 1-hour chart, the price is above the 21 EMA, and the RSI is nearing 80, signaling overheated short-term sentiment.
The question is: can buyers keep stepping in and push the price to new highs? $IDOL $MMT
post-image
IDOL-6.71%
MMT-2.35%
ENSO-3.03%
$NVDA This stretch of the move was “leaking” down, not “getting dumped”: it opened a notch lower and closed another notch lower, with not a single bearish candle worth screenshotting for over ten hours. A dump comes with emotion and rebounds; a leak has no emotion and just inches down one tick at a time. Three rebounds, each lower than the last; the second was only half the first. The layer of sell orders overhead went from a wall to a sheet of paper. The bands are tightening. But for individual stock tokens, tightening is an after-hours effect, not structure—so the only real evidence is that
NVDA-13.84%
  • 1
This is BEYOND insane:
A TOOTHPASTE COMPANY JUST SHOWED AI CAN PREDICT WHAT CUSTOMERS WILL BUY.
Colgate's researchers tested it against 57 real product surveys and 9,300 real people.
The AI got close to how consistent humans are with themselves.
Here's the trick.
If you ask an AI "rate this product from 1 to 5," it gives you safe, middle of the road answers. Useless.
So they stopped asking for a number.
They gave the AI a customer profile. Age. Income. Background.
Showed it a product.
And asked it to write what it honestly thought.
Then a second model turned those thoughts into a score.
The re
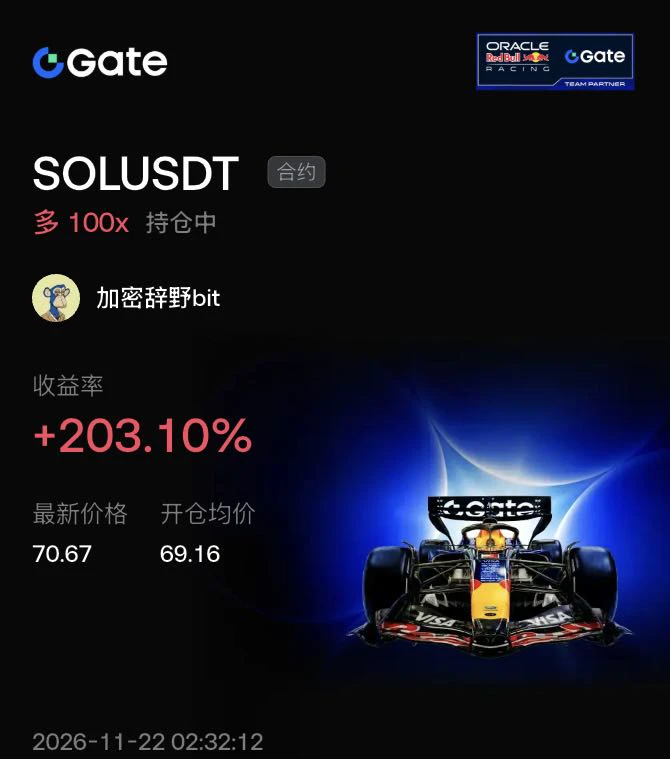
$SOL When trading, you must clearly understand the difference between higher and lower timeframes. The current rally in major coins after this sharp crash is basically just a brief recovery, so don’t mistake it for a reversal.

Look at this 1-hour chart: SOL plunged from 75 to 64.8—a brutal drop. After stabilizing at the bottom, it made a V-shaped rebound. I entered at 69, the right-side confirmation point, and went long with 100x leverage. I caught the profits from this sentiment-driven recovery, which pushed straight up to 70.67, netting 203%!

Why emphasize “brief recovery”? Because there’s
post-image
SOL-0.77%
BTC-0.65%
ETH-1.23%
  • 1
$PROM It has fallen to 4.36 five times, but has never broken below 4.3. If this coin breaks below 4.3, it will fall to 2. If it stabilizes here, it will soar to 5.5, 6, 6.5, 7.5, and 8.😎✋
post-image
PROM+0.45%
$SOL ‌ — 1H

The $64.87 dip might have been the reset SOL needed. Now all eyes are on $73.

What I like about this recovery is how buyers stepped in and gradually brought SOL back above the $67.94 Super trend. Price is now holding around $70.80, with higher lows giving the structure a healthier look.

Levels worth watching:

Resistance: $71.12 → $73.20 → $75

Support: $70 → $68.82 → $67.94

Potential long setup:

Entry: $69.80–$70.20

SL: $67.60

Targets: $71.12 / $73.20 / $75

Buyers currently hold a slight order-book advantage at 53.90%. A solid 1H close above $71.12 could bring the next l
SOL-0.77%
NVDA-13.84%
  • 1
  • 1
Let’s go, GPU miners—keep giving it your all!
post-image
The old carpenter planes a board, stopping after every three strokes to feel the grain. You can’t rush it; the grain has a say of its own.
$ZS These past seventy-two hours have followed a similar grain. The afternoon before yesterday, it was still grinding around 193, with turnover just under 2 million. Even a little volume could push it along, and nobody paid much attention then. By night, the price began edging up. The pace wasn’t fast, but every pullback bottomed higher than the last—this kind of move doesn’t look like retail traders scrambling to buy; it looks more like someone had paved t
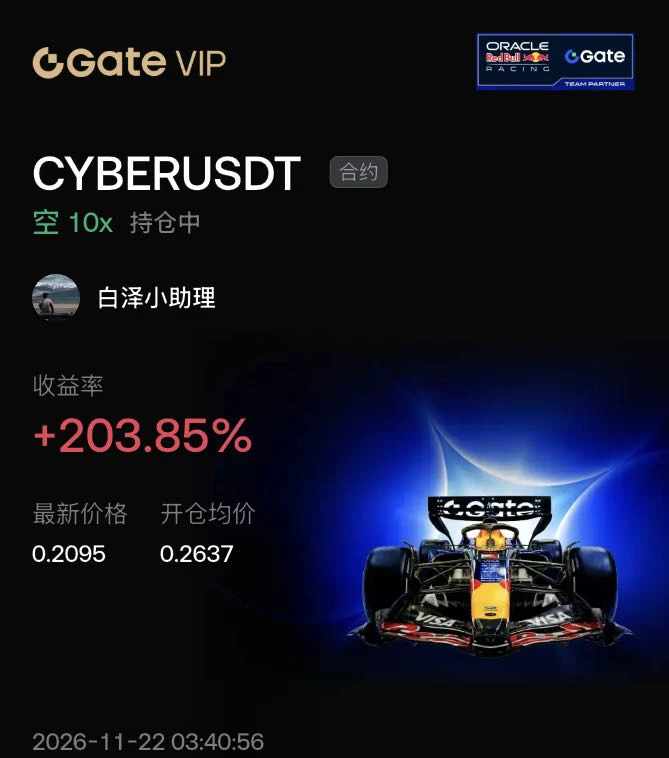
Laying out the November candlesticks, the entry price for this move, $CYBER , was exactly the high on November 12.

Here’s how that stretch played out: On November 5, the exchange resumed withdrawals, and it rose 51% in a single day. On the 6th, it surged again, reaching around 0.40 intraday, then headed steadily downward. It fell 18.4% on the 7th, 9% on the 8th, and 11.6% on the 11th. On the 12th, it surged to 0.2637 but couldn’t hold. From the 13th to the 19th, it closed lower every day, grinding down from 0.24 to 0.20.

On the 20th, it hit an intraday low of 0.2001, a new all-time low. On t
post-image
CYBER-5.14%
BTC-0.65%
AKE+6.39%
  • 1
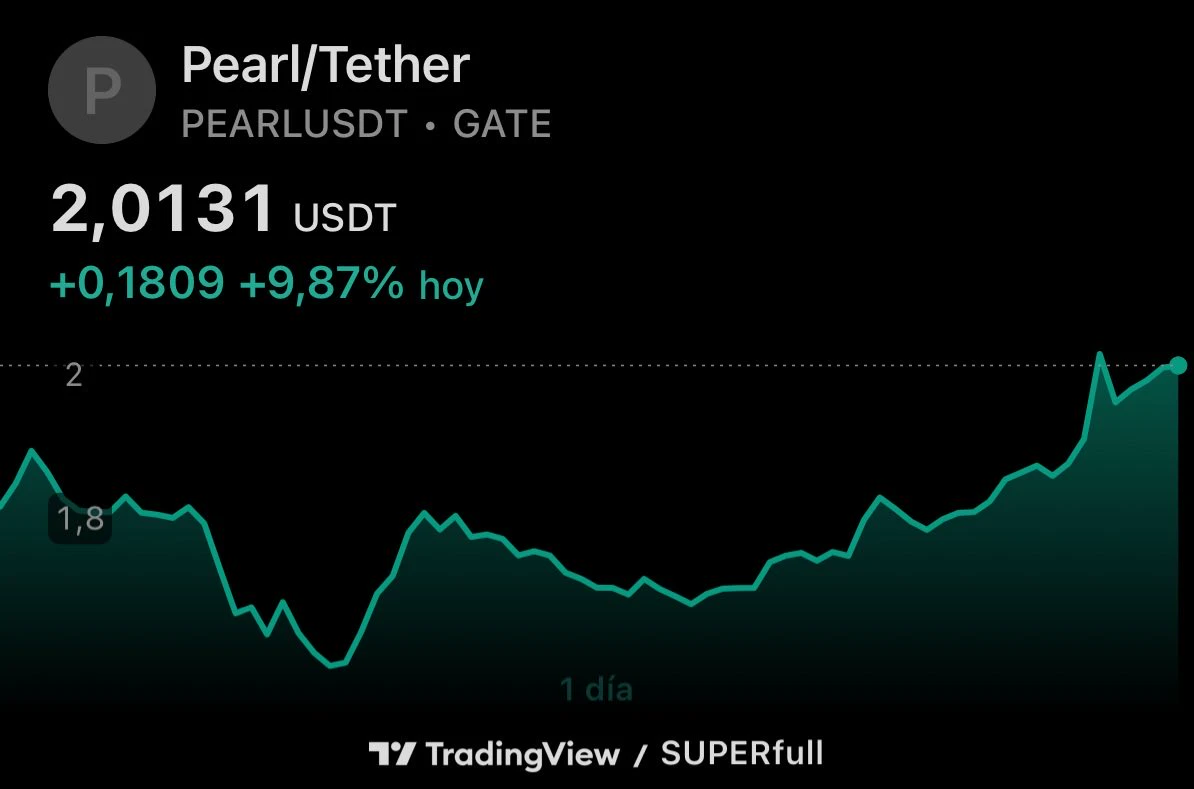
$EVAA Do the names of these two coins imply they’ll rise to $600? 😃
post-image
EVAA-0.49%
🚀🔥 THE MEMECOIN BATTLE IS ON!
Four big names. But who's really leading the pack? 👀
🐕 $DOGE
🐶 $SHIB
🐸 $PEPE
🟣 $M
Which one has the strongest community and the biggest potential? 💎
👇 DROP YOUR BIGGEST BAG + TAG A MEMECOIN HOLDER WHO NEEDS TO VOTE!
#Memecoins #Crypto #BullRun #MemeCore
post-image
DOGE-0.22%
SHIB-1.28%
PEPE+0.97%
M+6.44%
$VVV I think this is a bullish timeframe. Buy at 23.25 and 22.15. Targets: 24.07, 24.70, 25.30. Stop loss: 21.20
post-image
VVV+0.37%
$BCH finally stopped acting like a dead battery and surged straight back to its intraday high. I think prices holding above those moving averages finally makes it feel like it's time to make a move. Glad to see some real action here for once, instead of the usual circus. Take profit: 207.59 Stop loss: 191.59 Notable: $SKYAI : Current price 0.03601 - 24-hour change: +29.35%$ETH : Current price 1,683.54 - 24-hour change: +2.73%
post-image
BCH+1.05%
SKYAI-7.58%
Market Update
live-cover
LIVE1,879
BTC-0.67%
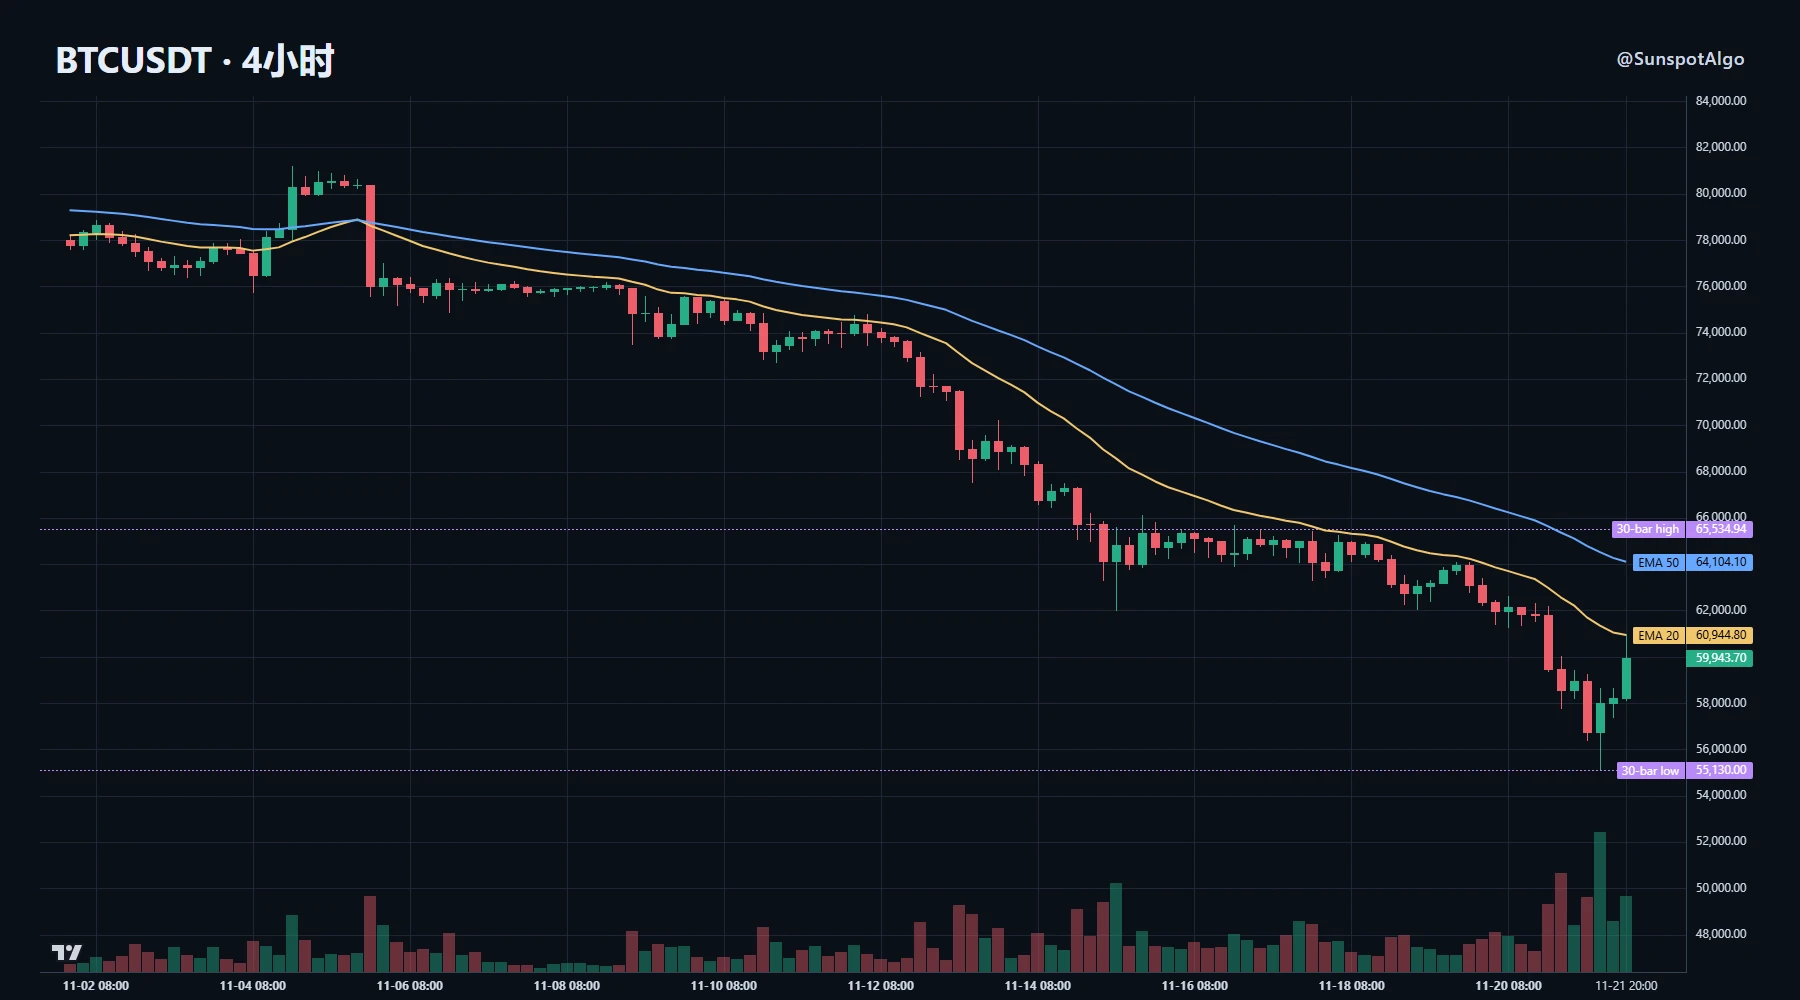
The past two days have been a classic chart trap: the daily chart is still in a bearish alignment, and the 4H chart keeps printing long wicks, making it look like a bottom.

First, the rhythm. After falling nearly 9.8% in 5 days, the price reached the 4.4th percentile of its 30-day range. The daily chart is capped by 69,500 and 74,500. The 4H candle closed at 59,900, with the short-term moving average at 60,900 overhead.

Open interest makes the rhythm clear. Open interest fell 4.3% over 24 hours, while the price staged a slight recovery; the funding rate was -0.0009%, near zero. Price up, ope
post-image
NAS100-4.60%
SPX+0.33%
VOLX+0.40%
XAUUSD-2.40%
Load More

Join 40 M users in our growing community

⚡️ Join 40 M users in the crypto craze discussion

💬 Engage with your favorite top creators

👍 See what interests you

Trending Topics

BTCBreaksBelow60K

2.1M Views29.9K Discussing

BTC fell below $60,000 on November 20 for the first time since July, alongside a tech stock selloff and broader pressure on risk assets. Will $60K become resistance, or can BTC quickly reclaim it? What price or volume signals would convince you that selling pressure is easing?

GateDirectIPOPhase3ANTAllocates92100Shares

786K Views4.9K Discussing

NvidiaDropsNearly14Percent

329.2K Views7.6K Discussing

View More