
Square
Following
Hot
News
Profile
Share your thoughts
placeholder
Article
#每周来晒 #沃什IMF讲话 Warsh's IMF Debut: AI Is "Most Consequential Change in My Lifetime," But No Rate Guidance
Fed Chair Kevin Warsh completed his most important international appearance of his tenure at the IMF-World Bank Annual Meetings in Bangkok. Asked by IMF Managing Director Georgieva, Warsh sent two core signals: high long-term optimism about AI productivity, and deliberate silence on the near-term monetary policy path.
AI: First Pushes Inflation Up, Then Reshapes the Economy
Warsh described AI as "the most consequential change in my lifetime for the US and global economy." But he conceded th
post-image
⚡ 𝗘𝗧𝗛𝗘𝗥𝗘𝗨𝗠 ($ETH ) 𝗠𝗔𝗥𝗞𝗘𝗧 𝗨𝗣𝗗𝗔𝗧𝗘
💰 Price: $2,405.70
₿ BTC Pair: 0.02948 $BTC
📊 𝗠𝗔𝗥𝗞𝗘𝗧 𝗣𝗘𝗥𝗙𝗢𝗥𝗠𝗔𝗡𝗖𝗘
🟢 1H: +0.12%
🔴 24H: -0.43%
🔴 7D: -4.08%
💎 𝗠𝗔𝗥𝗞𝗘𝗧 𝗗𝗔𝗧𝗔
📈 Market Cap: $293.85B
📊 24H Volume: $6.09B
🔹 Circulating Supply: 122.14M ETH
🔍 𝗠𝗔𝗥𝗞𝗘𝗧 𝗢𝗨𝗧𝗟𝗢𝗢𝗞
ETH is showing a slight hourly recovery, but its weekly performance remains negative. Traders may watch key support and resistance levels for signs of a stronger move.
⚠️ Stay focused on price action and manage risk carefully.
#ShareWeekly #USCPISoon
post-image
ETH-1.64%
BTC-0.96%
  • 4
  • 2
Trenches
AGT
A
bade
b
AGT
0x5d...e274
Market Cap
$.
Change
.
24h Vol
$
Holders
.
TSI
T
bade
b
TSI
0xf1...7b07
Market Cap
$
Change
.
24h Vol
$.
Holders
.
CNPY
C
bade
b
CNPY
0xc6...ddd2
Market Cap
$.
Change
.
24h Vol
$.
Holders
.
Q
Q
bade
b
Q
0xc0...0589
Market Cap
$.
Change
.
24h Vol
$.
Holders
.
Gato
G
bade
b
Gato
55A3...pump
Market Cap
$.
Change
.
24h Vol
$.
Holders
.
#BTC跌破8.2万 Technical read at $81,668: what the chart says about 81K and 80K
BTC is trading near $81,668, and the question on everyone's screen is whether 81K can hold or 80K gets tested next. Here is the technical picture, level by level, with no guesswork.
Where we came from
Early October looked bullish. BTC ran toward $87,000, then was rejected near that level on October 5, which triggered a cascade of leveraged long liquidations. The week's high was $84,323.70 on October 12, and the low was $79,841.60 on October 15, right after the hot CPI (3.7% year over year, core 2.6%). That is a 5.6% we
post-image
Falcon_Official
#BTC跌破8.2万 Bitcoin at $81,570: Has the CPI Shock Been Priced In, or Is $80,000 the Next Test?
Bitcoin’s move below $82,000 has shifted the market’s focus from the possibility of a $90,000 rally to the strength of the current support structure. Trading near $81,570, BTC is facing a combination of renewed US inflation pressure, changing Federal Reserve expectations, and uncertainty over leveraged positioning. The critical distinction is whether the market has already absorbed the inflation shock or whether another round of selling could follow.
September CPI Changed the Macro Picture
The US Bureau of Labor Statistics reported that headline CPI increased 3.7% year over year in September, accelerating from 3.4% in August. Monthly inflation reached 0.6%, compared with 0.4% previously. Core CPI, excluding food and energy, rose 2.6% annually and 0.3% monthly.
Energy was a major contributor. Gasoline prices climbed 9.1% in September, accounting for more than half of the monthly increase in headline CPI. The energy index advanced 5.2% during the month, while shelter costs increased 0.4%.
These figures complicate the outlook for monetary easing. Persistent inflation can keep interest rates restrictive for longer, potentially supporting the dollar and Treasury yields while reducing investors’ appetite for risk-sensitive assets.
However, the inflation report does not automatically guarantee another rate hike. The Fed must evaluate incoming economic data, employment conditions, and the persistence of price pressures before determining its next move.
Why BTC Fell Below $82,000
Bitcoin’s decline reflects the sensitivity of crypto valuations to macroeconomic expectations. When inflation exceeds forecasts, markets may reassess the timing of rate cuts or the possibility of further tightening. Higher expected borrowing costs can make speculative positions less attractive, particularly when leverage is elevated.
Market reporting following the CPI release showed Bitcoin falling to approximately $80,247 before trading around $80,743 in the subsequent session. BTC has since approached the $81,570 level referenced here, but a recovery from the lows alone does not confirm a trend reversal.
The key question is whether buyers are returning through sustained spot demand or whether the rebound is primarily driven by short covering. These two scenarios can produce similar price action initially but have different implications for durability.
The $81,000–$80,000 Support Test
At approximately $81,570, Bitcoin is close to an important psychological area. The $81,000 region deserves attention as a near-term reference, while $80,000 is the next major round-number level traders may monitor if selling pressure resumes.
A sustained recovery above $82,000, supported by stronger spot volume and improving market breadth, would help repair the short-term structure. If BTC repeatedly fails to reclaim that level, sellers may retain control and the market could revisit lower support.
A break below $80,000 would increase downside risk, but it would not automatically establish a prolonged bearish trend. Confirmation would require examining subsequent price acceptance, trading volume, and whether buyers defend the breakdown area.
These levels are technical reference points, not guaranteed turning points.
Liquidations and Leverage: The Hidden Risk
During sharp declines, leveraged long positions can face liquidation as collateral becomes insufficient. Forced selling can amplify downward momentum, creating a feedback loop in which falling prices trigger further position closures.
Open interest helps distinguish between different forms of selling pressure. If BTC declines while open interest contracts sharply, traders may be closing positions or being liquidated. If open interest rises during the decline, new positions may be entering the market, although the direction of those positions cannot be established from open interest alone.
Funding rates provide additional context. Persistently positive funding during weakening price action may indicate that long exposure remains crowded. A reduction in funding and leverage could help stabilize market conditions, but it would not independently confirm a bottom.
Is the CPI Shock Already Priced In?
Markets often react to the difference between expectations and actual data, not simply to whether a headline looks positive or negative. Some of the inflation risk may already be reflected in Bitcoin’s decline, but that cannot be established from price alone.
If Treasury yields stabilize, the dollar loses momentum, and BTC reclaims $82,000 with credible spot demand, the market could begin recovering from the initial shock. If inflation concerns intensify and leveraged positions continue unwinding, $80,000 may come into focus instead.
The most important signal is confirmation across macroeconomic conditions, spot activity, and derivatives positioning.
At $81,570, Bitcoin is at a decision point rather than a confirmed bottom. Preserving capital, controlling leverage, and waiting for price confirmation are more defensible approaches than assuming either an immediate rebound or an inevitable breakdown.
repost-content-media
BTC+0.28%
  • 4
🌞 **GOOD MORNING & HAPPY SUNDAY, CRYPTO COMMUNITY!** 🚀
A new Sunday brings fresh opportunities to learn, analyze, and prepare for the week ahead. The crypto market continues to demand patience, discipline, and a clear strategy. Whether you are trading Bitcoin, exploring altcoins, or holding for the long term, remember that successful trading is not about making a move every day — it is about making informed decisions at the right time.
₿ **BITCOIN (BTC): THE MARKET LEADER**
Bitcoin remains the key asset to watch when evaluating overall crypto market sentiment. Traders should pay close attent
post-image
BTC+0.28%
ETH-0.39%
  • 6
#GateBTCAndETHFuturesVolumeRanksTop3
Gate’s rise into the global top three for BTC and ETH derivatives trading volume highlights a major structural shift in cryptocurrency exchange liquidity. Whether this momentum is sustainable depends on several key factors and market dynamics:
Key Drivers Supporting Gate’s Momentum in the Derivatives Market
* Deepening Liquidity and Reduced Friction: High trading volumes—such as the $7.18 billion daily benchmark in BTC futures—result in tighter spreads and lower slippage, attracting institutional market makers, algorithmic traders, and high-frequency funds
BTC+0.26%
ETH-0.45%
GT-2.44%
XAUUSD-0.12%
  • 1
AI top-up free agent recruitment ends today🎉
Register on the website to automatically unlock premium agent wholesale prices
Plus 111r
pro5x 630r
pro10x 1050r
30-day warranty, invoices supported🧾, upgrades supported
Those with resources but no supply can set up a sub-site. Due to the large number of current users, setting up a sub-site costs 10 yuan. The blogger operates the store and provides an independent domain name; you only need to add your markup and sell
Portal:
#沃什IMF讲话 #ShareWeekly
Warsh’s IMF Speech: What Could It Mean for Inflation, Interest Rates, Bitcoin, and Global Markets?
Global financial markets are paying close attention to monetary policy as investors evaluate inflation risks, interest rate expectations, and the future direction of the US economy. Against this backdrop, has become an important topic for market discussion, particularly among investors following Bitcoin, technology stocks, gold, and other risk-sensitive assets.
Remarks by Kevin Warsh at an International Monetary Fund event can attract attention because markets are constantl
post-image
BTC+0.28%
XAU-0.11%
BTC MARKET UPDATES
live-cover
LIVE2,047
new market update
live-cover
LIVE1,289
The Fear & Greed Index is still in neutral territory, yet DOT has already fallen 5%. Is this a delayed correction or a weakening trend? The answer leans toward the latter: broad-market sentiment is not fearful, rebound momentum is lacking, and DOT’s moving averages are bearishly aligned while the MACD histogram remains negative, indicating weak follow-through rather than an independent move.
$DOT Current price: 1.11. MA5=1.1108 has crossed below MA20=1.1284, with the short- and medium-term moving averages forming resistance; RSI=40.8 is in the neutral-to-weak zone and not yet oversold, sugges
post-image
DOT-6.68%
HYPE-1.43%
WLD-7.58%
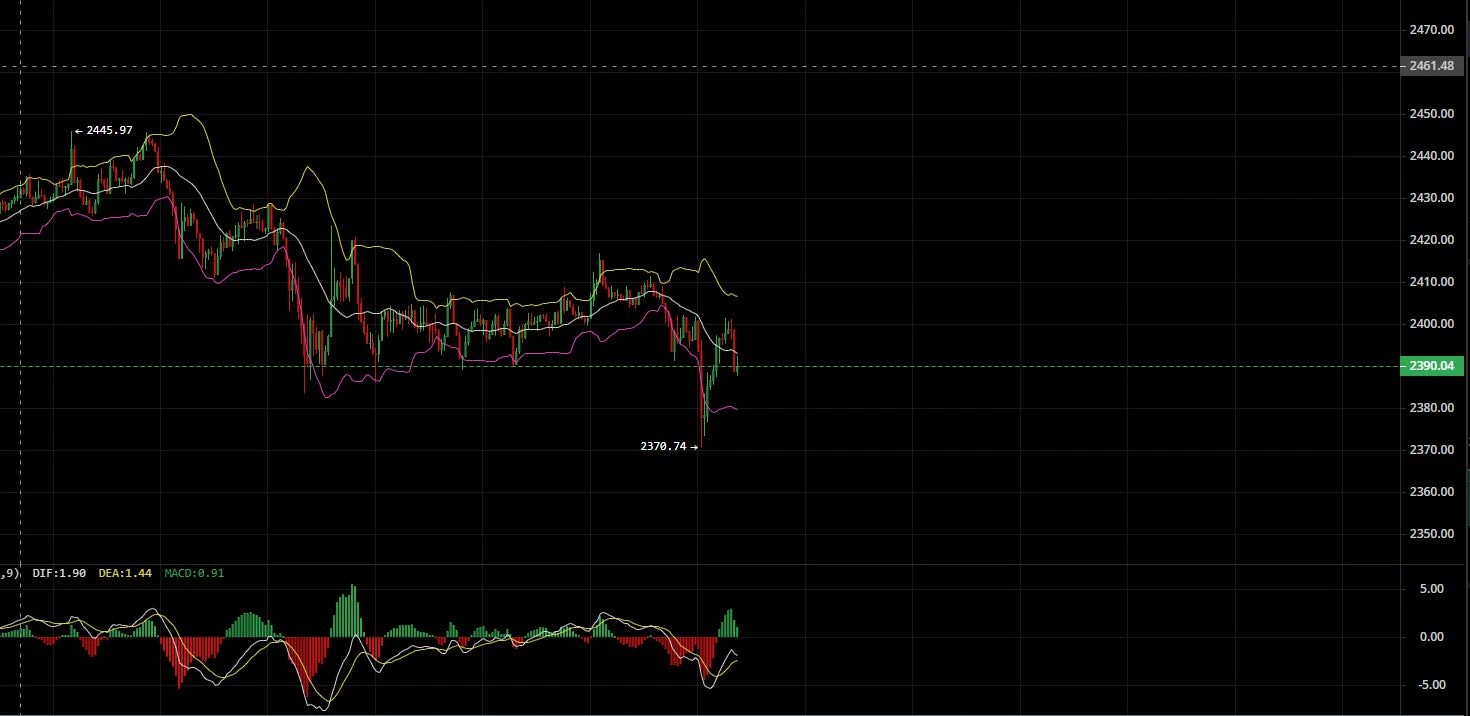
Starlink | October 18, 2026 ETH Outlook
Direction: Buy on pullbacks, test with a small position, and don't chase.
Entry zone: 2380–2400
Stop-loss: 2360
First target: 2440–2450
Second target: 2470–2480
ETH hit a low near 2313 in the previous move, then rebounded quickly, reaching back above 2420.
But this looks more like a recovery bounce after a sharp drop. Overhead resistance remains, so it can't yet be treated as a trend reversal.
Today, focus on the 2380–2400 area.
If price holds steady after a pullback, makes no new lows on the 1-hour chart, and shows a clear signal that the decline has st
post-image
BTC+0.26%
ETH-0.45%
【ETF Warning】ETF: As of October 16, net outflows totaled $82.4 million on the latest day and $338.7 million over the past 3 days, with outflows for 1 consecutive day → bearish (but the coin price rose slightly by 0.07% to $81,652, suggesting the bearish impact is fading and shorts have yet to make a move). ① Macro: The 10-year U.S. Treasury yield is 5.098%, up 1 basis point, keeping risk assets under pressure at elevated levels; the U.S. Dollar Index is 101.78, down 0.06%, with a weaker dollar providing a slight hedge; gold is at $4,181.10, up 0.26%. ② Market: BTC is currently at $81,652, up a
post-image
BTC-0.96%
$BAT Bottom line: The trend has not recovered. Treat the rebound only as a recovery attempt; the bias is bearish. Wait for a rebound into the moving-average resistance zone to scale into short positions, and don't chase the drop.
To judge whether a trend is healthy using moving averages, look at just three things: the price's position relative to the moving averages, the direction of their alignment, and whether they can be decisively reclaimed. MA5=0.17906 is currently below MA20=0.18519, with the short-term average below the long-term average—a bearish alignment. Although the current price o
post-image
BAT-10.80%
HBAR+1.80%
#Agt $Agt 0.116$ and 0.144
post-image
AGT-9.22%
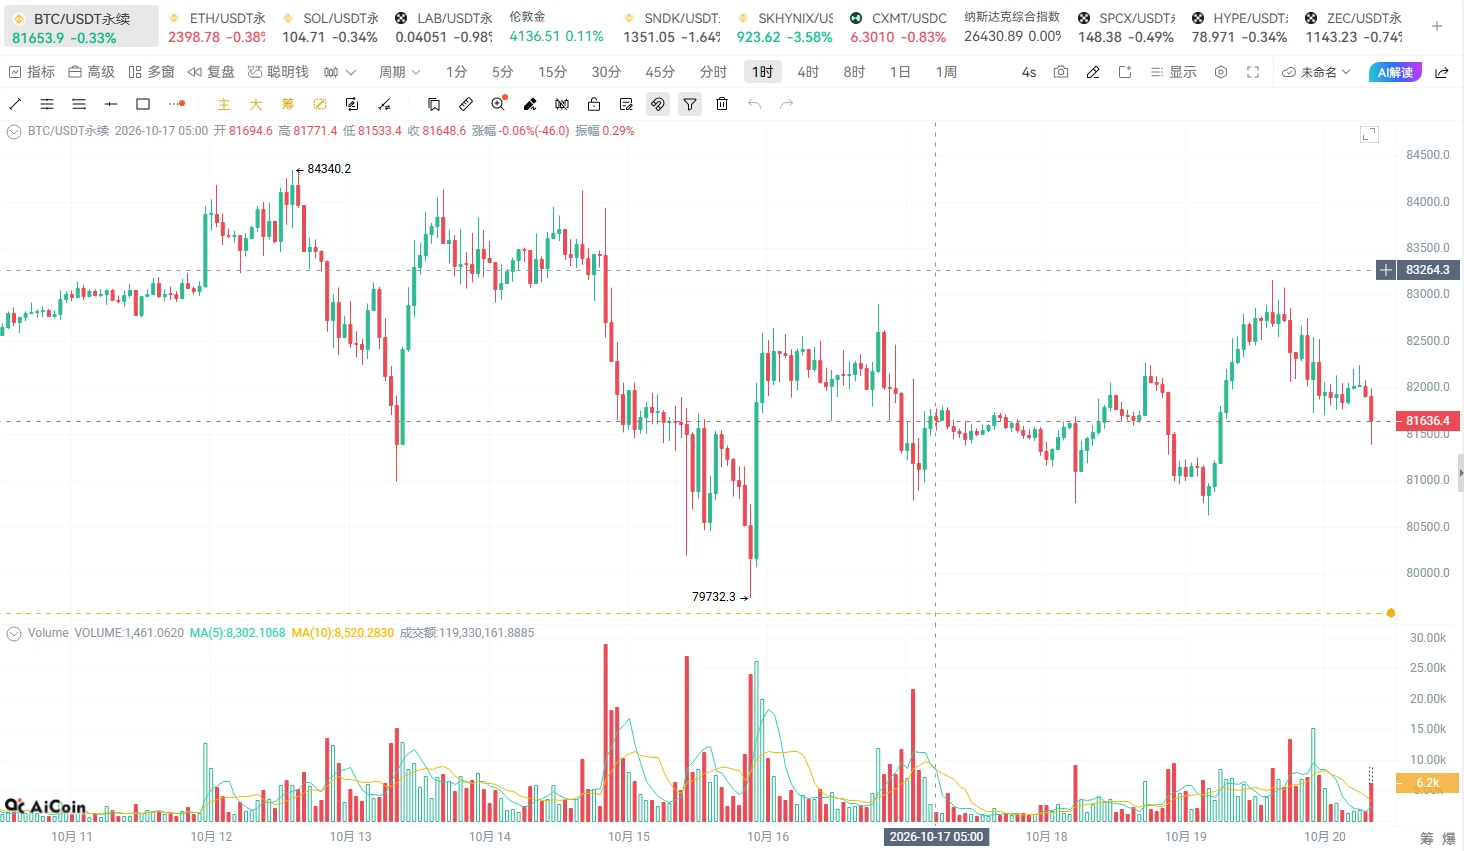
Yang Guang bit | October 18 BTC Strategy: Choppy Recovery, Intensifying Battle Between Bulls and Bears
[Today's Plan]
Entry timing: Set up short positions on a rebound into the 82000—82300 range; take light short-term long positions on a pullback to 80800—81000
Stop-loss settings: Set stop-losses for short positions above 82600 and for long positions below 80400
Staggered take-profit targets:
Short target: 81200—81400
Long target: 81800—82000
[Key Takeaways]
BTC saw sharp volatility this week. After CPI came in above expectations, it plunged to a low of 79725, then rebounded from oversold leve
post-image
BTC+0.26%
Two wallets dormant for over 12 years woke up and transferred out all 417 $BTC ($33.85M).
When these wallets first received their $BTC, the price was just $127 and $355, respectively. Their returns are now 638x and 229x.
BTC+0.28%
The base Discord roles were for aesthetics
post-image
Load More

Join 40 M users in our growing community

⚡️ Join 40 M users in the crypto craze discussion

💬 Engage with your favorite top creators

👍 See what interests you

Trending Topics

USSeptemberPPIBeatsExpectations

91.35k Views1.93k Discussing

US September PPI came in at 6.3% YoY, well above the 5.3% market expectation, pointing to renewed producer-side inflation pressure. Weekly jobless claims were 199K, broadly in line with forecasts. Could hotter inflation further reduce room for rate cuts, and what does it mean for $BTC, US stocks, and gold?

GateWCTCS9GlobalTradingCompetition

37.87k Views6.71k Discussing

GateBTCAndETHFuturesVolumeRanksTop3

53.8k Views1.84k Discussing

View More