





Square
Following
Hot
News
Profile
Share your thoughts
placeholder
Article
BTC at $81,303, ETH at $2,392, SOL at $103: Volume-price differences across three bearish candles
📊 Gate spot snapshot (October 17, 23:08 UTC): three bearish candles, but the declines are nowhere near the same magnitude: BTC -0.54%, ETH -1.33%, SOL -1.35%. BTC edged down, while ETH and SOL fell more than twice as much.
First, BTC. The current price is 81,303.2 USDT, with a 24-hour high of 81,791.5 and a low of 80,817.0. The day's range is less than 1.2%, with a trading volume of 233 million USDT. The price is hovering in a narrow range just above 81,000, and the 80,817 low has not been breach
post-image
BTC-0.23%
ETH-0.95%
SOL-1.06%
#GateBTCAndETHFuturesVolumeRanksTop3
Gate’s rise into the global top three for BTC and ETH derivatives trading volume highlights a major structural shift in cryptocurrency exchange liquidity. Whether this momentum is sustainable depends on several key factors and market dynamics:
Key Drivers Supporting Gate’s Momentum in the Derivatives Market
* Deepening Liquidity and Reduced Friction: High trading volumes—such as the $7.18 billion daily benchmark in BTC futures—result in tighter spreads and lower slippage, attracting institutional market makers, algorithmic traders, and high-frequency funds
BTC-0.23%
ETH-0.95%
GT-3.48%
XAUUSD-0.12%
MU-5.66%
  • 4
Trenches
AGT
A
bade
b
AGT
0x5d...e274
Market Cap
$.
Change
.
24h Vol
$.
Holders
.
CNPY
C
bade
b
CNPY
0xc6...ddd2
Market Cap
$.
Change
.
24h Vol
$.
Holders
.
Q
Q
bade
b
Q
0xc0...0589
Market Cap
$.
Change
.
24h Vol
$.
Holders
.
COVENANT
C
bade
b
COVENANT
0xcd...de79
Market Cap
$.
Change
.
24h Vol
$.
Holders
.
Gato
G
bade
b
Gato
55A3...pump
Market Cap
$.
Change
.
24h Vol
$.
Holders
.
Bitcoin market caps correlation
live-cover
LIVE42
🧧 First Post, First Reward! Earn up to 10 USDT on Gate Square!
New users 100% win! Climb the leaderboard and split 15,000 USDT!
Limited rewards—the more & better you post, the more you earn!
3 Key Rewards:
1️⃣ First-Post Bonus: 100% win rate, up to 10 USDT Red Packets.
2️⃣ Daily Top Picks: 3 creators daily get a 100 USDT coupon + official interact.
3️⃣ Monthly Board: Share 10,000 USDT & Gate merch (T-shirts, umbrellas, mugs).
✍️ Share market insights, trade recaps, or hot topics—any thought counts!
Post Now 👉 www.gate.com/post
Details: https://www.gate.com/announcements/article/102256
Gate_Square
🧧 First Post, First Reward! Earn up to 10 USDT on Gate Square!
New users 100% win! Climb the leaderboard and split 15,000 USDT!
Limited rewards—the more & better you post, the more you earn!
3 Key Rewards:
1️⃣ First-Post Bonus: 100% win rate, up to 10 USDT Red Packets.
2️⃣ Daily Top Picks: 3 creators daily get a 100 USDT coupon + official interact.
3️⃣ Monthly Board: Share 10,000 USDT & Gate merch (T-shirts, umbrellas, mugs).
✍️ Share market insights, trade recaps, or hot topics—any thought counts!
Post Now 👉 www.gate.com/post
Details: https://www.gate.com/announcements/article/102256
repost-content-media
$ZEC I went from an unrealized loss of 2,500U to a profit of 900U and closed at take-profit. The price came within 2U of triggering my stop loss, then fell. Thanks for sparing me
post-image
ZEC-1.97%
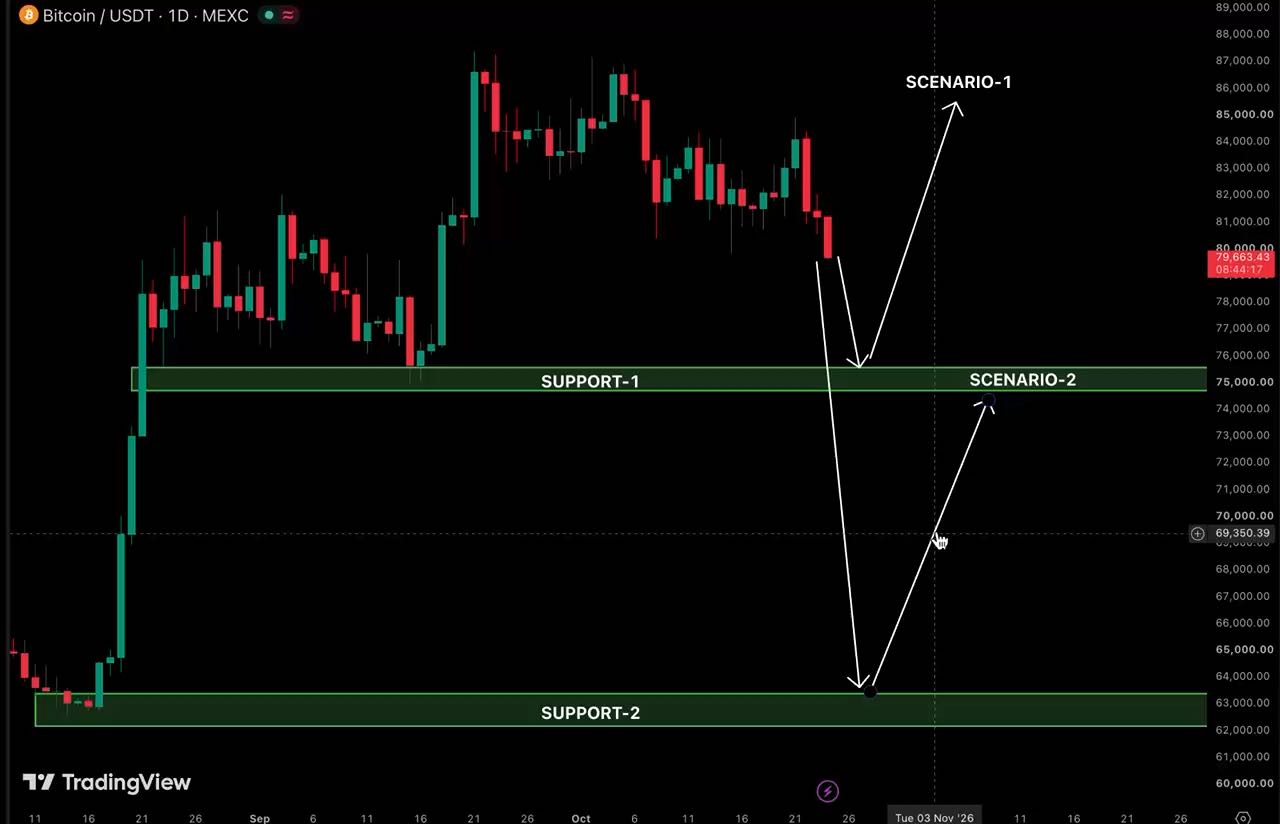
$BTC Confirming this scenario with ETH movement $ETH
post-image
BTC-0.23%
ETH-0.95%
#每周来晒 #美国9月PPI大超预期 #沃什IMF讲话 Brent crude has surged past $110. U.S. stocks and Bitcoin should be on alert ahead of November 3
What happens if oil prices keep rising, AI stocks begin to correct, and U.S. inflation refuses to come down?
Any one of these factors on its own may not trigger a major sell-off. But if they converge around the November 3 U.S. midterm elections, the market could face a difficult stress test.
01 The real trouble is oil pushing inflation higher again
Brent crude has broken above $110 per barrel. This price warrants caution because crude oil is no ordinary commodity: its
post-image
ThisIsTranslateContent:
#美国9月PPI大超预期 #沃什IMF讲话 Brent crude breaks above $110; U.S. stocks and Bitcoin should be cautious before November 3
What happens if oil prices keep rising, AI stocks start correcting, and U.S. inflation remains stubbornly high?
Each of these factors alone may not necessarily trigger a major sell-off. But if they converge around the November 3 U.S. midterm elections, the market could face a challenging stress test.
01 The real problem is oil pushing inflation higher again
Brent crude has broken above $110 per barrel. This price warrants caution because crude oil is not an ordinary commodity: its effects ripple throughout the economy through transportation, production, chemicals and consumer spending.
More importantly, U.S. CPI rose 3.7% year over year in September, while gasoline prices jumped 9.1% month over month. The simultaneous rebound in inflation and rise in energy prices have prompted markets to reconsider whether the Federal Reserve needs to maintain its restrictive policy. Here lies a key tension. If oil prices spike briefly and then fall, markets may quickly absorb the negative impact; but if geopolitical conflicts persist and oil prices remain elevated, inflation could prove more persistent than expected.
This would make the Fed's choices more difficult: cutting rates could prolong inflationary pressures, while keeping rates high could weigh on the economy and asset valuations. So what concerns us more than oil rising 3.6% on any given day is whether high oil prices will change market expectations for interest rates over the coming months.
02 AI valuations and high interest rates could reinforce each other
AI has been one of the most important drivers of the latest U.S. stock market rally. The market has been willing to assign high valuations to companies involved in chips, cloud computing and data centers because investors believe their revenue and profits will continue to grow.
But two questions need answering now: How much return will AI investment actually generate? If financing costs keep rising, are those returns still worth today's stock prices?
Reuters reported on October 15 that confidence in further gains for U.S. stocks depends heavily on strong earnings from large technology companies. Meanwhile, rising oil prices and Treasury yields are also putting pressure on high-valuation assets. This means that even if the AI industry's long-term direction remains unchanged, stock prices could first go through a valuation contraction. If technology companies report better-than-expected results, the market could still recover; if earnings disappoint while interest rates rise, the correction may be more than a short-term swing in sentiment.
03 Could the November 3 midterm elections become a black swan?
The election itself is not necessarily a black swan; the real risk to watch for is a gap between the election outcome and market expectations.
The U.S. midterm elections will determine control of Congress. Different outcomes could affect fiscal policy, tariffs, AI regulation and the progress of cryptocurrency legislation. For the crypto industry in particular, the pace of digital asset regulatory policy is worth watching.
But changes in congressional seats do not mean all U.S. policies will change immediately. The executive branch still has considerable policy tools at its disposal, and the specific impact will also depend on subsequent legislation and implementation.
What could truly catch markets off guard is a scenario in which investors expect the election to bring policy moderation, but the result instead creates greater policy uncertainty; or in which energy prices keep rising, increasing pressure on the government over inflation and the cost of living. If markets have already bet on a particular election outcome and the result fails to meet expectations, crowded positions could be unwound all at once.
04 What could happen to Bitcoin?
In the short term, Bitcoin should not simply be treated as a safe-haven asset. If oil prices continue to rise, inflation rebounds and the Fed sends a more hawkish signal, both technology stocks and crypto markets could come under pressure.
Bitcoin also faces an additional risk: liquidations of leveraged positions could amplify a decline. Conversely, if geopolitical tensions ease, oil prices fall and markets confirm that the Fed will not tighten policy further, risk assets could rebound quickly.
So, over the coming weeks, focus on four indicators: Brent crude prices, U.S. two-year Treasury yields, U.S. technology companies' earnings performance, and Bitcoin ETF flows and changes in futures-market leverage. These are more useful than simply guessing the outcome of a particular election.
05 How should you respond?
Volatility risks in U.S. stocks and crypto markets may rise for a while, but that does not mean a bear market is inevitable. If oil prices fall, yields stabilize and companies deliver on earnings, the market could still recover; if oil prices stay high, rate expectations continue to rise and AI earnings fall short of expectations, the market could face a deeper correction.
For investors, keep some cash on hand, manage leverage, and don't rush to buy the dip after a single decline or easily dismiss the value of long-term assets when markets panic.
The real risk to watch for is not any single negative factor, but several risks that could otherwise be absorbed separately happening at the same time. Treat the period before November 3 as an event window that warrants close attention, not as a predetermined market turning point. Going forward, watch oil prices, interest rates and earnings. The data will show where the market ultimately goes.
repost-content-media
BZ+0.12%
BTC-0.96%
GAS-4.65%
MARKET UPDATE
live-cover
LIVE50
$XRP bulls, this is your moment to show up
we’ve been printing lower highs and lower lows inside this channel, and price is approaching the area where a reversal could start
reclaim $1.40–$1.45 and the setup going to be more interesting
until then, it’s a potential breakout, not a confirmed one
Wait to plan your juicy R:R ahead
XRP-1.33%
Strategy Slumps 9.6% After MSCI Decision, Beats Bitcoin's Drop
The company’s disclosed bitcoin holdings remained about $5.1 billion above cost. MSCI’s final affected-company list is due Nov. 11.
⚠️ Personal market analysis only. NFA — manage risk and DYOR.
Educational content, not investment advice or a recommendation to buy, sell, deposit, or withdraw any asset. No paid promotion or referral/affiliate links.
post-image
MSCI-1.02%
BTC-0.23%
Bitcoin at $81,500 as bulls and bears lock in a tug-of-war
Bitcoin is trading around $81,500 on October 17, 2026, caught in a technical standoff that has left the market searching for direction. Short-term moving averages are flashing bearish signals, while longer-term averages continue to support buyers. The Relative Strength Index (RSI) sits at 46, and the overall technical assessment remains neutral.
With a market cap of roughly $1.639 trillion, daily trading volume of $13.967 billion, and a 24-hour range spanning $81,108.80 to $81,733.01, the market is locked in a tight consolidation patte
post-image
BTC-0.23%
hyperliquid:native is back at the 77–75 support area, the same zone that started the September rally.
A short-term bounce is around the corner. A break above the descending trendline would open the way back to 82–84.
Will this support hold again?
post-image
HYPE-2.88%
$CT I took the full -12.73% hit on this move: entered at 0.385, cut at 0.34, down 11 points. The post-mortem is simple: greed. Before the Fed minutes, I clearly saw $CT 24h volume shrink to just over 20M and large on-chain transfers start flowing out, but I still fantasized that dovish minutes would spark a rally. Instead, the minutes were hawkish, and $CT plunged straight through 0.35, hitting a low of 0.3155. I set my stop at 0.34 and at least stuck to my discipline, but the entry thesis itself was wrong—loading up on a small-cap token ahead of a macro event; correlation is no excuse, I was
CT-14.44%
Strong rebound in the main FVG zone on the 1-hour chart, with a pullback expected to the main liquidity area around $0.255–$0.260. ‼️Long $GTC Entry price: 0.235 - current price Take profit: 0.257 Stop loss: 0.215 Trade here $GTC 👇
post-image
GTC
GTC芝麻币
Gate.Fun
MC:$0.1Holders:1
0%
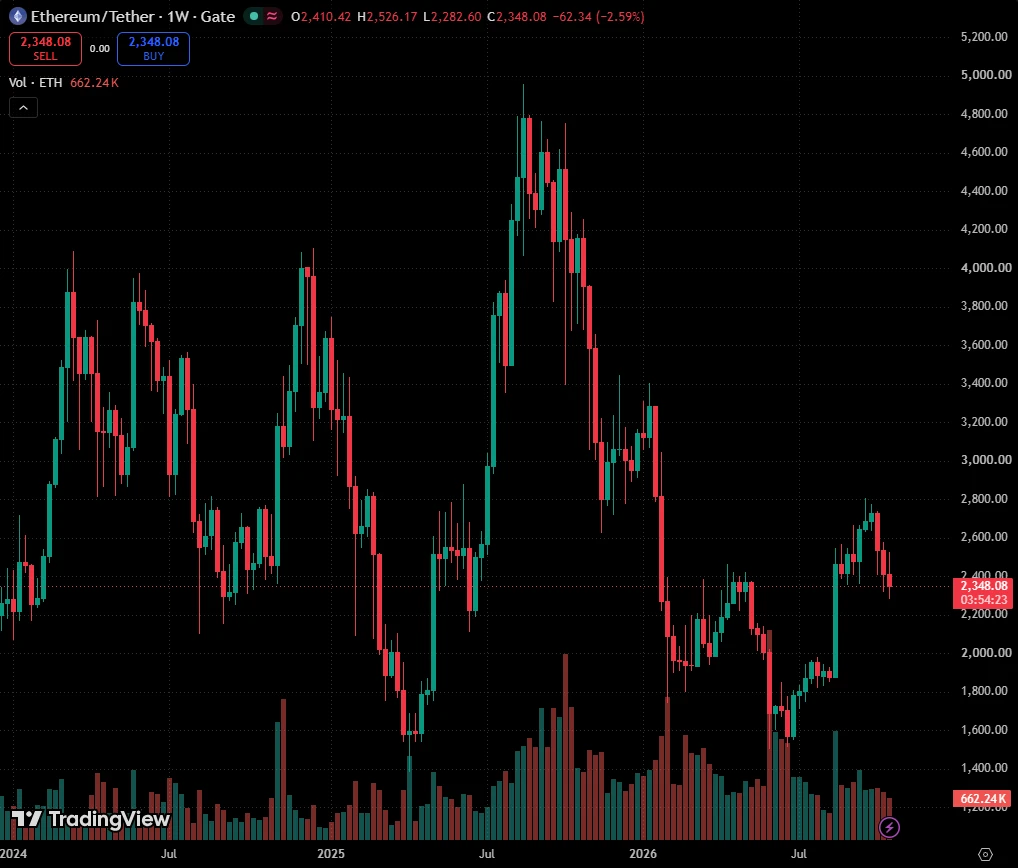
Same range just chop all around for $ETH .
Deviation? Continuation? Or still chop
ETH-0.95%
Next week: October 19 (Monday) — October 25 (Sunday) Daily Macro + Geopolitical Preview

Sources: CCTV, Cailian Press, Federal Reserve website, public schedules

✅October 19 Monday
📊Macro: The Financial Street Forum Annual Conference opens, with senior officials from the PBOC, SAFE, and CSRC delivering policy speeches; the Federal Reserve holds a closed-door discount rate meeting
🌍Geopolitics: Ukraine-U.S. talks may begin; the European Parliament opens discussions on Black Sea shipping security

✅October 20 Tuesday
📊Macro: China announces its LPR loan prime rate; closed-door meeting of F
Is this rally finally going to hold, or are we watching the same old liquidity trap again? Seeing $EIGEN
try to reclaim these levels today has me a little nervous. Is anyone else waiting to see whether buyers actually step in this time? Take profit: 0.261 Stop loss: 0.241 Other coins: $BTW : Current price 2.5221 - 24-hour change: +32.53%$ZEC : Current price 1,119.5 - 24-hour change: -1.89%
post-image
ZEC-1.97%
The ETH subscription signal called for a long near 2364; we hit take-profit perfectly and banked gains.
Subscribers are feasting every day
post-image
ETH-0.95%
Some things don't need to be seen to be trusted.
Opportunities are reserved for those who are prepared!!!
  • 1
The most unusual detail in today’s market action isn’t the declines themselves, but relative strength: $STRK fell 12.04%, $BAT fell 9.28%, while $ENA
in the same sector fell just 5.23%. Its RSI of 37.4 is also higher than STRK’s 31.3 and BAT’s 36.7. The smaller decline and higher indicator suggest selling pressure has been released more gradually, with funds not rushing for the exits.
But relative resilience doesn’t mean a reversal is underway. ENA is currently at 0.1885, still below MA5=0.18964 and MA20=0.193345, with the bearish moving-average alignment yet to recover. The MACD histogram
post-image
STRK-12.79%
BAT-9.07%
ENA-5.57%
Load More

Join 40 M users in our growing community

⚡️ Join 40 M users in the crypto craze discussion

💬 Engage with your favorite top creators

👍 See what interests you

Trending Topics

USSeptemberPPIBeatsExpectations

91.35k Views1.93k Discussing

US September PPI came in at 6.3% YoY, well above the 5.3% market expectation, pointing to renewed producer-side inflation pressure. Weekly jobless claims were 199K, broadly in line with forecasts. Could hotter inflation further reduce room for rate cuts, and what does it mean for $BTC, US stocks, and gold?

GateWCTCS9GlobalTradingCompetition

37.87k Views6.68k Discussing

GateBTCAndETHFuturesVolumeRanksTop3

53.8k Views1.81k Discussing

View More