Square
Following
Hot
News
Profile
Share your thoughts
placeholder
Article
$T Up 38% in a day, the sentiment index shot straight to 92, deep in extreme greed, with funding at +0.18%—the third time in the past three months we’ve seen a premium this high. The last time was the meme season in May: after funding spiked to 0.21%, the market pulled back 27% within 48 hours. History doesn’t repeat, but it rhymes.
$T’s 24-hour trading volume is now 204 million, and turnover has already scrambled the token distribution. It hit a high of 0.0076 and then dumped—a classic sign of sentiment overextension. My sentiment gauge reads: Fear and Greed Index at 92 (extreme greed), fundi
MEME-3.50%
I'll just treat it like play money and have fun
post-image
Trenches
ZIG
Z
bade
b
ZIG
0x8c...1145
Market Cap
$.
Change
.
24h Vol
$.
Holders
.
CNPY
C
bade
b
CNPY
0xc6...ddd2
Market Cap
$.
Change
.
24h Vol
$.
Holders
.
STONK
S
bade
b
STONK
6GmA...UNgx
Market Cap
$.
Change
.
24h Vol
$.
Holders
.
BTC
B
bade
b
BTC
C5xp...pump
Market Cap
$.
Change
.
24h Vol
$.
Holders
.
LIGHT
L
bade
b
LIGHT
0x47...3c0e
Market Cap
$.
Change
.
24h Vol
$.
Holders
.
Why Are You More Likely to Lose Money After a Winning Streak?
In cryptocurrency trading, consecutive losses can make people cautious, but consecutive wins can sometimes make them let their guard down.
After making a profit on several trades in a row, many people can’t help but feel:
“I’ve figured out how the market works.”
So they start increasing their position sizes and loosening their stop-losses, while gradually abandoning the trading plans they once followed strictly.
It’s only when an unexpected drawdown wipes out a large chunk of their accumulated profits that they realize the risks may
post-image
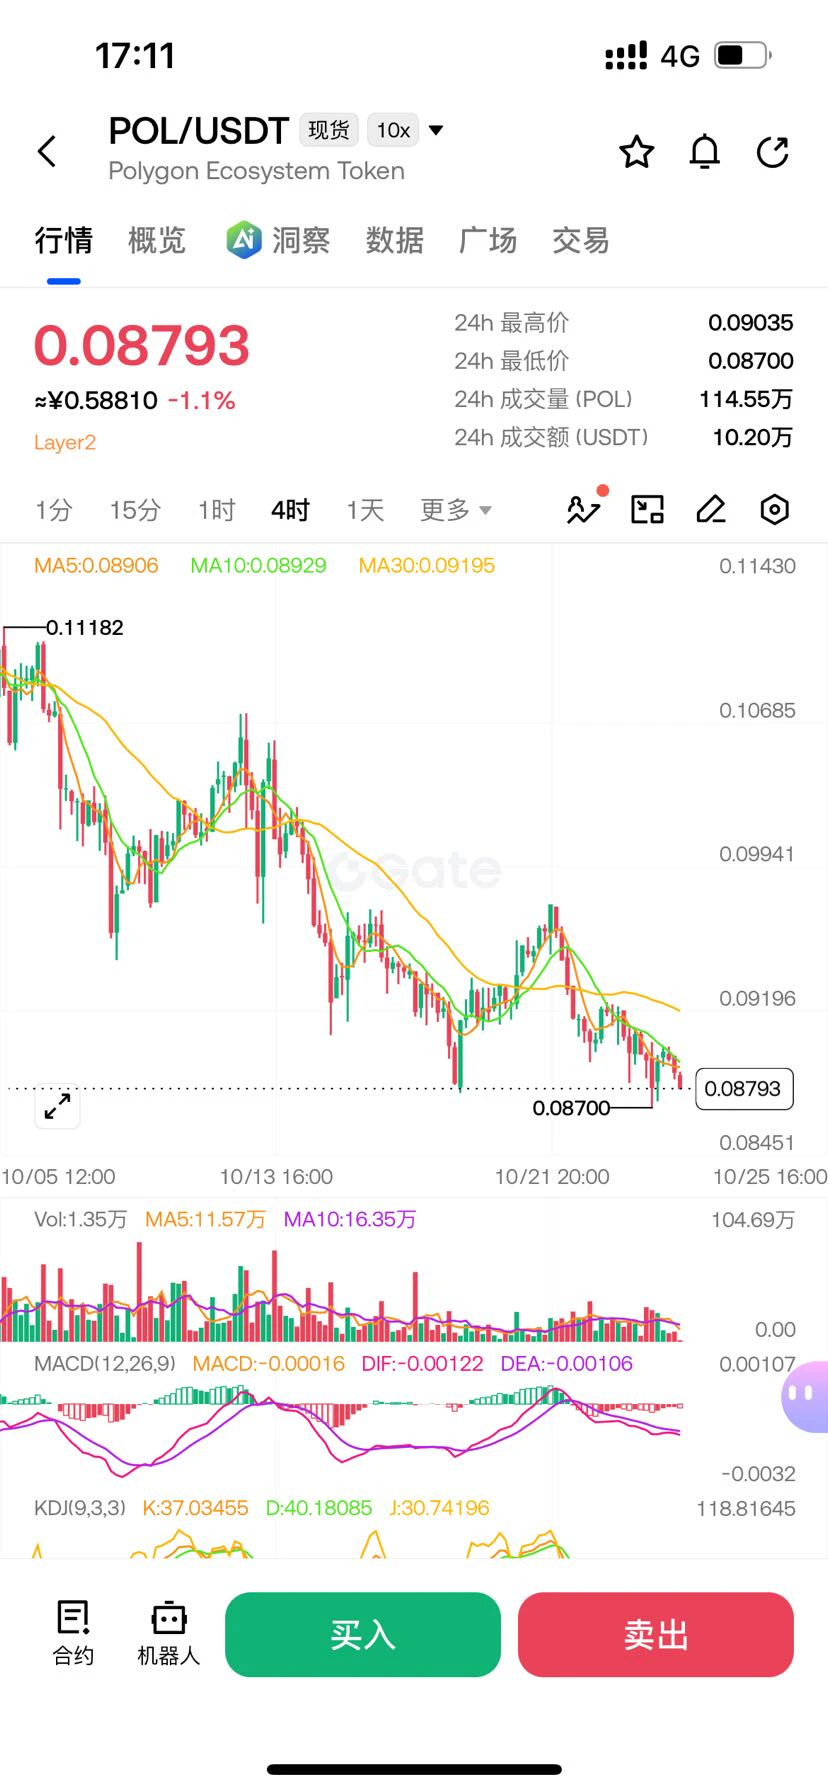
$POL I don't understand, but I'm deeply shocked.
52.92 million tokens poured into the staking contract, but the afternoon market was dead as a doornail. Volume stayed just as low, and the price kept grinding down.
Locked up for nothing? Who are these shady market makers putting on this show for?
Six months ago, this news would have been enough to push up two bullish candles. Now it doesn't even make a ripple. The market has gotten wise—who still believes that locking up tokens is bullish?$POL ‌
post-image
POL-1.26%
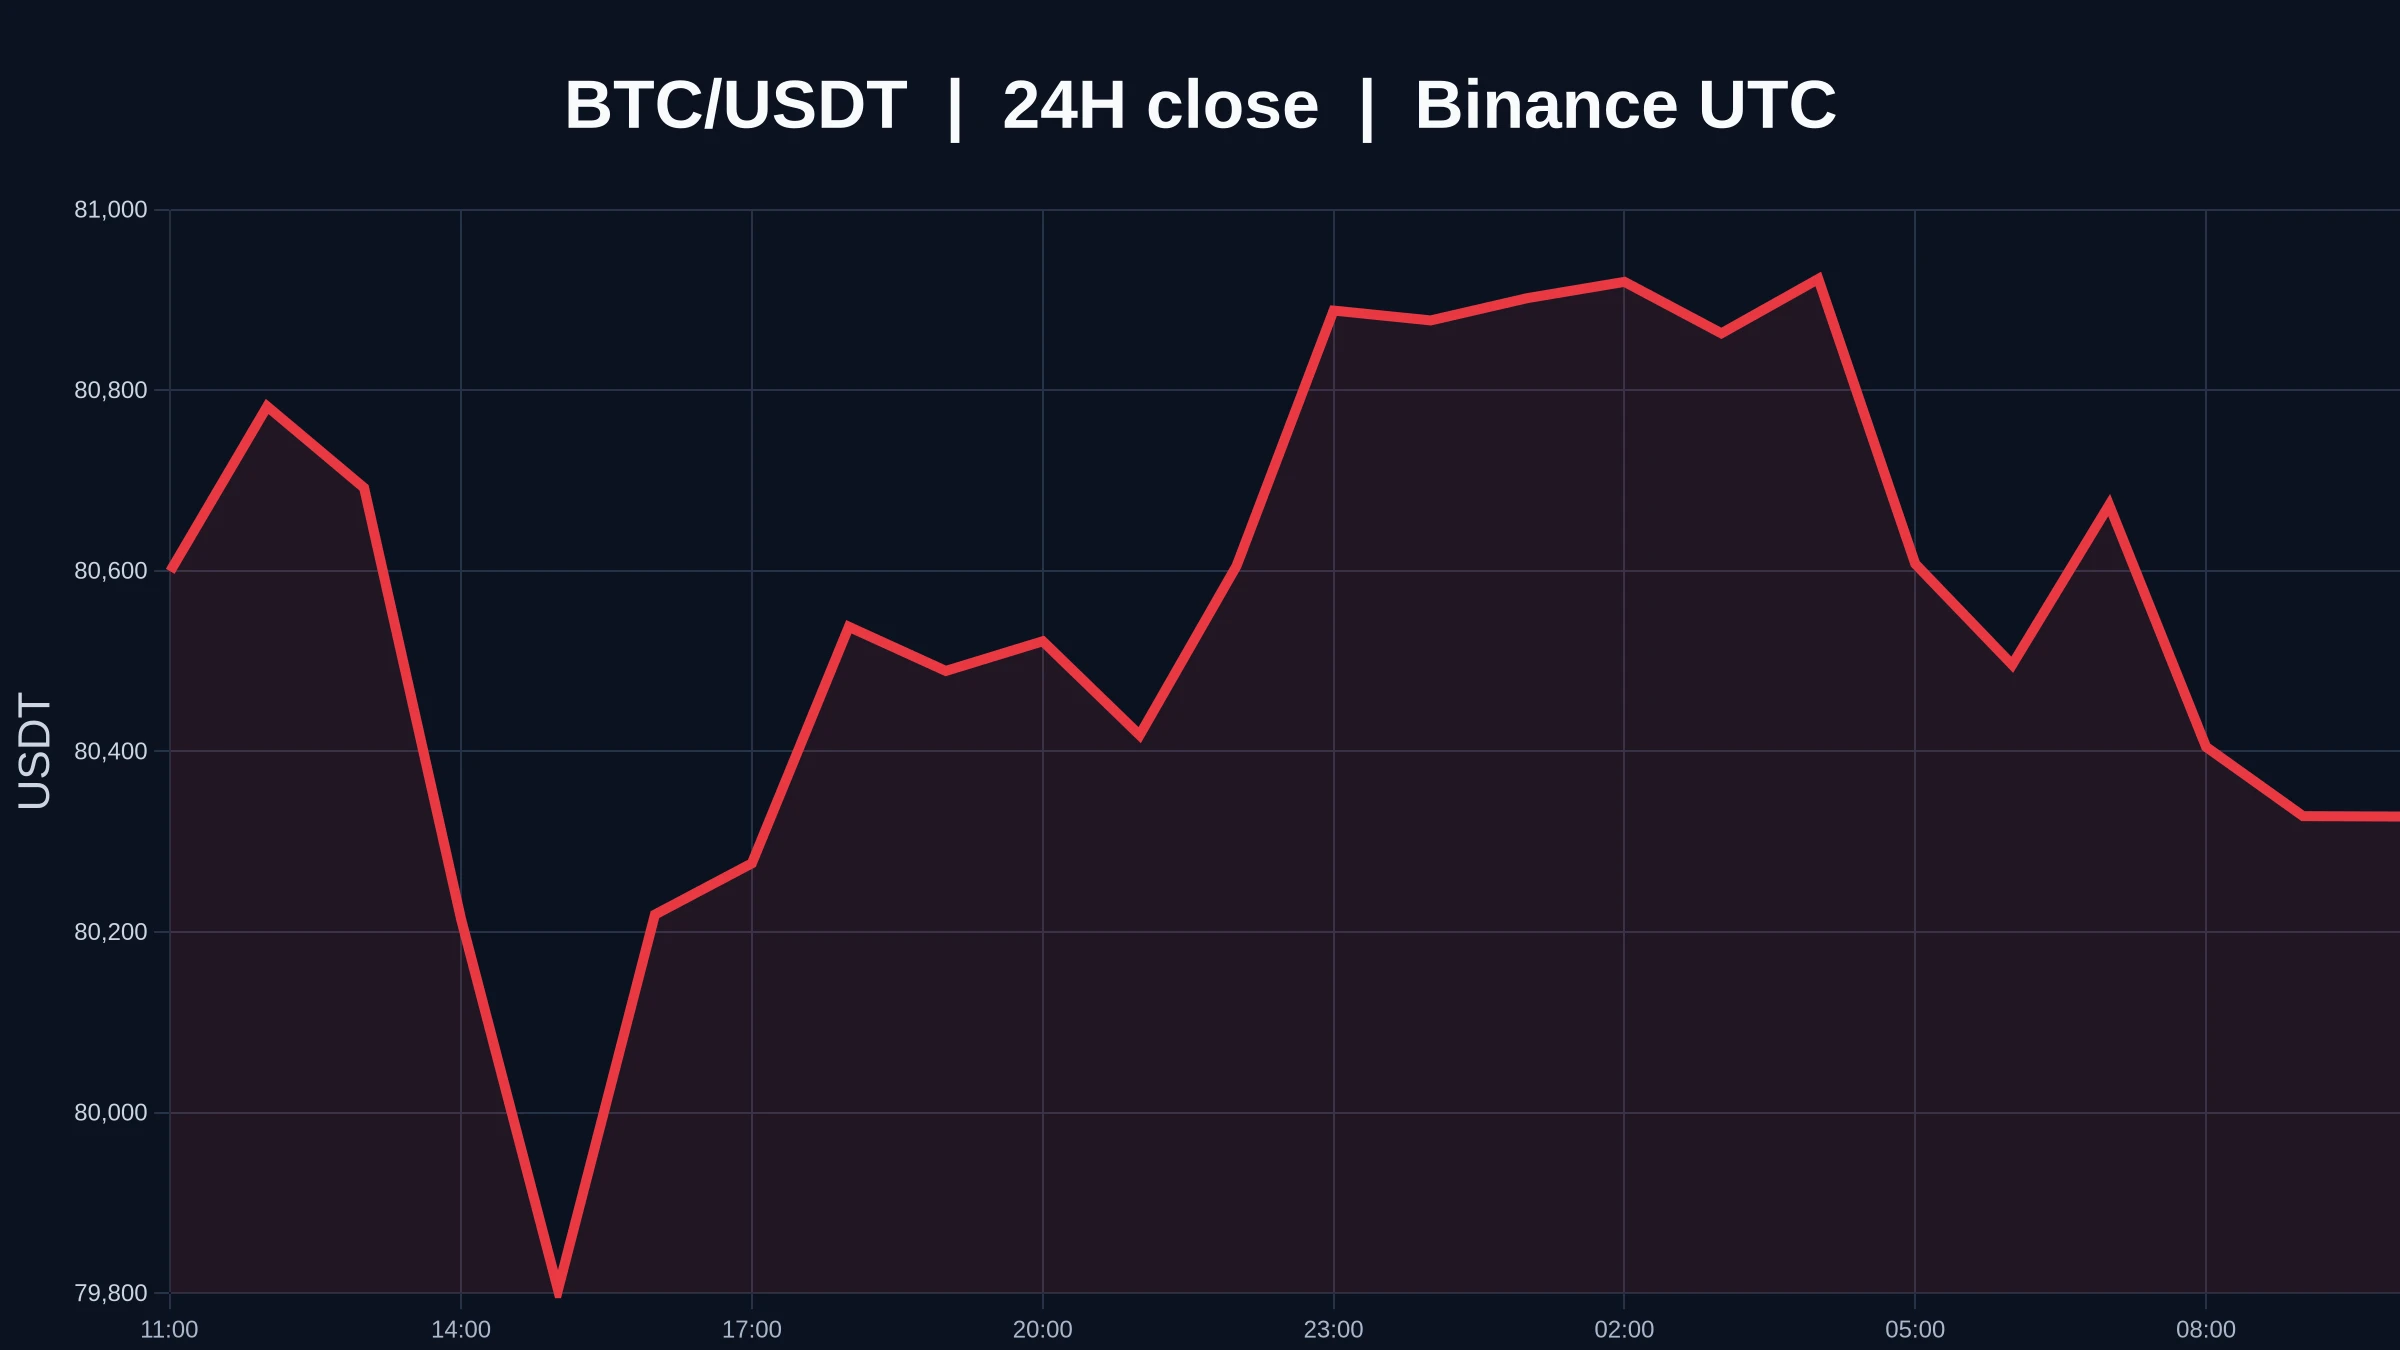
$BTC has already moved, but volume has not followed. The current price is 80,347.78 USDT, with a 24-hour range between 81,033.69 and 79,220.74. Both the 1-hour and 4-hour trends are weak, and volume participation is only 0.24x.
For now, the bias is weak, but a brief rebound cannot be ruled out. The 1-hour support is at 79,220.74, with resistance at 81,033.69. This move only has a chance to continue if the price gets above 81,033.69 on strong volume; if it merely touches that level and then pulls back, it can only be treated as noise.
Do you put more faith in the current direction, or do you th
post-image
BTC-0.43%
On the baby's third day, they slept for only about 15 hours.
We just got discharged and came home today, and now we're back at the hospital for phototherapy.
Ugh, this is really exhausting.
post-image
#SpotGoldFallsBelow$4000 #ShareWeekly
Spot Gold Falls Below $4,000: Full Analysis of the Breakdown, Drivers, Current Levels, Outlook, and Trading Considerations
Spot gold has slipped below the psychologically important $4,000 per ounce level, marking a notable technical and sentiment shift in the precious metals market. Recent trading saw prices trade as low as approximately $3,975–$3,986 before hovering near $3,990–$3,997 in late sessions. Futures also reflected the pressure, with weekly declines of roughly 4% in some reports, representing the steepest weekly drop since June. This move comes
XAU-0.12%
USIDX+0.13%
  • 1
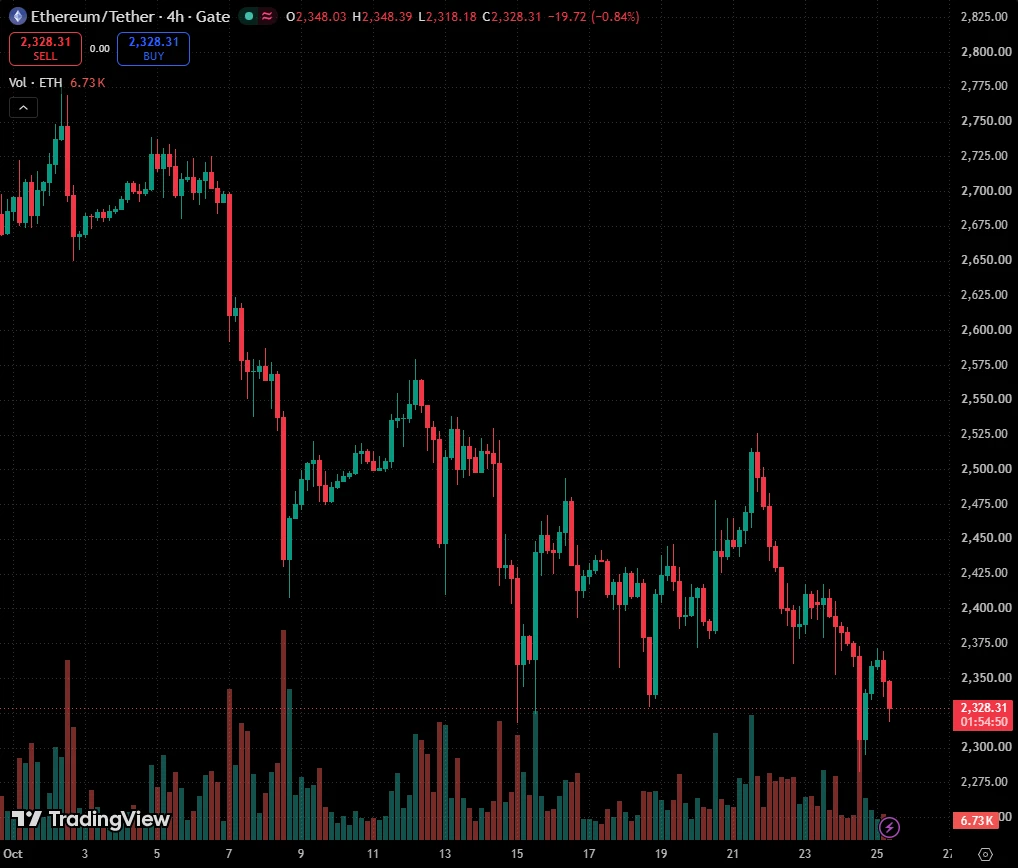
$ETH ETHEREUM (ETH/USD): Very Bearish Outlook
I see two strong bearish signals on Ethereum on an intraday timeframe.
The price violated two significant structures: a vertical falling resistance trend line and the neckline of an inverted head and shoulders pattern.
It is highly probable that the market will continue to decline to at least 2260.
post-image
ETH-1.92%
NEW TREAMER (Bitcoin Update)
live-cover
LIVE1,576
hype short hits $54.57M-$5.56M unrealized profit
live-cover
LIVE2,012
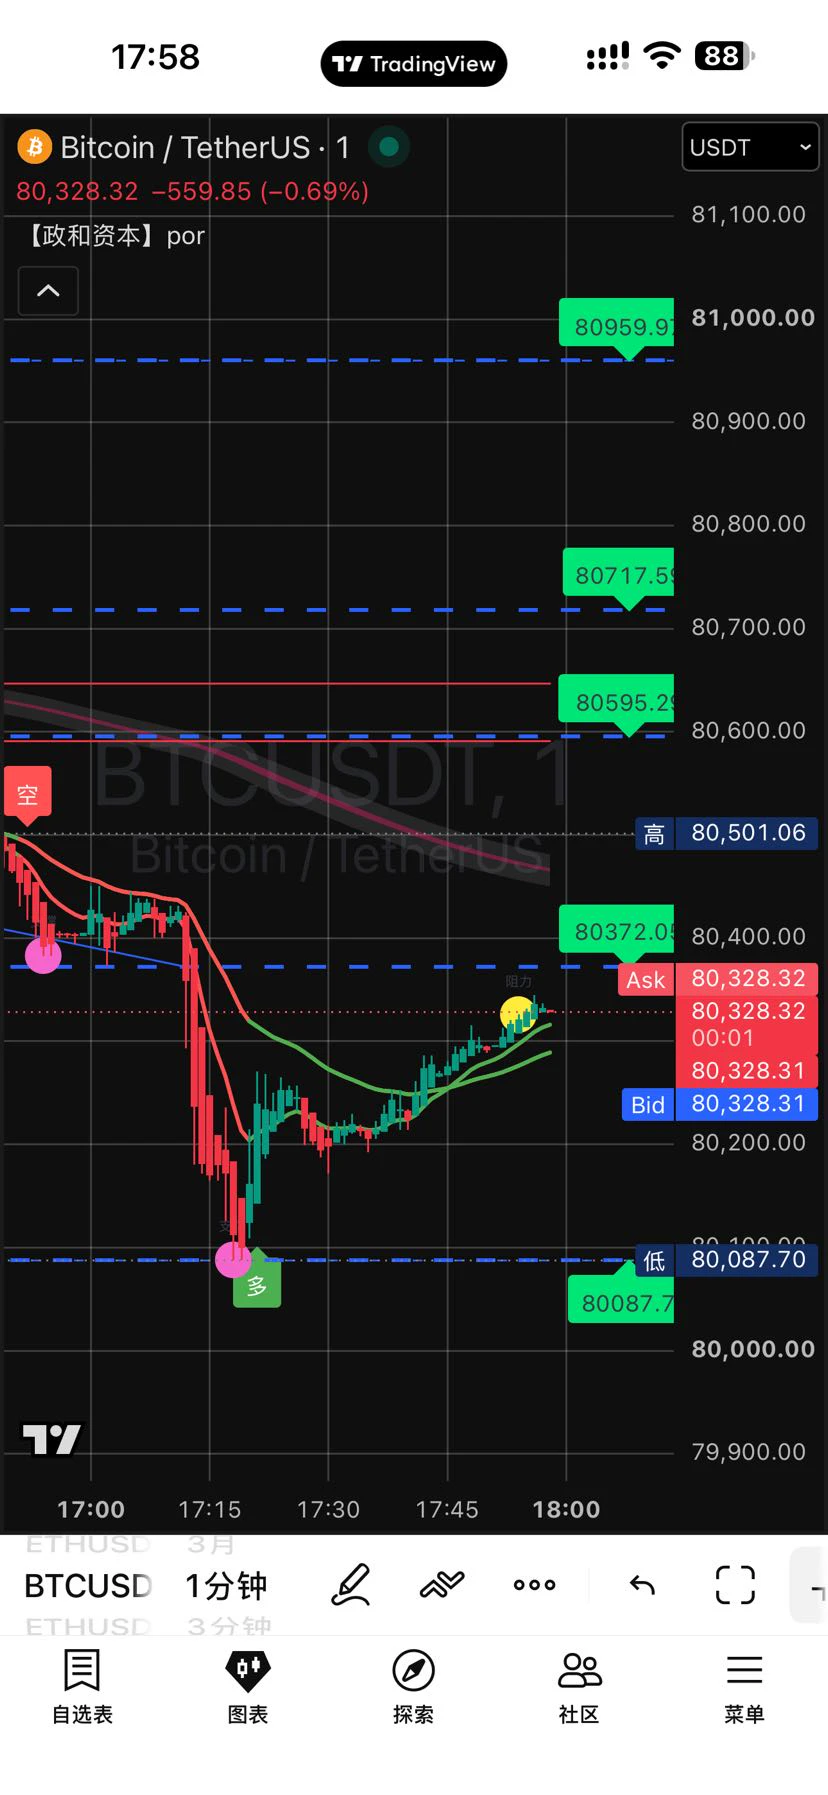
October 25, 2026 (Sunday) BTC Contract Analysis and Strategy (as of around 18:00 HKT)
Current Market Overview
BTC is currently trading around $80,000–$80,600, down slightly by approximately 0.3–0.9% over 24 hours. On Saturday evening, it briefly dipped to around $79,200–$79,600 (a one-month low) before rebounding slightly. It is Sunday, traditional markets are closed, and liquidity in crypto markets is relatively thin, which may amplify volatility.
The price has fallen below the $81,000–$82,000 range seen over the previous few days and slipped below the 50-day moving average. Weekend funding r
post-image
BTC-0.48%
Recently, maybe all the books I've been reading have been too rational
Looking back at my previous posts, I see I’ve been rationalizing my emotions
But I do usually read some abstract stuff too
I can feel myself detaching from my usual mindset
That feeling of drifting away
I’ve felt it again after watching some movies
This kind of beauty is nice too
post-image
Opened a new long position on $SAND
. Position details: Entry: 0.04773 - 0.04815 Take-profit A: 0.05016 Take-profit B: 0.05194 Stop-loss: 0.04630. Selling is still ongoing at the 24-hour low, and RSI is extremely oversold? A rebound after the bear trap is coming soon. Keep adding to the position! Try this trade here. The following assets are still on my watchlist: $SOL and $TAG .
post-image
TAG+16.36%
France’s PMI fell back to 48.4, down from 51.1 last month, slipping below 50. This is an early sign of recession—not an alarm, but a preview. If you have exposure to European cyclicals, weigh your position carefully. Don’t wait for the data to confirm it before taking action. Save this assessment and come back tomorrow to verify it. #Macro
PMI
post-image
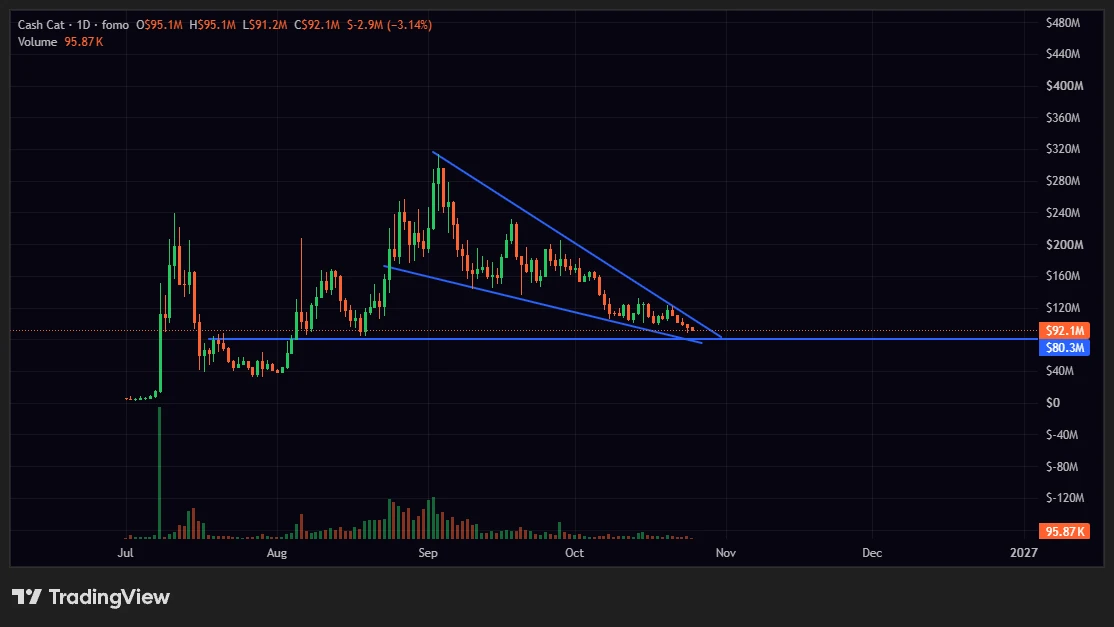
cash-cat:native 1D
post-image
$ORDER Cut in half in one day—those who chased the price at 0.10 must be looking sick now. Don’t rush to buy the dip; hear me out first.
Last night, this coin looked like a market closing-time clearance sale: it plunged straight from 0.1032 to 0.0482, with 880 million in trading volume—not an amount retail traders could move; someone flipped the table. I haven’t seen any unusual activity from the project team on-chain, but the technicals have already broken down: 0.048 is the previous-low support, and the price is now clinging to it, gasping for air. The rebound has no strength.
Bear case: Af
ORDER-49.62%
#美股财报季 #Gate广场万圣节 Tesla: Earnings beat expectations, yet the stock closed lower—is this an unjustified selloff?
This isn’t an earnings collapse; the market is repricing the “cost of the transition period.”
Break down the numbers, and it’s really a case of “good earnings, bad stock performance.”
- Revenue was $28 billion, flat YoY; net income was $787 million, down 43%—the money wasn’t lost, it was eaten up by R&D: R&D was $2.76 billion (+69%), and operating expenses rose 39% overall.
​- But gross margins are rising: automotive gross margin excluding credits was 18.1% (16.7% expected), energy
TSLA-0.62%
  • 5
This is how one should conduct oneself
Let us encourage each other
post-image
On the 4-hour timeframe, watch for TP actions around 2300-2285-2240. Reminder: don’t wait for exact levels!!!
Adjust manually based on the size of your position!
post-image
  • 1
This is one shoe ruining a photo!!!
post-image
Load More

Join 40 M users in our growing community

⚡️ Join 40 M users in the crypto craze discussion

💬 Engage with your favorite top creators

👍 See what interests you

Trending Topics

USEarningsSeason

87.72k Views3.44k Discussing

The U.S. Q3 earnings season is in full swing, with major tech companies including Tesla and Meta reporting results. Market focus is shifting beyond revenue and profit toward AI spending, capital expenditure, margins and forward guidance. Which company’s earnings are you watching most closely?

GateWCTCS9GlobalTradingCompetition

684.91k Views8k Discussing

USConsumerSentimentNearRecordLow

9.41k Views267 Discussing

View More