
Share your thoughts
placeholder
Article
Momentum is shifting toward buyers after that clean bounce.
$FIL BUY NOW 0.825
S.L 0.800
TP 1 0.855
TP 2 0.870
Full TP 0.885
Buyers are absorbing selling pressure near support; holding above keeps the upside structure intact.
Trade $FIL
post-image
FIL+4.14%
#AltcoinOISurpassesBitcoinforFirstTimeinOveraYear
ALTCOIN OI SURPASSES BITCOIN A MAJOR DERIVATIVES MARKET SHIFT
The crypto derivatives market has just delivered one of the strongest signals of changing trader positioning in more than a year: total altcoin perpetual-futures open interest has moved above Bitcoin’s for the first time since December 2024. The crossover is based on Coinalyze data and shows that a larger share of outstanding leveraged positions is now concentrated across altcoins rather than BTC.
WHY THIS UPDATE MATTERS
Open interest represents the total value of derivative contra
post-image
Jiaa_Insights
#AltcoinOISurpassesBitcoinforFirstTimeinOveraYear ALTCOIN OI SURPASSES BITCOIN A MAJOR DERIVATIVES MARKET SHIFT
The crypto derivatives market has just delivered one of the strongest signals of changing trader positioning in more than a year: total altcoin perpetual-futures open interest has moved above Bitcoin’s for the first time since December 2024. The crossover is based on Coinalyze data and shows that a larger share of outstanding leveraged positions is now concentrated across altcoins rather than BTC.
WHY THIS UPDATE MATTERS
Open interest represents the total value of derivative contracts that remain open and unsettled. When altcoin OI moves above Bitcoin OI, it does not automatically mean that every altcoin is bullish. Instead, it tells us that traders are becoming increasingly active and willing to deploy leverage outside Bitcoin.
This is a major change in market structure.
For months, Bitcoin remained the primary center of derivatives positioning. Now traders are rotating more aggressively toward the broader altcoin market, suggesting that risk appetite is expanding beyond BTC.
The timing is also important because the combined market capitalization of altcoins outside the top 10 has moved above $200 billion and has risen more than 10% since the beginning of September. That means this rotation is happening alongside an increase in spot-market capitalization rather than being purely a futures phenomenon.
ALTCOIN SEASON OR LEVERAGE TRAP?
This is where I would be careful.
The first interpretation is bullish: capital and trader attention are moving deeper into the altcoin market, creating the conditions for stronger relative performance across selected altcoins.
But the second interpretation is equally important: higher OI means higher leverage.
If too many traders become positioned in the same direction, even a relatively normal correction can trigger liquidations. Those liquidations can then force additional positions to close, creating a much larger move than the original price change.
So rising altcoin OI is both a bullish participation signal and a volatility warning.
BTC VS ALTCOINS
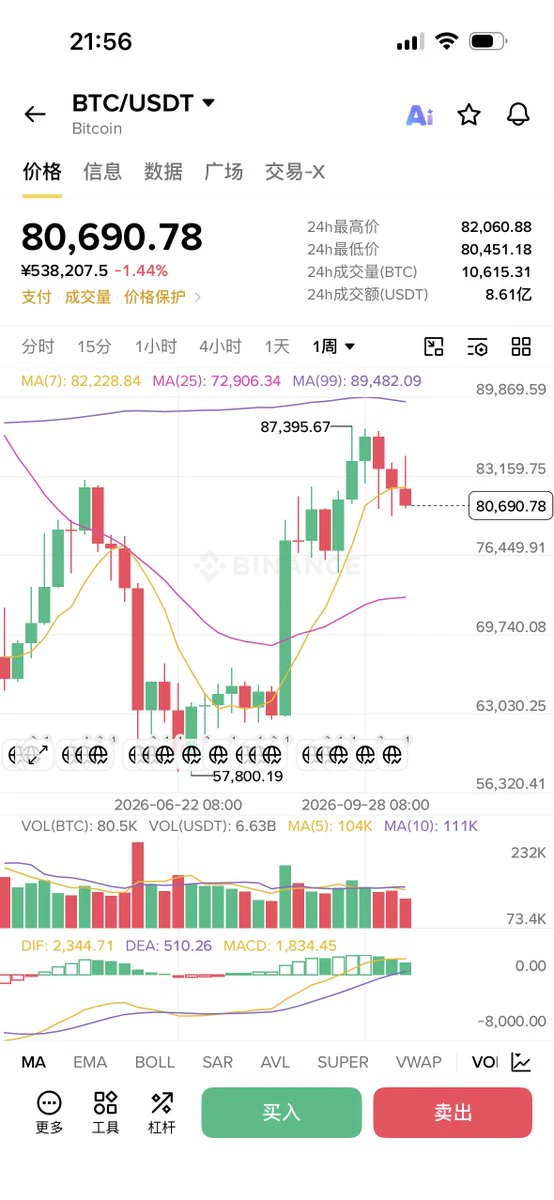
Bitcoin is still trading around the $80K region, but the derivatives structure is changing underneath the market.
This creates an interesting setup.
If BTC remains stable while altcoin OI continues expanding, traders may continue searching for higher-beta opportunities in Ethereum, Solana, Zcash, DeFi tokens and other large or mid-cap assets.
If BTC breaks higher at the same time, the combination could become even stronger because rising BTC liquidity can create a broader risk-on environment.
However, if BTC suddenly loses major support while altcoin leverage remains elevated, altcoins could experience significantly larger percentage declines than Bitcoin.
That is why the next BTC move is still extremely important for the entire altcoin market.
ZEC IS A PERFECT EXAMPLE
Zcash provides one of the clearest examples of what this rotation can look like.
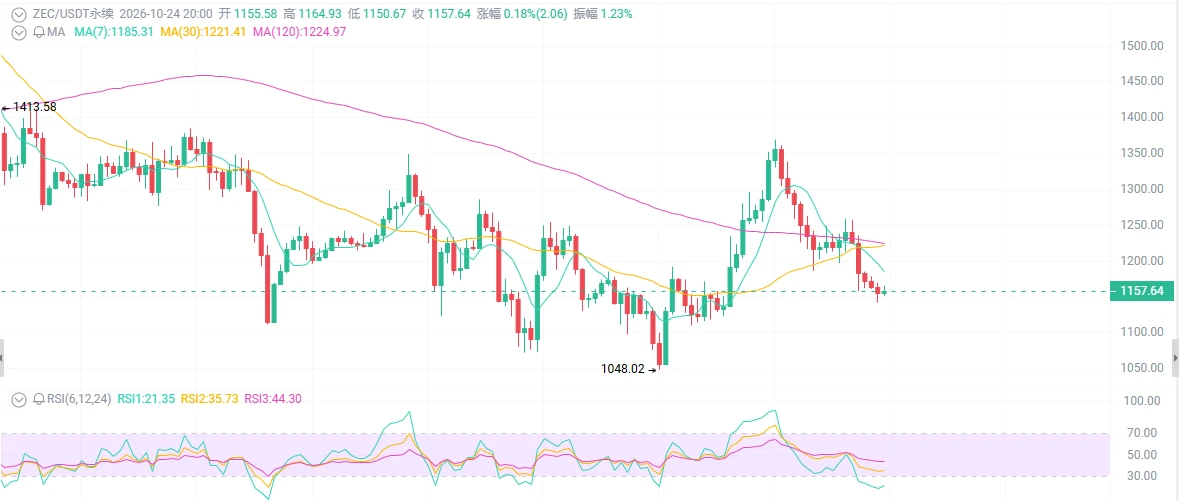
ZEC open interest reached approximately $2.4 billion, while its price pushed through $1,000 and short liquidations reached roughly $34 million.
This shows both sides of the current market.
When momentum accelerates, high OI can fuel a powerful short squeeze.
But if sentiment suddenly reverses, that same leverage can become fuel for a long-liquidation cascade.
The lesson is simple: high OI can amplify both directions.
WHAT I AM WATCHING NEXT
The most important confirmation now is whether altcoin OI continues rising while spot market capitalization also expands.
If both increase together, the move would suggest genuine market participation rather than leverage alone.
If OI rises rapidly while spot prices and market capitalization stop advancing, the setup becomes much more dangerous because derivatives exposure would be growing faster than underlying demand.
I would therefore monitor three things closely:
1. Altcoin OI
Continued expansion would show that traders are maintaining strong interest in altcoin derivatives.
2. Altcoin spot market capitalization
Continued growth above the $200B area would provide stronger confirmation that the rotation is not purely leverage-driven.
3. BTC stability
Bitcoin holding the $80K region would give altcoins more room to continue outperforming. A sharp BTC breakdown could quickly change the entire risk environment.
BULLISH SCENARIO
If Bitcoin remains stable or moves higher while altcoin market capitalization continues expanding and OI grows in a controlled manner, the current rotation could develop into a much broader altcoin rally.
In that scenario, traders may continue moving down the risk curve:
BTC → ETH → large-cap altcoins → mid-cap altcoins
The strongest projects with improving liquidity, volume and momentum would likely attract the greatest attention.
A sustained decline in Bitcoin dominance would add another confirmation signal for this rotation.
BEARISH SCENARIO
The biggest risk is excessive leverage.
If altcoin OI continues increasing rapidly while prices become overextended, the market could become vulnerable to a sharp liquidation event.
The previous December 2024 episode is worth remembering: the last time altcoin OI exceeded Bitcoin's, several mid-cap altcoins later experienced significant corrections even while Bitcoin remained comparatively stable.
That does not mean the same pattern must repeat now, but it demonstrates why this indicator should not be interpreted as a guaranteed buy signal.
MY MARKET VIEW
For me, this update is bullish for altcoin participation but cautious for leverage risk.
The fact that altcoin OI has overtaken Bitcoin after more than a year is a major structural development. It suggests traders are becoming increasingly interested in opportunities beyond BTC.
The additional confirmation is that altcoin market capitalization outside the top 10 has already moved above $200 billion and gained more than 10% since the start of September.
That makes the current environment much more interesting than a simple derivatives-driven pump.
But I would not call it a guaranteed altseason yet.
For me, the confirmation will come when:
Altcoin OI ↑
Spot market cap ↑
Trading volume ↑
BTC remains stable or bullish
BTC dominance continues weakening
If those conditions remain aligned, the probability of sustained altcoin outperformance increases.
FINAL TAKE
The most important message from today's data is not simply that altcoins have more open interest than Bitcoin.
The bigger message is that risk appetite is moving deeper into the crypto market.
Traders are no longer concentrating their derivatives exposure primarily around Bitcoin. They are increasingly willing to take leveraged positions across altcoins.
That can become the foundation for a powerful altcoin expansion.
But it can also create a much more fragile market.
More OI = more opportunity.
More OI = more leverage.
More leverage = bigger moves in both directions.
So my strategy would be to watch OI + volume + spot market capitalization + BTC structure together, rather than treating the OI crossover alone as a buy signal.
The next few sessions could reveal whether this is the beginning of a sustained altcoin rotation or simply a leverage-driven expansion that eventually produces a sharp correction.
ALTCOIN OI > BITCOIN OI
ALTCOIN MARKET CAP: ABOVE $200B
SEPTEMBER ALTCOIN MARKET CAP GROWTH: 10%+
KEY SIGNAL: CAPITAL AND LEVERAGE ARE ROTATING TOWARD ALTCOINS
KEY RISK: LIQUIDATION CASCADES
The market is clearly changing. Now the question is whether altcoins can turn this derivatives dominance into sustained spot-market strength.
BTC-0.63%
ETH-0.44%
SOL-1.20%
ZEC+1.45%
Nobody is talking about this bullish setup yet

$USELESS /USDT - LONG

Trade Plan:
Entry: 0.2262 – 0.2342
SL: 0.1917
TP1: 0.2590
TP2: 0.2783
TP3: 0.3071

Why this setup?
Why now? The 1d trend is bullish and the 1h price sits at 0.2304, right inside the entry zone of 0.2262 to 0.2342. The 15m RSI at 54.77 shows room to run before overbought, while the 1h ATR of 0.016027 confirms the move has real momentum behind it. TP1 at 0.2590 and TP2 at 0.2783 are within reach if we hold the daily bias, but the trade gets invalidated the moment we break 0.1619. That level is the line in the sand protecti
USELESS+2.87%
I just went to the restroom, and when I came back, the candlestick chart had completely erased the losses. During the repeated intraday swings, it pulled back, but the bottom never broke—clearly, someone was buying the dip. Entry price: 0.04609; current price has reached 0.05571, with a return of +415.12%. The profits all grew on their own. The market is about waiting, and profits are about holding. I’ve taken 80% off the table and moved the stop-loss on the remaining 20% to the entry price. Let it shake me out however it wants—it can’t hurt me. Managing risk beforehand is called being rationa
post-image
DOGE+0.40%
SNDK-0.75%
#PONSDropsOver15%
PONS DROPS OVER 15 PERCENT
PONS has experienced a sharp decline of more than 15 percent, putting the token back on traders' watchlists as volatility increases. A move of this size in a short period can quickly change market sentiment and create a strong battle between buyers looking for a rebound and sellers attempting to maintain downside pressure.
WHAT THE DROP MEANS
A decline of more than 15 percent does not automatically mean that the broader trend has completely changed. The important question is what happens after the initial selloff. If buyers step in and volume incre
post-image
PONS-14.59%
BTC-0.64%
Say what you want, but this is the one mint I’d actually fomo this week.
Glad I secured a GTD spot. Can’t wait to mint, this will cook.
post-image
Having a little drink—thanks to my Chengdu apprentice for mailing rabbit heads!
post-image
#HyperliquidTeamWithdraws38.14MInHYPE Hyperliquid Team Withdraws $38.14M in HYPE — Should Traders Be Concerned?
The crypto market is once again paying close attention to Hyperliquid (HYPE) after reports that the Hyperliquid team withdrew approximately $38.14 million worth of HYPE.
A transaction of this size naturally attracts market attention because large wallet movements can sometimes influence sentiment, liquidity expectations and short-term price action.
But does a large team withdrawal automatically mean that HYPE is about to fall?
Not necessarily.
Why Is the $38.14M Movement Important?
post-image
HYPE-0.98%
BTC-0.64%
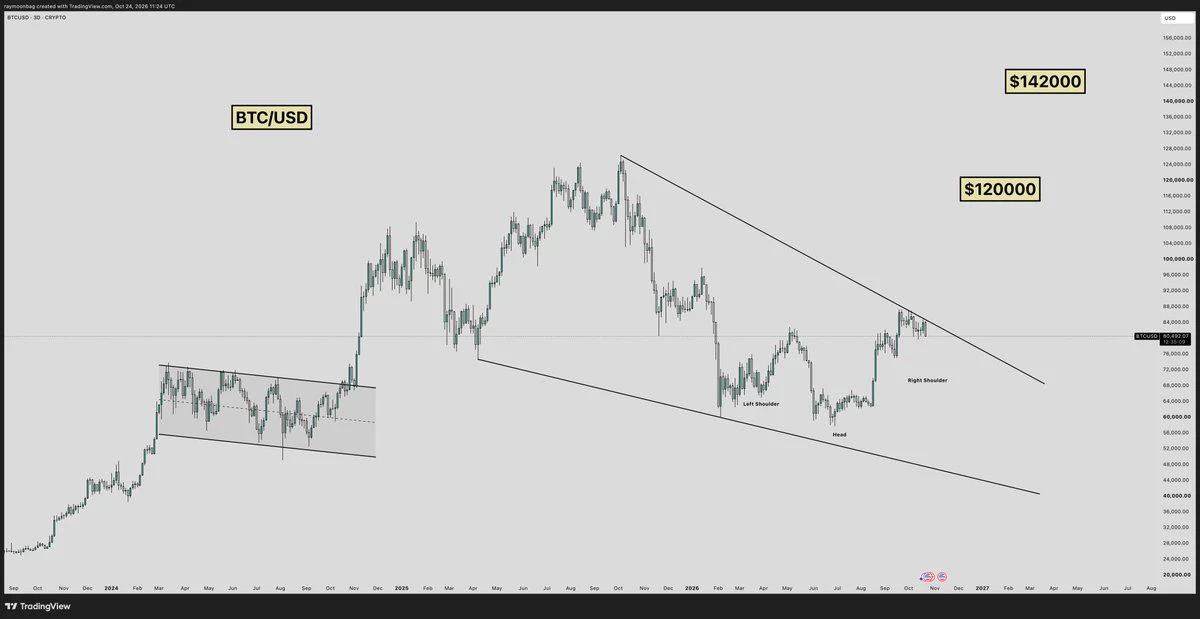
Bitcoin’s next move could come down to one level 👀
$BTC closed the week around $80,349, right on the Weekly MA 50.
That’s a major test not a confirmed breakout.
post-image
BTC-0.64%
The $KAS devs are always hard at work, and you're not bullish on it?
Covenants are going to be one of the biggest revolutions on @kaspaunchained
And they're going to be even better when DAGKnight pushes the speed and scalability even further
post-image
KAS+18.57%
Yo!!!
solana:9XqW82GbV8TSuFGLS5qZjpMmL8F2BZ2AaWyC68px37hc just broke $100k mc!
We made it!
Next stop is 1m$ 🚀
(btw, I burned all of my tokens 😭😭😭)
I've never felt so happy watching from the sidelines 🔥
post-image
SOL-1.23%
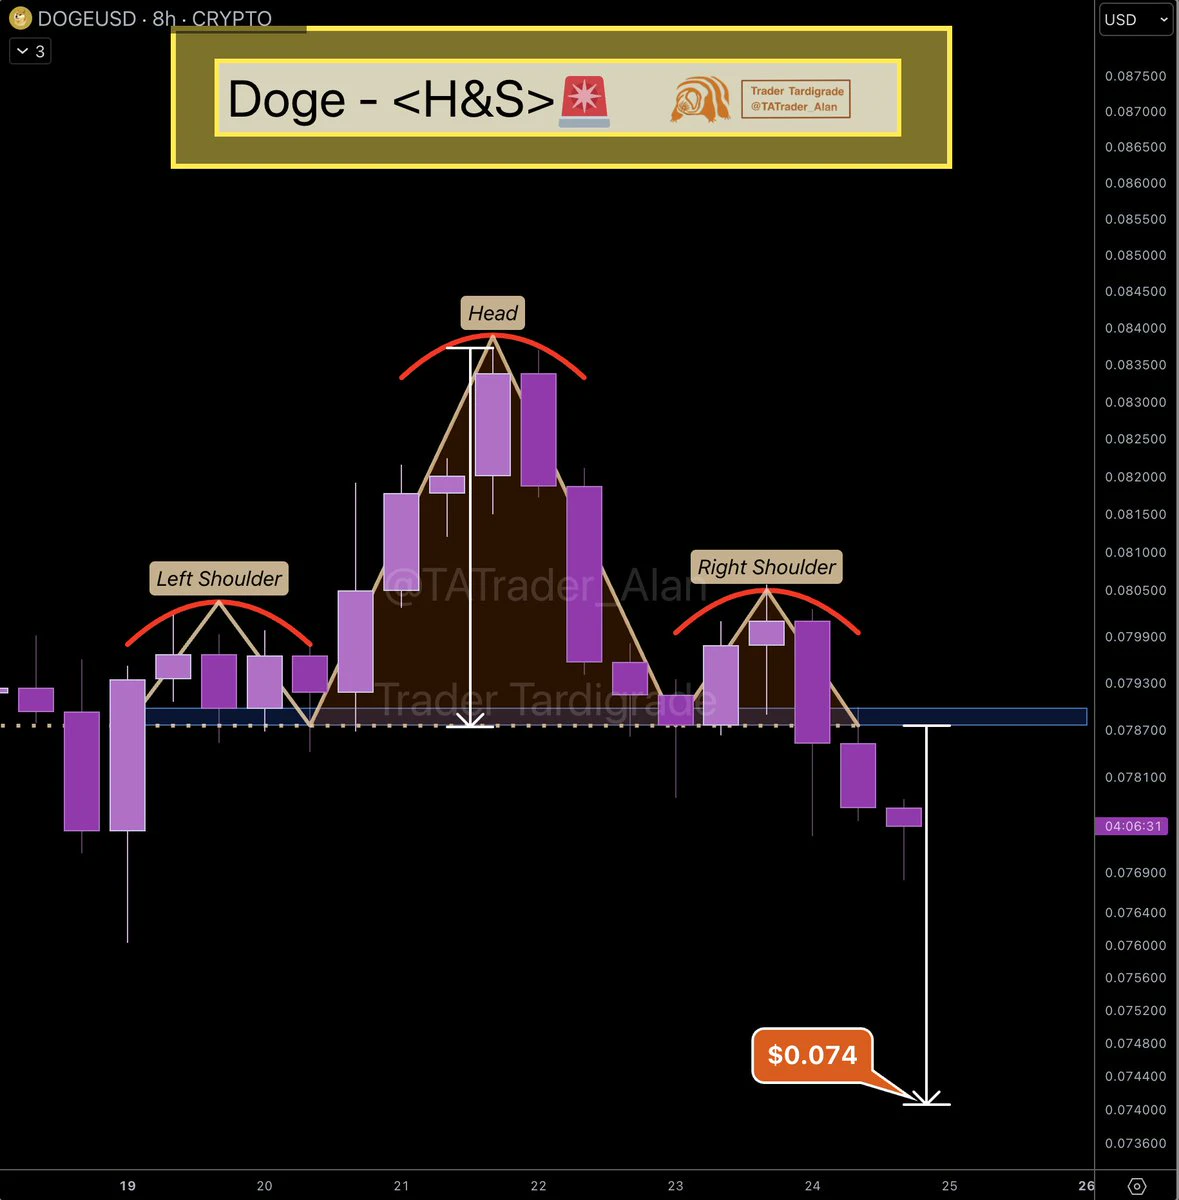
I originally wanted to cut my losses and sacrifice the position, but the sacrifice never happened—the position roasted itself. A few days ago in the afternoon, I was still watching $DOGE bottom out. Buying pressure was clearly strengthening, and the bottom structure was becoming increasingly solid. I said at the time that this was a good spot to take a chance, so I opened a long position. Entry price: 0.08349; current price: 0.08955. I took 80% off the table for safety and will let the rest ride. The sleepless nights were worth it, brothers—those who bought the dip this time should be waking
post-image
DOGE+0.40%
ZEC+1.45%
SNDK-0.75%
altcoins outpace btc for the first time
live-cover
LIVE2,298
BTC, Gold, and Crude Oil Analysis
live-cover
LIVE2,453
No moves, no analysis, just sheer luck—this performance is embarrassing even to talk about. I opened the chart this morning and saw that the $DELL long was already up +758.93% unrealized, with the current price at 525.09 and the entry price at 453.65. With the numbers right in front of me, everything looks incredibly satisfying.

Looking back at this trade: while everyone was still watching from the sidelines, the market had not fully taken off, but buyers stepped in every time it pulled back to a key level. My view was that the key level had held and the short-term direction was bullish, so
post-image
DELL+0.35%
ADA-0.14%
LAB-3.97%
🐮 At first, I thought Bull is Coming was just a bear-market meme, but now that Bull is Coming has been minini-ified, it has also turned a sentiment meme into something tangible.
The entire IP is put on Creditcoin for RWA, settled in $MINI , and simply playing ROOM and drawing stickers lets you receive the corresponding on-chain IP rights.
The approach of combining established IP with on-chain assets seems reasonably viable to me for now and is worth keeping an eye on. @mini_cto
Bull is Coming—what is meant to come will always come.
#NiuLai #minicoin
post-image
牛来-8.60%
IP+2.30%
CTC+5.12%
RWA-1.57%
A few days ago, my hand trembled slightly as I set the stop-loss; this morning, I realized that overprotective care had been unnecessary. During the repeated intraday swings, $GIGGLE /GIGGLE kept faking drops and scaring people, but it always stood firm after the pullbacks, so I went long with my eyes closed.

I checked the chart this morning and saw that the sleepless nights had paid off. My entry cost was 37.85, and it’s now 39.07, +155.33%. This move has climbed step by step from the bottom—solid and reassuring.

I’ve taken 80% off the table and moved the protection higher on the remaining
post-image
GIGGLE-1.76%
ADA-0.14%
LAB-3.97%
Opened a trend-following short position in the afternoon, with the current low at 4388, locking in over $30 in profit!
$BTC $XAU #黄金 #Gate上线打金狗限时免Gas费
BTC-0.63%
XAU-0.89%
#GateTrenchesZeroGas
MY FIRST TRENCH TRADE: $ROBIN ON ROBINHOOD CHAIN
If I opened Gate Trenches today, the first meme token I would put on my watchlist is ROBIN on Robinhood Chain. Not simply because the name matches the chain, but because the token has a narrative that can naturally spread through the same ecosystem where it trades.
Gate has officially launched Trenches as a social on-chain meme trading product, with buy and sell fees starting at 0.5%. It currently supports major networks including Robinhood Chain, Solana, Ethereum, Gate Layer, BSC, Base, SUI, Arbitrum, World Chain, Avalanch
post-image
This trend doesn’t even require me to think—the account is dancing on its own.

When the market was just getting dumped in the early session, DOT bounced with a small bullish candle, looking like it was about to stabilize, but it was clearly a bull trap. The buying support was ridiculously weak; the rebound couldn’t even hold for five minutes, and the volume-price action was a complete mess. My judgment was straightforward: this move was just a feint, with trapped holders above waiting to break even. It couldn’t hold, and it was only a matter of time before it came down.

Once I had clarifie
post-image
DOT+0.41%
ADA-0.14%
ZEC+1.45%
Load More

Join 40 M users in our growing community

⚡️ Join 40 M users in the crypto craze discussion

💬 Engage with your favorite top creators

👍 See what interests you

View More