Square
Following
Hot
News
Notifications
Profile
Share your thoughts
placeholder
Article
November 16$BTC , smart money's 24-hour buy ratio is 61.4%, indicating a buying bias; however, total futures open interest stands at $6.109 billion, down 4.40% in one day as traders unwind leverage.

The structure is more interesting: top traders' long/short ratio is 1.79, with longs at 64.1%; the all-account long/short ratio is 3.05, with longs at 75.3%. Retail traders are more optimistic than whales.

Liquidations aren't too severe: $32.42 million over 24 hours; third-party estimates put total market-wide liquidations between $1.6 billion and $2 billion, mostly from longs. The funding rate i
BTC-0.65%
  • 1
Added more to coin:native again
post-image
Trenches
mihao
m
bade
b
mihao
4Cxj...pump
Market Cap
$.
Change
.
24h Vol
$.
Holders
.
HOGE
H
bade
b
HOGE
FVzq...pump
Market Cap
$.
Change
.
24h Vol
$.
Holders
.
rockstar
r
bade
b
rockstar
9HFU...pump
Market Cap
$.
Change
.
24h Vol
$.
Holders
.
bill
b
bade
b
bill
85Rh...pump
Market Cap
$.
Change
.
24h Vol
$.
Holders
.
PIEVERSE
P
bade
b
PIEVERSE
0x0e...25a9
Market Cap
$.
Change
.
24h Vol
$.
Holders
.
Morning market update
live-cover
LIVE2,330
Growth Points Lucky Draw
Invite friends to join and win great prizes!
https://www.gate.com/activities/pointprize/?now_period=26&refUid=11796723
post-image
  • 2
$SOL
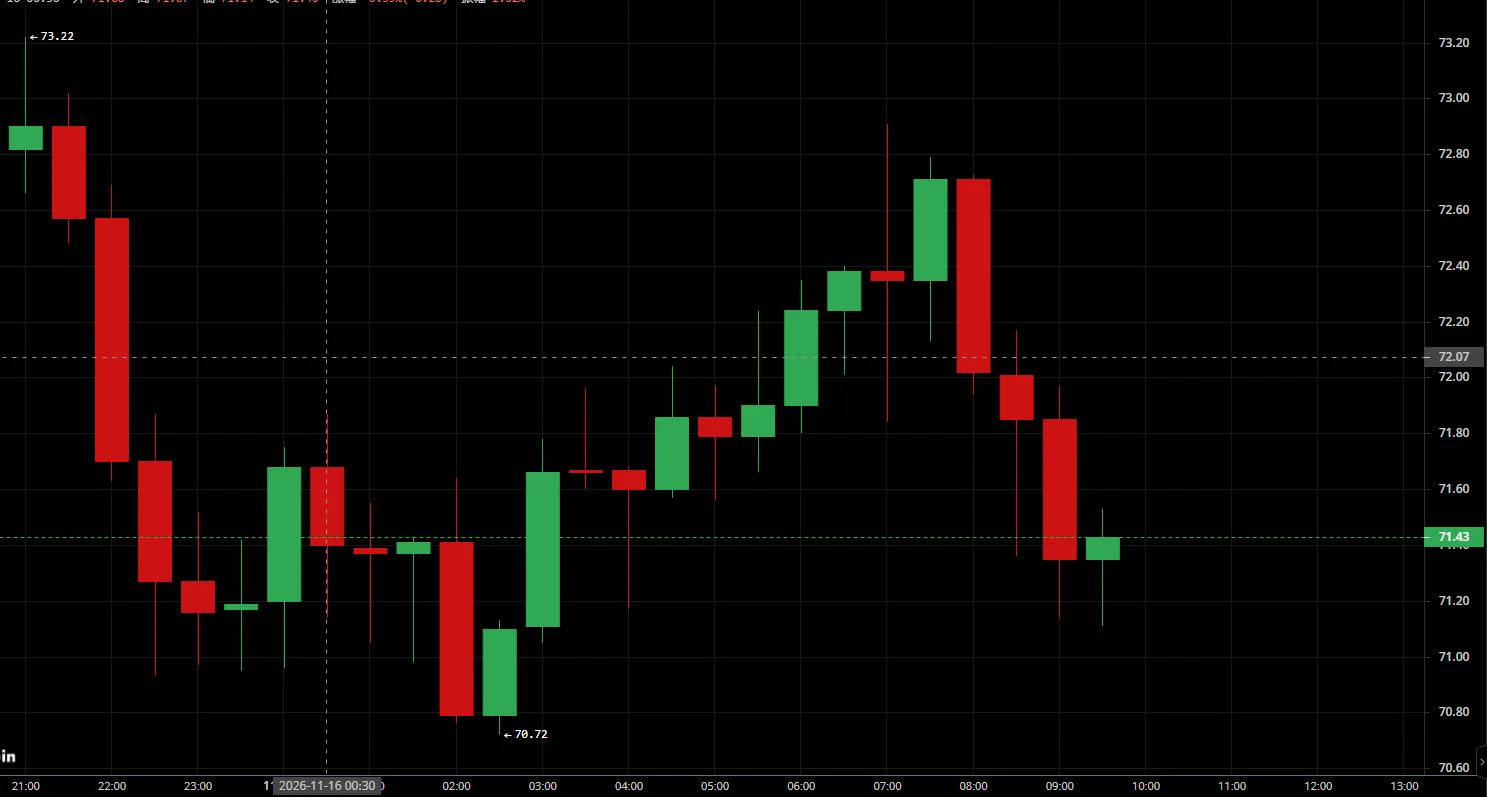
The bears remain in control, with weak choppy trading at low levels
The early-session rebound pulled back after rising, with insufficient buying support. This is a weak recovery phase following the decline, with no current signs of a trend reversal. After facing resistance on the rebound, there is still momentum for a further dip and a new low.
#ETH一度跌破2000美元
Resistance: 72.0-72.3, 73.0
Support: 70.7-70.8
Strategy: Focus on shorting rebounds; don’t chase shorts at lows or blindly try to catch the bottom
post-image
SOL-0.77%
U.S. spot XRP ETF weekly outflows hit an 8-month high: Can XRP still reverse?

Outflows from U.S. spot XRP ETFs have intensified significantly, becoming a key focus of the market recently. In the week ended November 13, the ETFs saw net outflows of about $19.13 million, their largest single-week outflow in 8 months. Meanwhile, XRP’s price briefly fell to around $0.89, reflecting declining institutional risk appetite. Persistent ETF redemptions indicate a lack of new buying pressure and may also weaken investors’ confidence in a short-term rebound.
From a price-structure perspective, $0.85 to $
XRP-1.12%
  • 27
#BitcoinDropsBelow$70K BITCOIN'S FINAL LIQUIDATION PHASE HAS BEGUN!
I told you about the $98K FAKEOUT.
I told you about the $88K FAKEOUT.
I told you about the $81K FAKEOUT.
And now look where Bitcoin is trading! 👀
Months ago, I warned that BTC could follow this exact bearish pattern, and so far, the market is moving in that direction.
Now here's what I'm watching next:
$66K → $62K → $57K → $53K → NEW BULL CYCLE 🚀
Yes, you read that right. Bitcoin could still have another painful leg down before the real recovery begins.
This is my roadmap, not a guaranteed outcome.
Save this post and come ba
BTC-0.67%
  • 1
#SNDK
SNDK at $870: Is SanDisk Preparing for a Powerful Recovery or Another Major Correction?

SanDisk (SNDK) is approaching an important technical and psychological price zone around $870. After experiencing significant volatility, investors are now watching whether the stock can stabilize, attract fresh buying pressure, and recover its previous momentum. The bigger question is whether SNDK can return toward $1,000, $1,200, or even higher levels, or whether sellers will push it toward another support zone.

At approximately $870, my view is that SanDisk deserves close attention, but traders
SNDK-5.58%
MU-2.56%
SK Hynix-4.23%
SKHY-4.39%
  • 2
$IDOL continues to make lower highs, Tp2: launching soon🙈💸$EVAA $TAC
post-image
IDOL-6.71%
EVAA-0.49%
TAC-2.72%
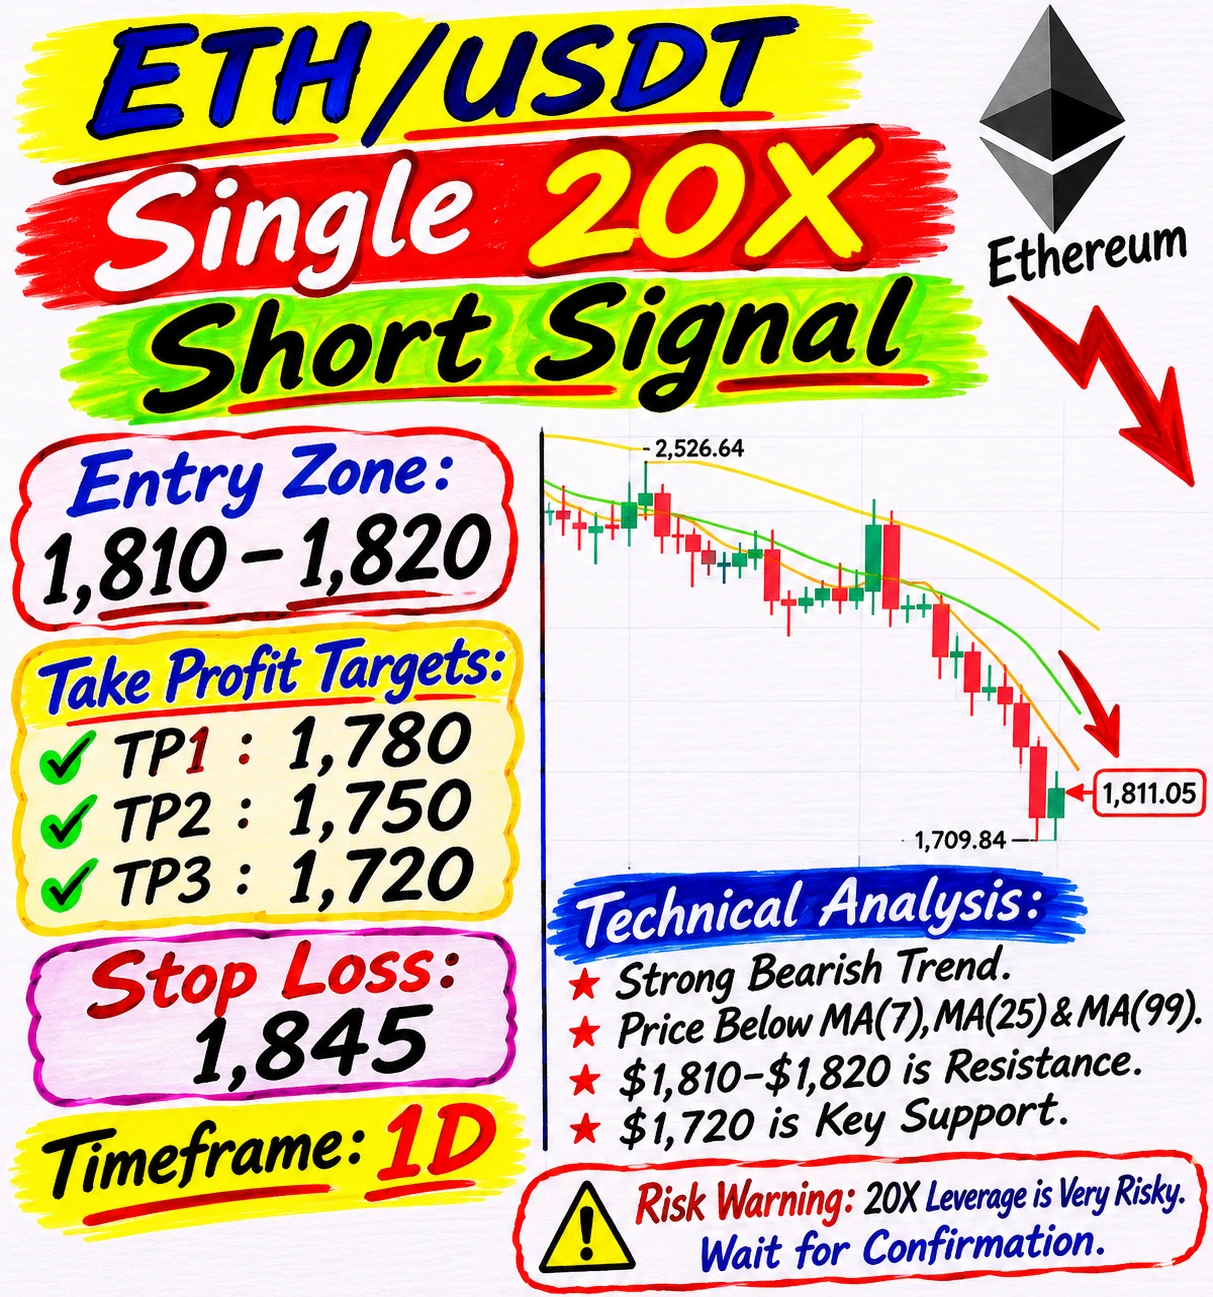
🔥 $ETH /USDT – SINGLE 20X SHORT SIGNAL 🔥
Direction: SHORT
Entry: 1,810–1,820
TP1: 1,780
TP2: 1,750
TP3: 1,720
Stop Loss: 1,845
Timeframe: 1D
#USOctoberPPIBelowExpectations
post-image
ETH-1.26%
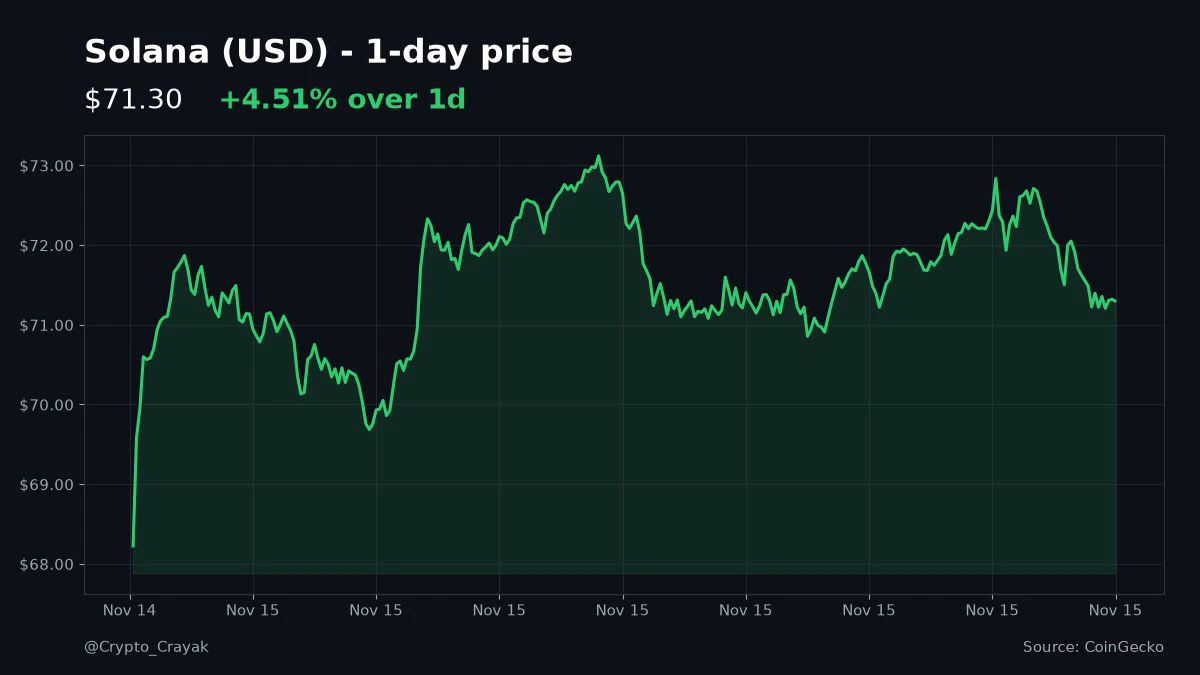
$SOL up 4.5% today, from about $68 to $71
not gonna lie I already spent the gains in my head. new car, new house, paid off the 3am meme coin losses
reality check: I'm still down bad and it's sunday night
post-image
SOL-0.77%
Crypto and crypto-related U.S. stocks are all falling. Where will the next rebound’s driving force come from?

Recently, cryptocurrencies and U.S. tech stocks have undergone a synchronized correction, with market risk appetite clearly declining. The Nasdaq is under pressure, while Bitcoin, Ethereum, and stocks related to crypto trading platforms have also been affected by capital outflows. The market had previously widely viewed Bitcoin as an asset with an independent bullish thesis, but when the dollar strengthens, rate expectations rise, and tech stock valuations come under pressure, the cry
BTC-0.65%
  • 19
The coming period may be one of the toughest stretches for the crypto market.

After staying bearish for so long, this market cycle has come to a perfect close. We’ve been watching the market all the way from 88,000 to where it is now, and everyone has seen how it played out.

But going forward, I won’t rush to keep shorting, nor will I think about buying the dip just because prices have fallen so much.

My thinking is simple: slow down and take things one step at a time. Wait when it’s time to wait, and act when the time is right. If there’s no suitable entry, I won’t trade just for the sake
post-image
BTC-0.65%
ETH-1.23%
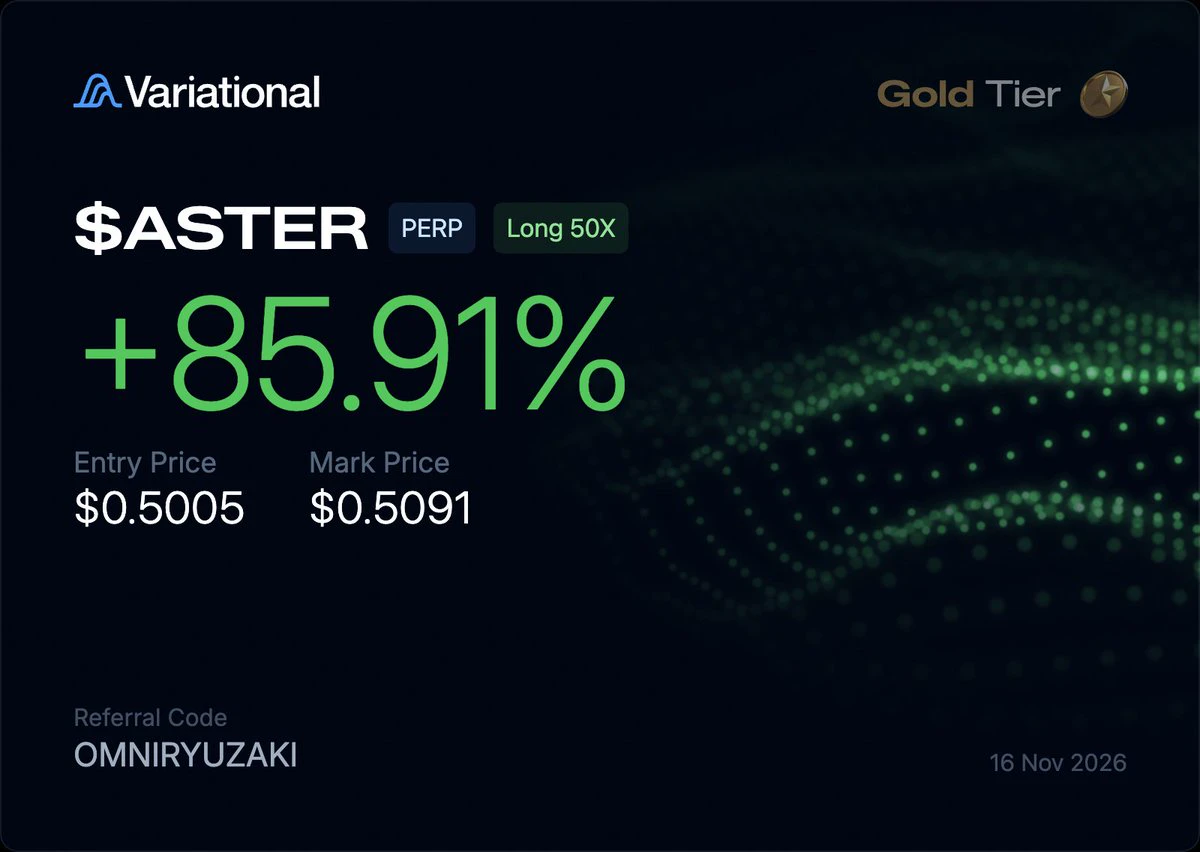
aster long in variational perp
+85% profit, quick scalp
the manuplation in aster price has to studied and everyone blaming cz for it
he has to pay 6b+ like that
first 30% dump, then 50% pump and then 40% dump
my focus is to keep collecting points each week and take profit
join :
( 18% points boost )
@variational_io tge next month, and 32% supply airdrop as well
this week everyone will get 20% more points because of the bad market, oi dropped and less activity
keep farming airdrops
post-image
ASTER-0.07%
$UNI is currently trading at 5.14, up 8.74% over 24H. The 1H chart is relatively strong, with EMA20 at 5.13, RSI at 51, and resistance at 5.223; the 4H chart is relatively weak, with EMA20 at 5.42, RSI at 25, support at 4.62, and resistance at 6.27. A sustained move above 5.223 is needed for the uptrend to extend toward 6.27; a break below 4.74 would weaken the short-term outlook. In the follow-up review, check whether 5.223 holds and whether 4.74 is lost and reclaimed. The two timeframes diverge, so short-term moves should not be viewed as a trend reversal. Be wary of declining volume. Market
post-image
UNI+3.05%
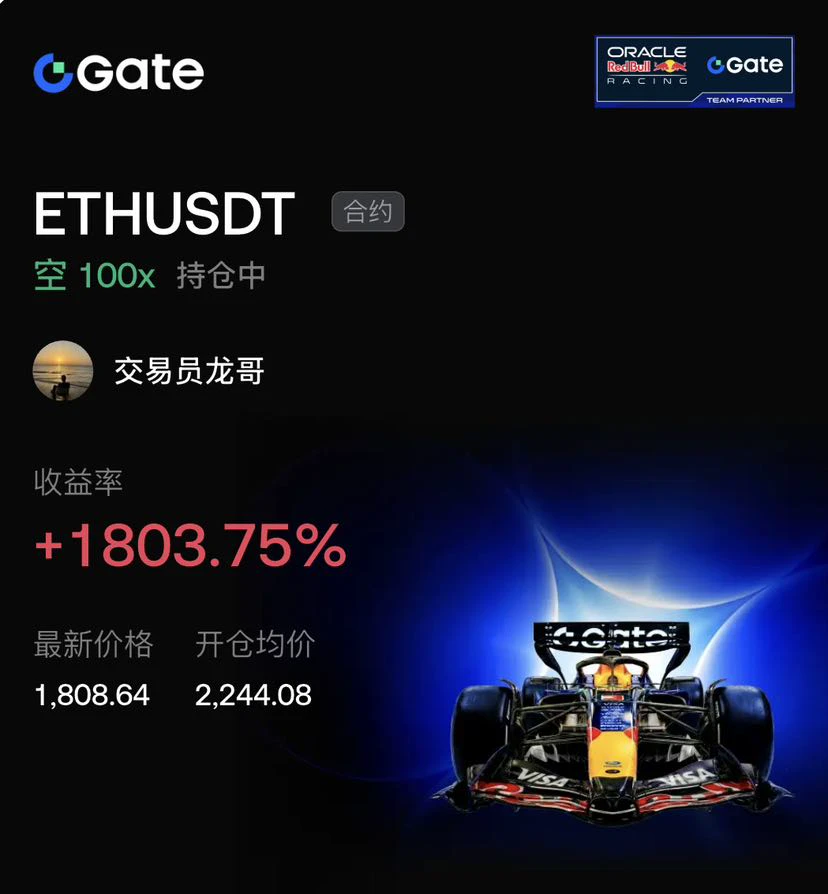
Folks$ETH , the current price is 1808.64, down all the way from 2244.08. The 100x short position has returned a whopping +1803.75%! This move looks like a free fall, with not even a decent bounce—longs are all getting liquidated.

But understand this: the sharper the drop, the stronger the rebound. Sentiment is now at rock bottom, and that’s often the final stretch before a turning point. EMAs are in a standard bearish alignment, MACD momentum is fading, and the lower Bollinger Band is flattening—all clear signs of oversold conditions.

Here’s the logic: Why short? There’s too much overhead su
post-image
ETH-1.23%
GT-2.24%
SOL-0.74%
$BTC $ETH
GM, everyone
Like early and you'll always profit trading crypto
Like every day and earn millions a day
post-image
BTC-0.67%
ETH-1.26%
GMWAGMI+0.00%
n[New Streamer[ Market Predictiob
live-cover
LIVE1,868
#USOctoberPPIBelowExpectations

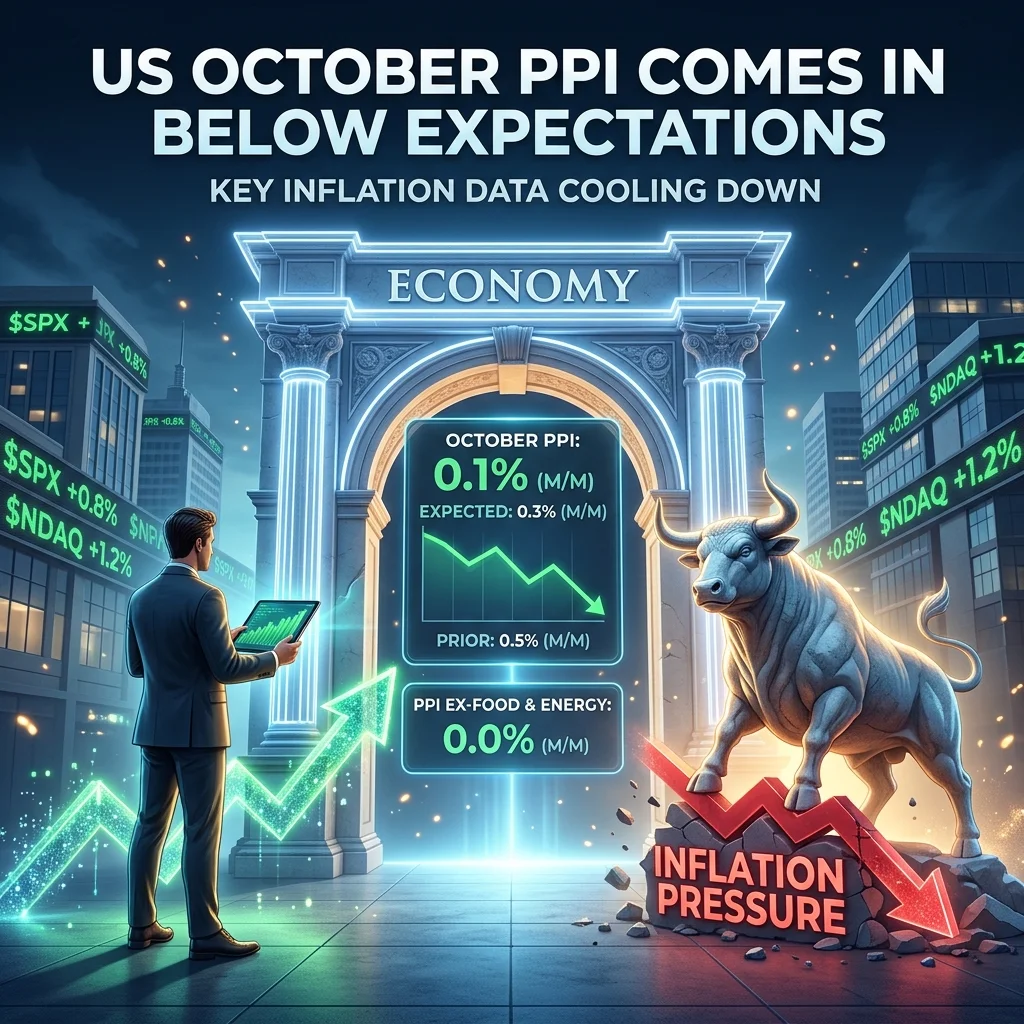
What Does Lower-Than-Expected US Producer Inflation Really Mean for Markets?

📊 What happened in October?

The United States released its October 2026 Producer Price Index (PPI) report on November 13, and the headline number came in slightly below economists' expectations.

Producer prices increased by 0.3% month over month, compared with the 0.4% forecast. This was a smaller increase than expected, offering a little relief to investors concerned about inflation.

However, there is an important detail: September's increase was revised to 1.4%, making the Octob
post-image
BTC-0.67%
Yesterday, over $8,000 in unrealized gains was wiped out, all on this $MAGMA position.
It fell 18% in 24 hours, while trading volume actually rose to 24.8M. The price slid from 0.32 to around 0.25, but volume didn’t shrink—that’s unusual. In a normal pullback, the lower it goes, the fewer people sell. Here, the lower it goes, the more buyers step in.
There are two possibilities. One is that holders who bought higher are taking profits on the rebound, with short-term dip buyers stepping in, naturally pushing volume up. The other is that big money is rotating positions, using the drop to move to
MAGMA-0.57%
  • 2
Load More

Join 40 M users in our growing community

⚡️ Join 40 M users in the crypto craze discussion

💬 Engage with your favorite top creators

👍 See what interests you

Trending Topics

GateIPOAccessAnthropic

379.7K Views2.8K Discussing

Gate IPO Access Phase 3 features Anthropic (ANT), with USDT subscription interest starting from 100 USDT. Successful allocations will be delivered as real shares to Gate Stock Accounts. Indicative price: $70–$78/share Subscription: Nov 12–17 (UTC+8) Allocation is not guaranteed. Please manage risk accordingly.

Dr.HanOxfordUnionSpeech

154.1K Views519 Discussing

BTCBreaksKeySupportAsFearDeepens

5.4M Views36.4K Discussing

View More