

Square
Following
Hot
News
Profile
Share your thoughts
placeholder
Article
$APP Up 27% in a day to 317, with 24-hour trading volume at just 62.7M—I've been watching this price-volume divergence for three years, and every time it appears, it signals overheated sentiment. I put the current Fear & Greed Index at 78 (greed zone), with a +0.09% funding rate (longs are paying). Historical comparison: the last time $APP's funding rate broke 0.08% was two months ago, followed by a 22% pullback over the next 48 hours. Price surged straight up from a low of 247.72, then pulled back without holding the high of 343.36—a textbook FOMO-chasing structure.
My trading framework is si
APP+0.12%
  • 6
  • 2
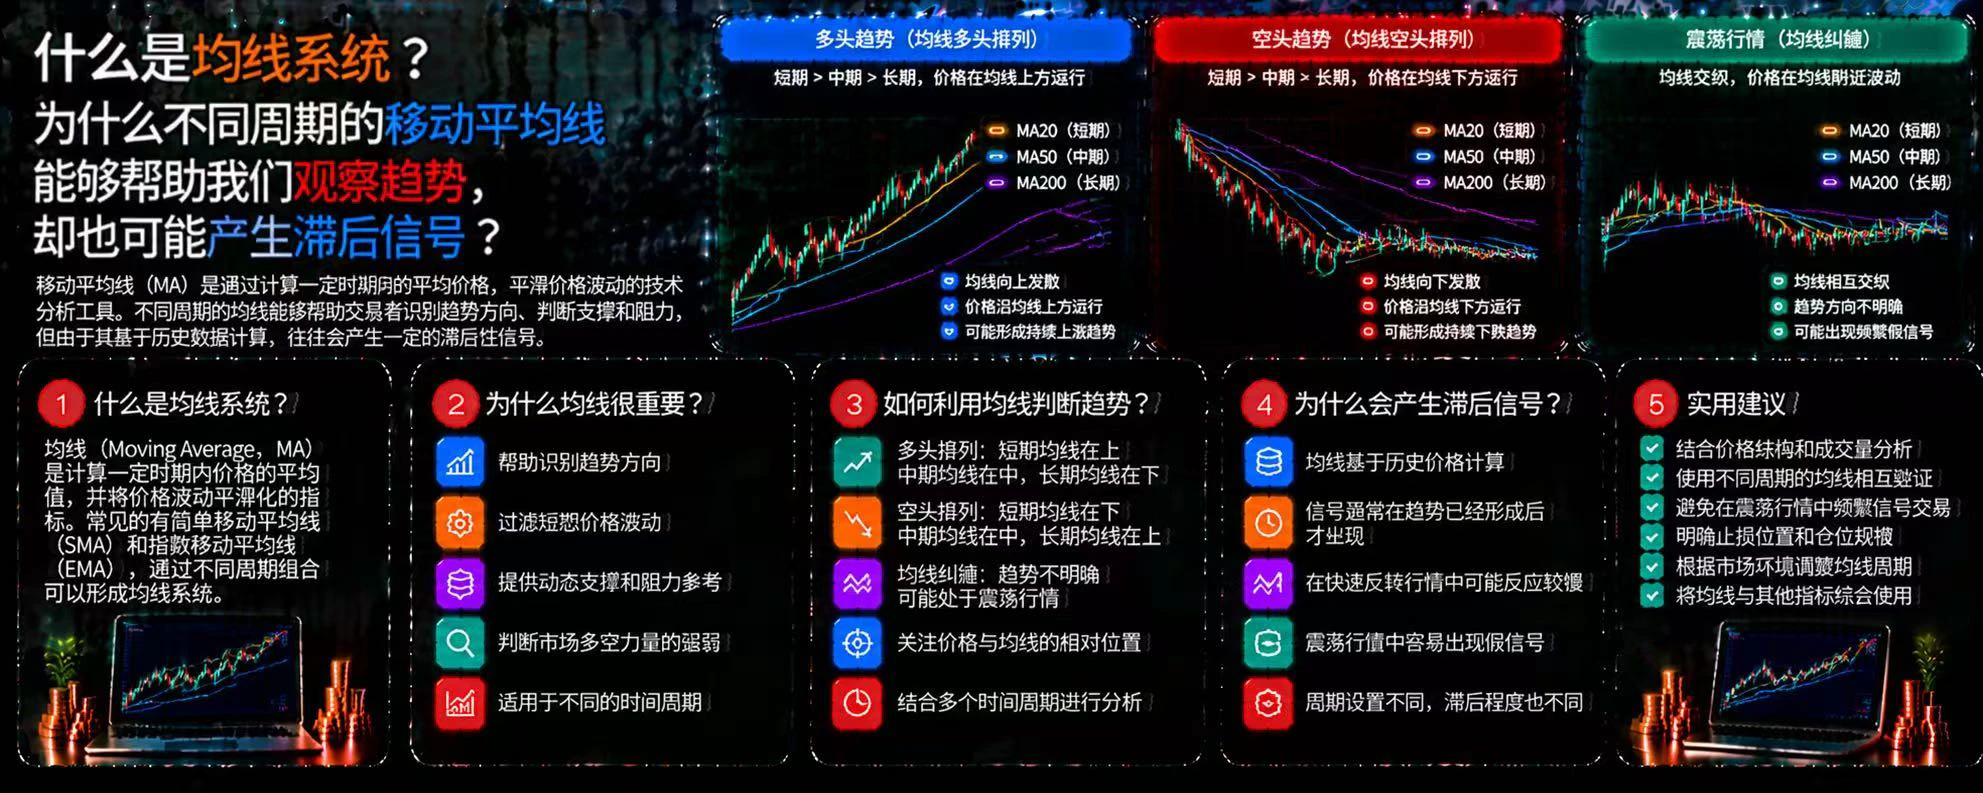
What Is a Moving Average System? Why Can Moving Averages of Different Periods Help Us Observe Trends Yet Also Produce Lagging Signals?
In cryptocurrency trading, prices fluctuate every day, and short-term rises and falls can easily cloud judgment. Moving averages calculate the average price over a given period, helping traders observe market direction. However, because moving averages are based on historical prices, they are better suited to helping identify trends than to accurately predicting the future.
First, what is a moving average system?
A moving average (MA) is a curve formed by avera
post-image
Trenches
ZIG
Z
bade
b
ZIG
0x8c...1145
Market Cap
$.
Change
.
24h Vol
$.
Holders
.
BTC
B
bade
b
BTC
C5xp...pump
Market Cap
$.
Change
.
24h Vol
$.
Holders
.
HIGH
H
bade
b
HIGH
7ymF...high
Market Cap
$.
Change
.
24h Vol
$.
Holders
.
STONK
S
bade
b
STONK
6GmA...UNgx
Market Cap
$.
Change
.
24h Vol
$.
Holders
.
CORLA
C
bade
b
CORLA
0xba...7777
Market Cap
$.
Change
.
24h Vol
$.
Holders
.
Day 4 of fully automated quant trading. Check my bio to copy trade.
Special thanks to my first copy-trading user, but with only $10, you can't sync my positions. If you see this message, please adjust promptly. #BTC重返8万
BTC-0.67%
#EIGEN
Current outlook.
Friends, on $EIGEN 30 October it dipped to its main support at 0.1592 and bounced from there, holding in the 0.18–0.19 range. The June low at 0.1523 and August low at 0.1637 were also in the same area; after both, the price first reached 0.2097, then 0.2858.
It is currently trading around 0.187. The first test above is 0.2097, the level tested most often since May. Just above it is the 20-day average at 0.202 and the 0.2155–0.2175 zone where the 50-, 100-day averages converge. Once this zone is cleared with a daily close, the levels I marked on the chart—0.2288, 0.243,
EIGEN-0.85%
#BrentCrudeFallsBelow100
The recent drop of Brent crude below the $100 mark is a significant development that reshapes the broader macro landscape. This move puts global demand and supply expectations back in focus, but it also intersects with another major market catalyst: the outcome of the US midterm elections, where Democrats secured a majority.
This political result is being interpreted by the markets as a stabilizing factor that reduces geopolitical risk premiums. With lower perceived geopolitical friction on the horizon, the market is pricing in fewer supply-side disruptions, which fur
BTC-0.67%
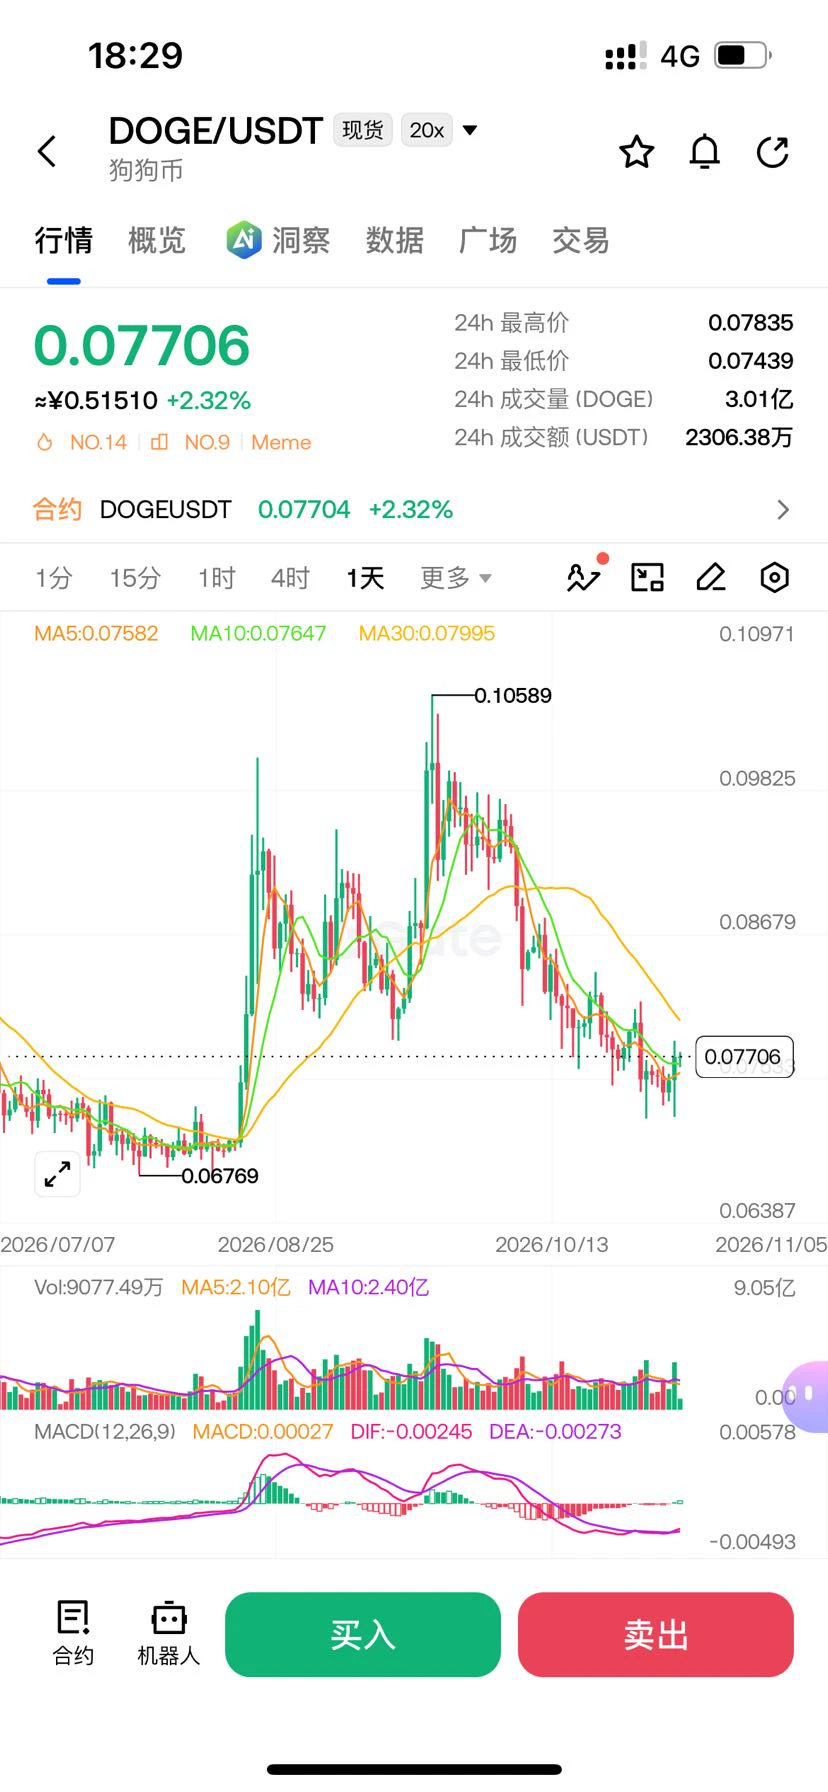
$DOGE I dug through the unusual activity list: $36 million in trading volume, up 2.5%. That’s not unusual activity—that’s a yawn.
I scrolled through the list expecting a story, but there was nothing. A meme is a meme; nobody’s come up with a new narrative for it. It’s just money shifting around inside.
The bulls’ case: it’s been falling for nearly half a year, down 35% from its high, and now that it can’t fall much further, it’s worth a punt. The bears’ case: it’s still down 18% over 30 days. A slow bleed is the most painful, volume hasn’t picked up at all, and this 2.5% move is just bait to l
post-image
DOGE-0.22%
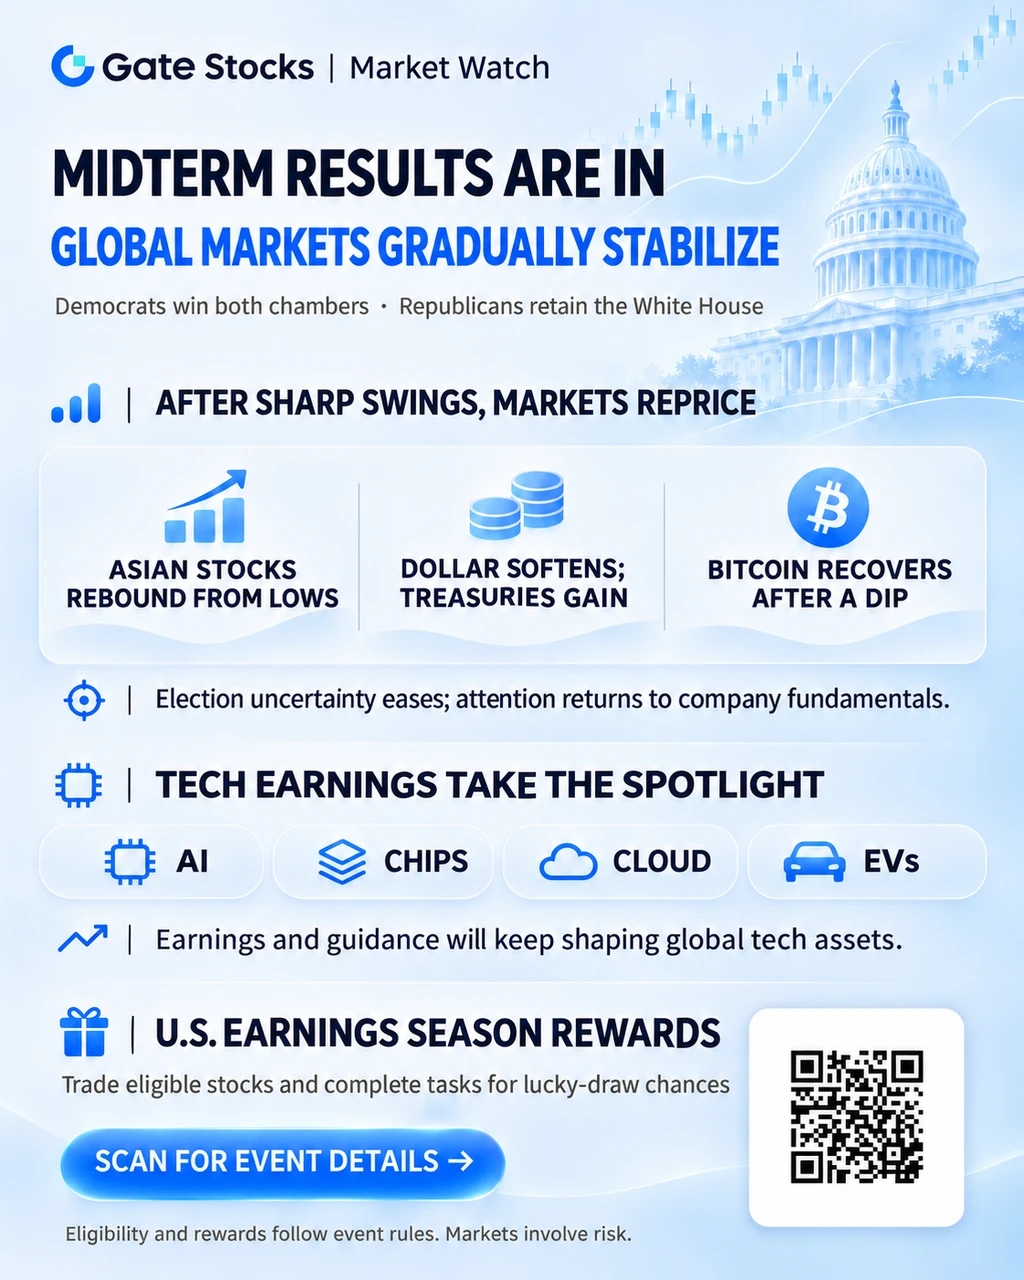
🇺🇸 US Midterms Are Over — What Will Drive the Next Market Move?
Democrats have won both chambers of Congress, while Republicans retain the White House.
As election uncertainty eases, US stocks have rebounded, the dollar has weakened, and BTC has recovered from its initial dip. 📈
Now the focus shifts from politics to earnings and fundamentals.
🤖 AI, chips, cloud computing, or EVs — which sector could lead the next rally?
💬 Would you buy into the rebound or wait for earnings and guidance to confirm the trend?
Share your stock picks, trading plans, or market views on Gate Square with #USMidt
Gate_Square
🇺🇸 US Midterms Are Over — What Will Drive the Next Market Move?
Democrats have won both chambers of Congress, while Republicans retain the White House.
As election uncertainty eases, US stocks have rebounded, the dollar has weakened, and BTC has recovered from its initial dip. 📈
Now the focus shifts from politics to earnings and fundamentals.
🤖 AI, chips, cloud computing, or EVs — which sector could lead the next rally?
💬 Would you buy into the rebound or wait for earnings and guidance to confirm the trend?
Share your stock picks, trading plans, or market views on Gate Square with #USMidterms2026 #USEarningsSeason.
🎁 Gate's Earnings Season Rewards event is ongoing. Trade eligible stocks and complete tasks for a chance to win rewards.
👉 Join the event:
https://www.gate.com/campaigns/6714
Election results are in. What's your next market play?
repost-content-media
BTC-0.67%
SOL-0.77%
Want to know what the whale is doing?
Here's one; the rest are only available to subscribers. 👌🏻
$PEPE
post-image
PEPE+0.97%
What Is Slippage? Why Isn't the Price You See When Placing an Order Necessarily the Final Execution Price?
In crypto trading, many people see one price when placing an order, only to find that the actual price is different after it is filled. This phenomenon is commonly known as slippage. It may seem like only a slight price difference, but in highly volatile markets, large trades, or leveraged trading, it can significantly affect trading costs and the final outcome.
First, what is slippage?
Slippage is the difference between the expected execution price and the actual execution price. When bu
post-image
How Can an Ordinary Trader Build Their Own Trading Review System?
Many traders remember the few trades that made them a lot of money.
They remember which token doubled, which time they bought at exactly the right moment, and which trade would have earned them more if they had held on a little longer.
But ask them:
Why did you lose money last month? Which mistakes keep recurring? Is your trading method actually effective?
Many people may not be able to give a clear answer.
The problem isn't necessarily a lack of market knowledge. Sometimes, what's really missing is a way to keep consistent reco
post-image
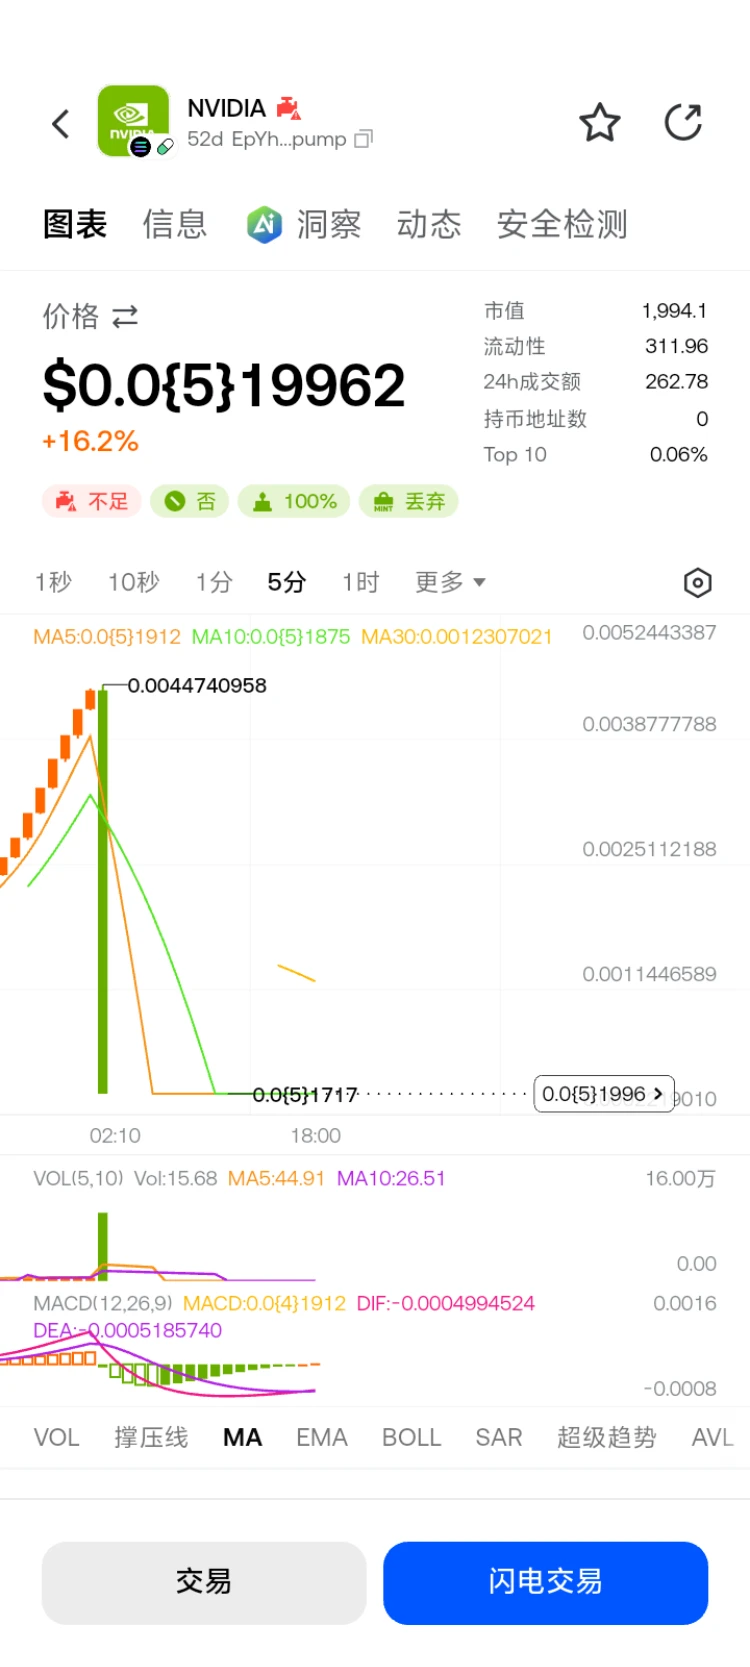
Can this coin still come back to life? It's up 16%😂
post-image
  • 1
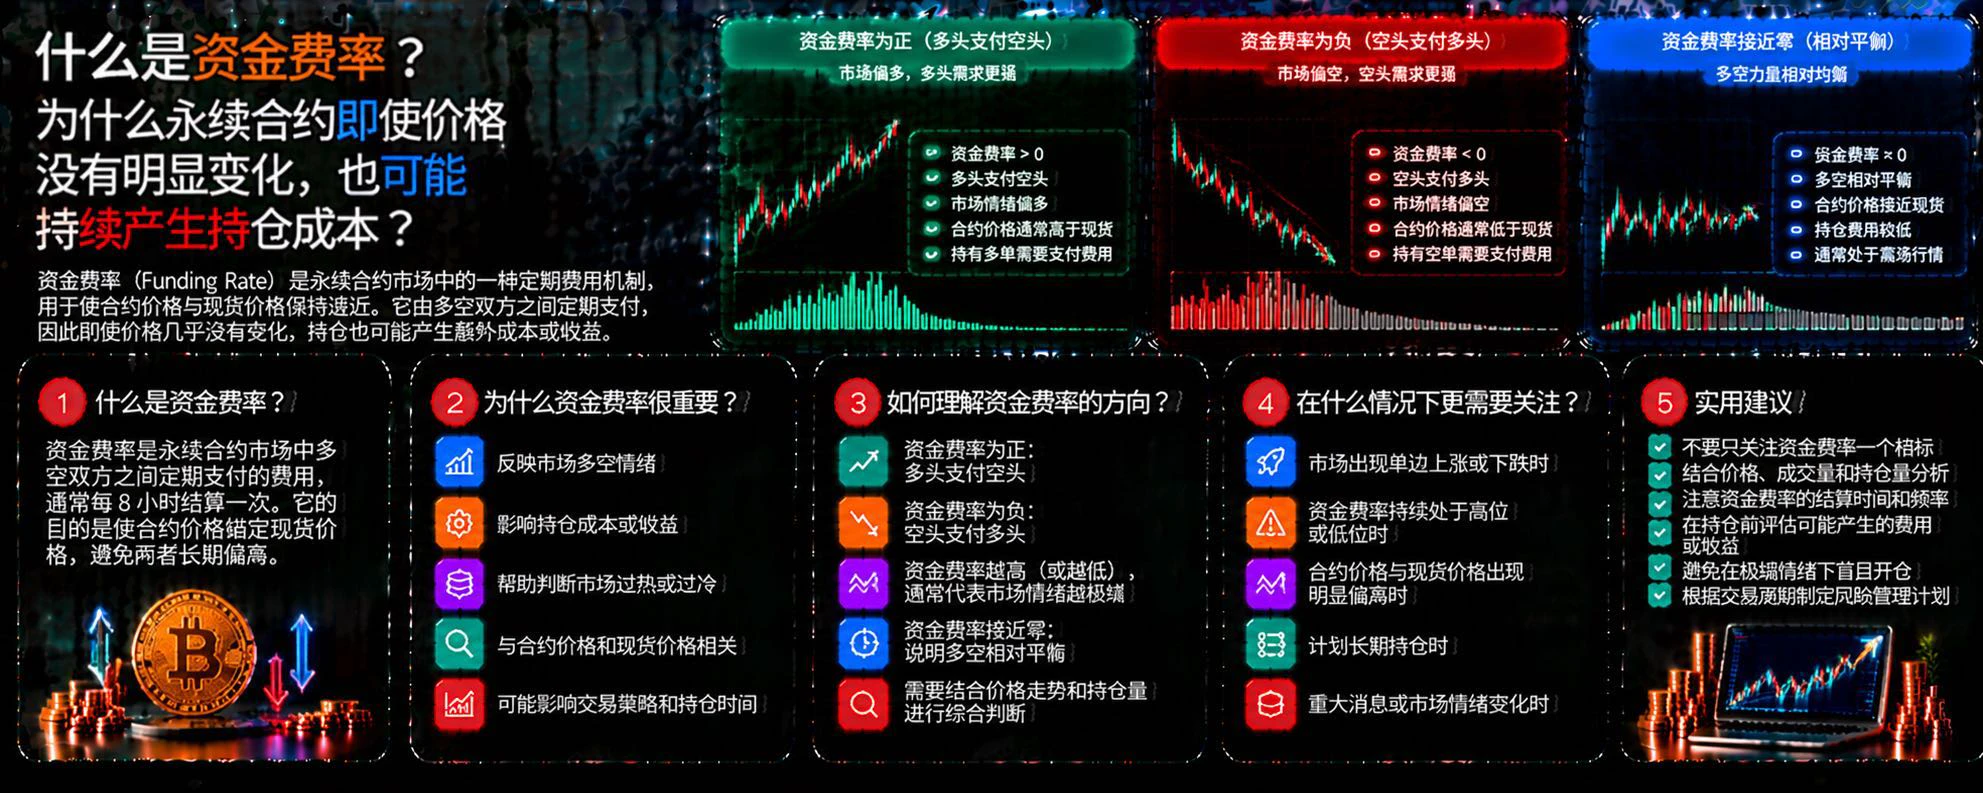
What Is the Funding Rate? Why Can Perpetual Contracts Continue to Generate Holding Costs Even When Prices Show No Significant Movement?
In cryptocurrency trading, many people focus only on price movements after opening a position and overlook the funding rate. For perpetual contract traders, even if prices move sideways for a long time, holding a position may still generate additional costs or returns as long as the funding rate is nonzero.
First, what is the funding rate?
The funding rate is a mechanism in perpetual contracts for periodic payments between longs and shorts, intended to help ke
post-image
buy good coins, do nothing, hold spot, touch grass, make money season (loading)
Layout: Bitcoin, Ethereum, Dogecoin
live-cover
LIVE1,639
  • 1
[New Streamer] Market Prediction
live-cover
LIVE1,829
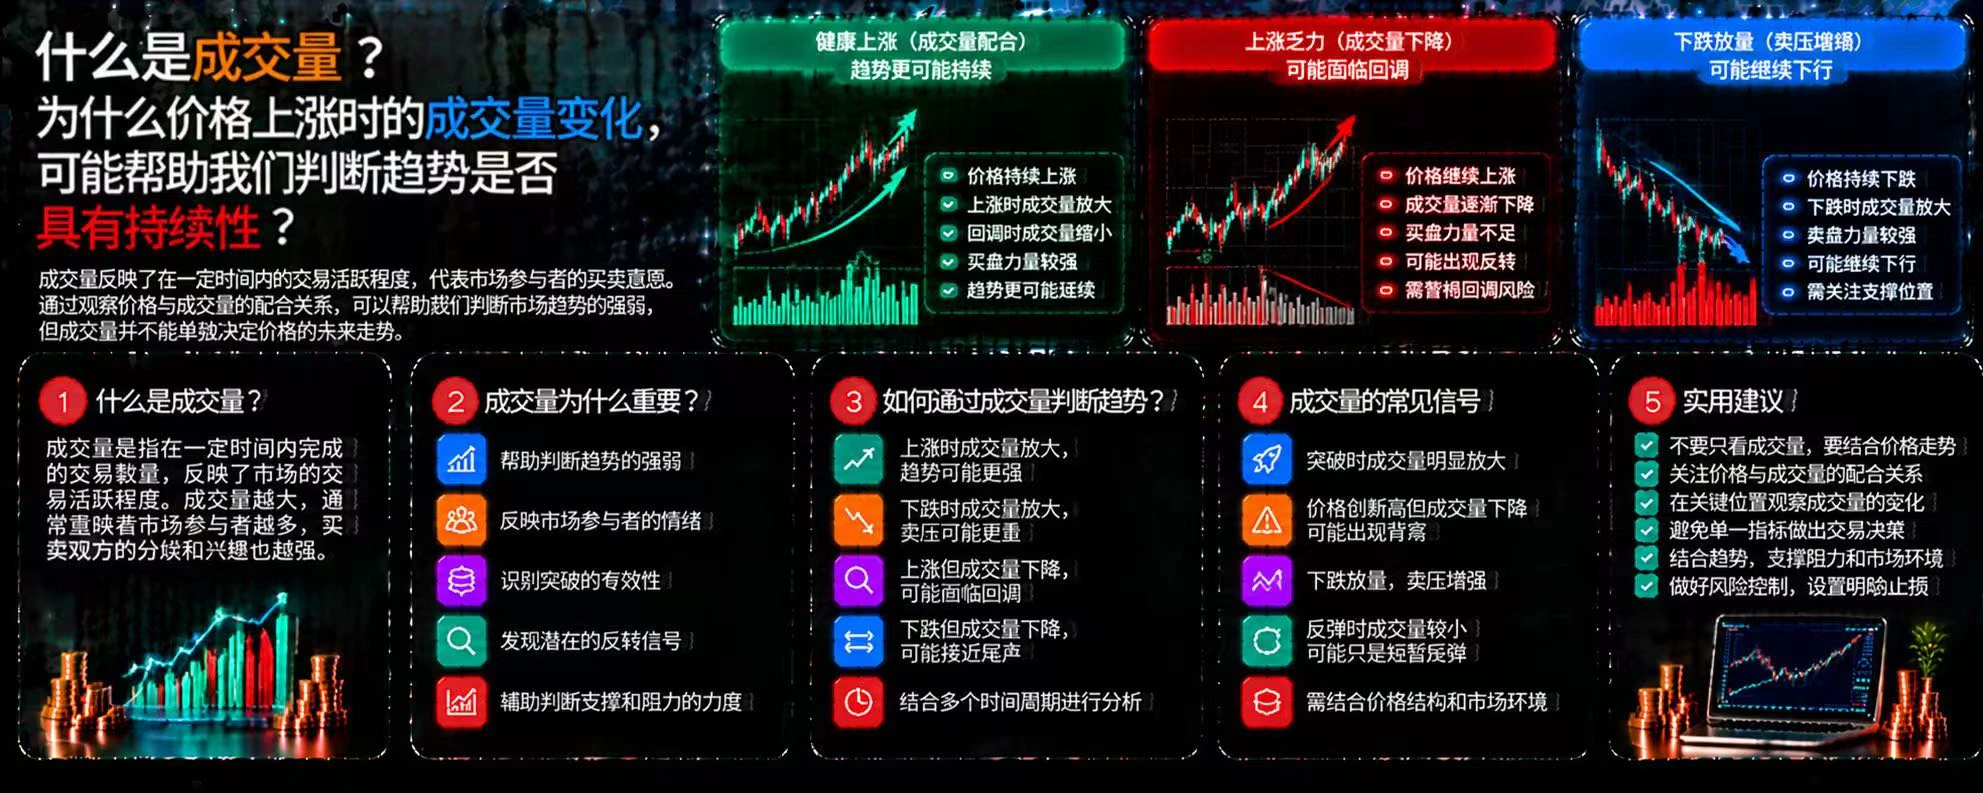
What is trading volume? Why can changes in volume during a price rise help us assess whether a trend is sustainable?
In cryptocurrency trading, price tells us which direction the market is moving, while volume helps us understand the level of trading activity behind that move. Analyzing the two together is more informative than looking at price alone, but volume cannot directly predict future movements.
First, what is trading volume?
Trading volume refers to the quantity of assets or the value of transactions actually traded during a specific period. An increase in volume usually indicates hei
post-image
【11.4 BTC Strategy Review】
Yesterday's early-session outlook called for a pullback and adjustment, with a clear plan to go long near 76500 after support held, targeting 77500, 78200, and 79000 in sequence.
The intraday low reached around 75690, briefly dipping below the defense level before quickly recovering. After support was confirmed, a one-way rally began, reaching a high of 81188. All three preset targets were surpassed, fully capturing a rebound of nearly 5500 points.
From identifying support at the lower Bollinger Band to anticipating a breakout above the previous high resistance, the
BTC-0.65%
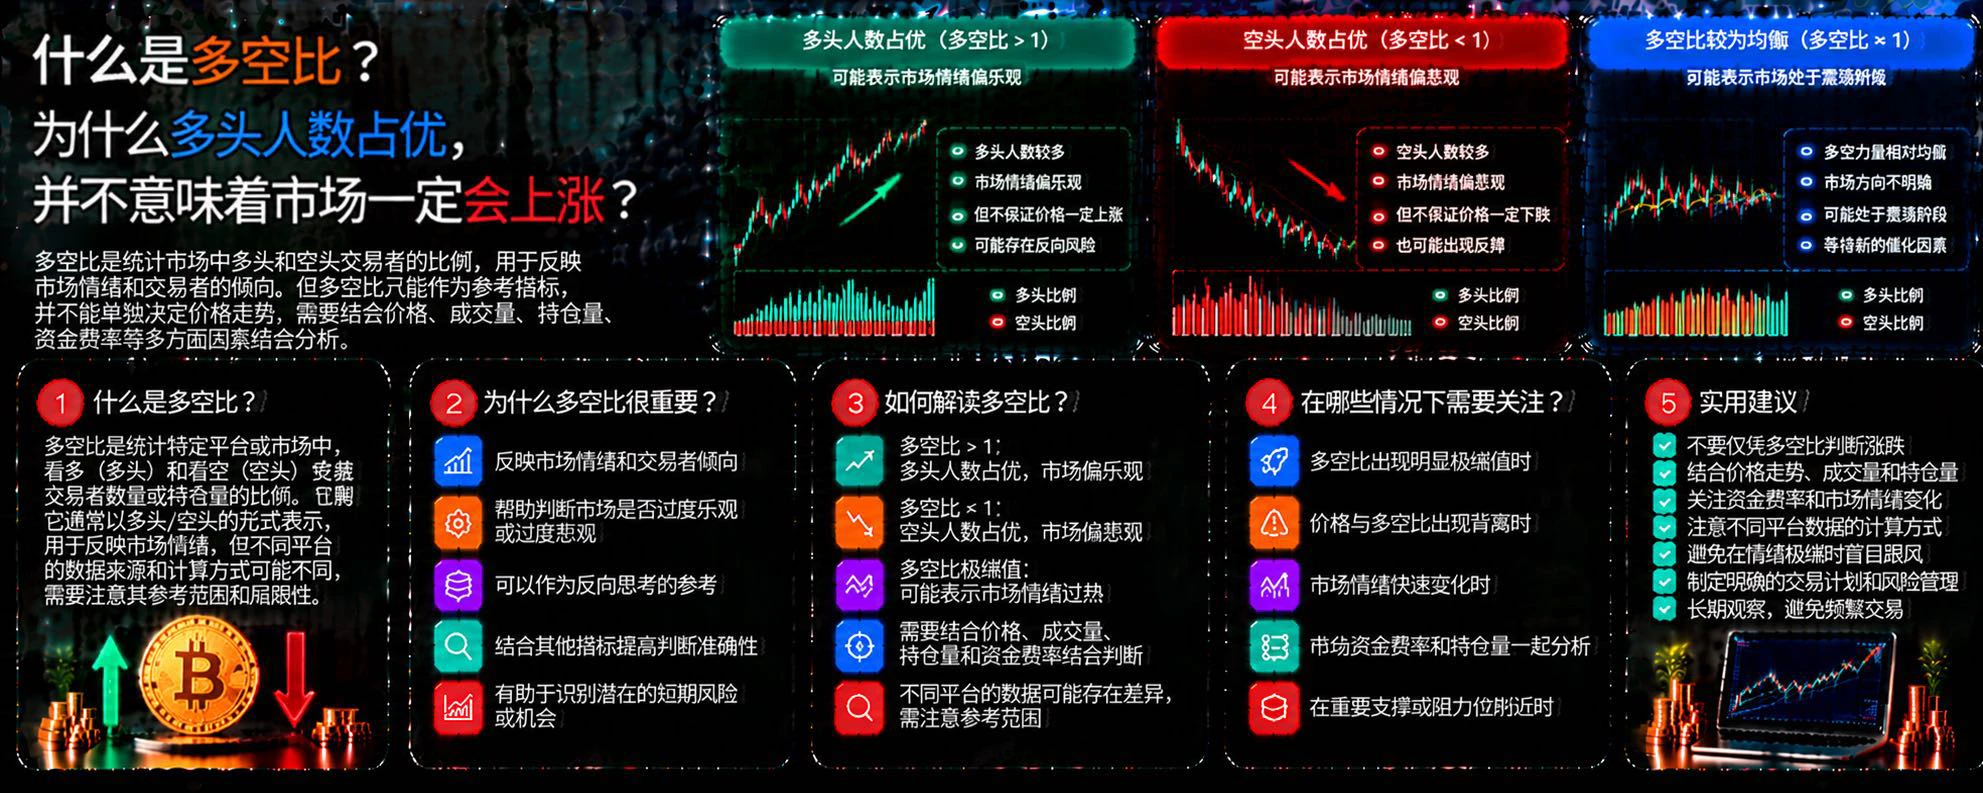
11.5 BTC Long-Short Ratio Analysis: Retail Traders Holding Longs, Whales Opening Longs — Aligned Structure
A. Retail ratio currently stands at 0.5031, with the curve moving sideways; retail traders are holding long positions.
B. Whale long-short ratio: 0.87. The curve is rising steeply, bulls are gaining strength, and whales are following up by opening long positions.
Summary: “Aligned structure.” Both retail traders and whales are bullish. Retail traders are holding long positions and watching, tending toward caution; whales are following up at high levels and adding long positions, supportin
BTC-0.65%
An ESA probe detected hydrogen chloride gas escaping from fissures in the Alba Mons region of Mars. Earlier orbital images suggested that some volcanoes may have remained active within the past few million years, and seismometers have also detected marsquakes, but no clear evidence of volcanic eruptions or lava flows has been found.
“Dormant” is more cautious than “dead,” but the chain of evidence is still missing its final link; without direct evidence of an eruption, the conclusion can only be that it is “possible.”
$BTC
post-image
BTC-0.67%
Load More

Join 40 M users in our growing community

⚡️ Join 40 M users in the crypto craze discussion

💬 Engage with your favorite top creators

👍 See what interests you

Trending Topics

GateLaunchesPoSECProofOfSecurity

930 Views462 Discussing

Beyond Proof of Reserves, Gate has introduced PoSEC, a new Proof of Security framework focused on how user assets are stored and protected. By disclosing the distribution of assets across cold storage and hot wallets, users can directly understand Gate’s storage structure and risk coverage under extreme scenarios. Gate’s latest cold storage coverage ratio stands at 104.58%, meaning cold-storage assets alone are sufficient to cover all user assets. PoR verifies whether reserves are sufficient, while PoSEC shows how assets are stored and how risks are covered — together forming a more complete asset security framework. Share your results and experience! [👉 Learn more](https://gate.com/proof-of-security)

BTCBackAbove80K

58.53k Views41.32k Discussing

DemocratsWinBothChambers

21.04k Views467 Discussing

View More