

















#Gate广场万圣节 Why shouldn’t you buy the dip indiscriminately?
I. The core reason: bottoms are hard to predict in advance
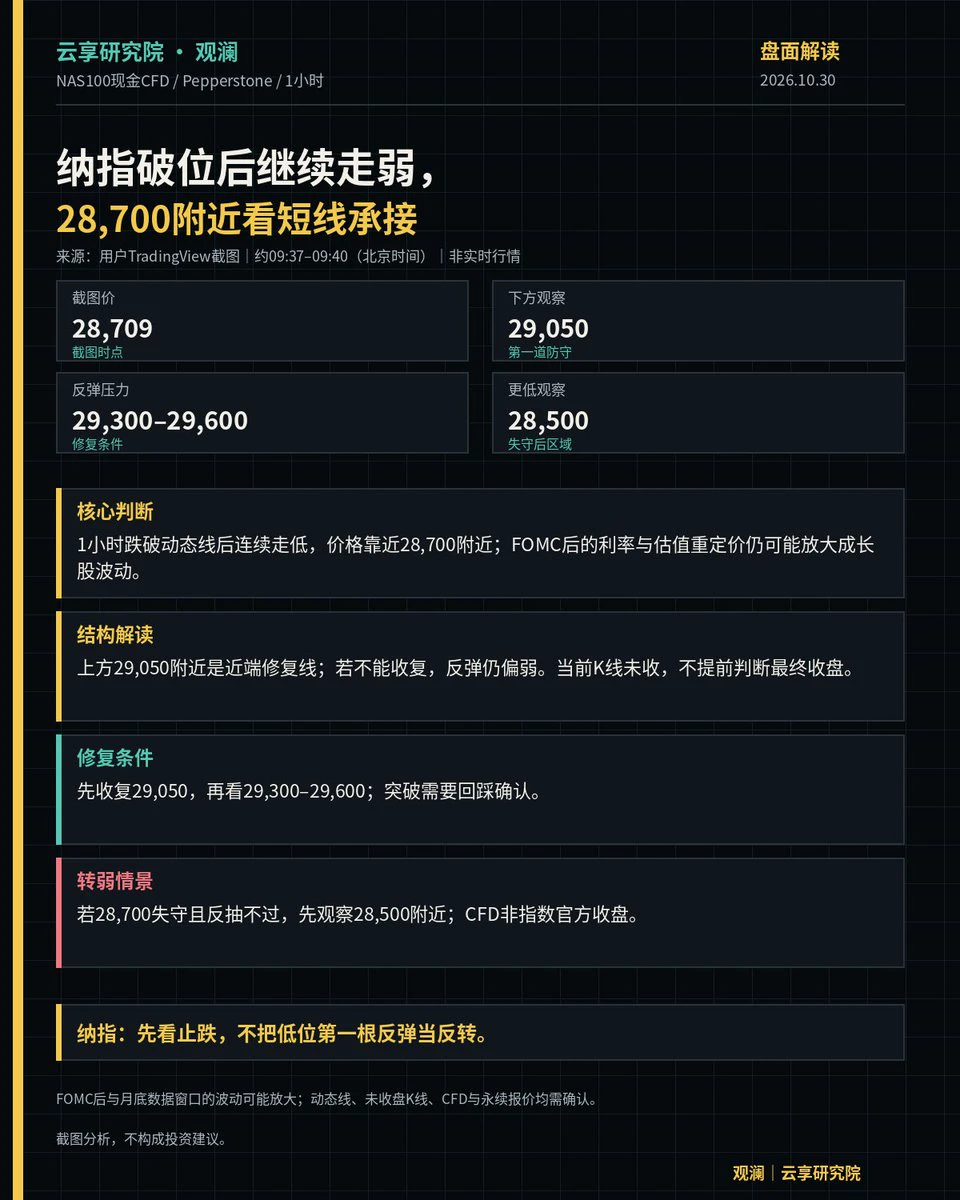
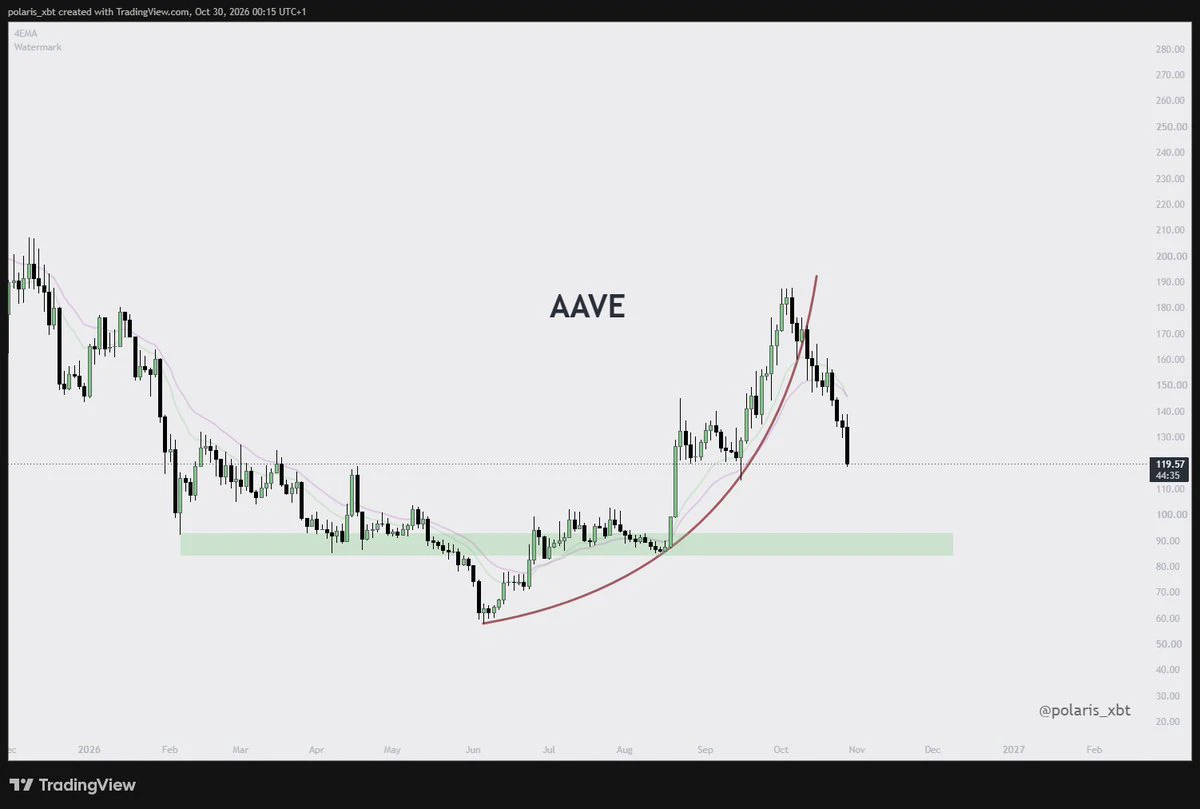
What you think is the bottom may just be a pause in the downtrend. After a stock has fallen for a while, it may look like it has dropped a lot and its valuation is very low. You may think it’s cheap and buy in, only to find that the decline was just taking a breather, with another sharp drop ahead.
In a downtrend, bearish candles can follow one another, and there can always be a lower bottom. A market bottom is not a single price point; it is often a range that takes time to form. Before a bottom is confirmed, anything that “looks like it can’t fall any further” is just an illusion.
Fundamentals can keep deteriorating. Many people buying the dip only look at how far the candlestick chart has fallen and ignore the underlying factors: industry dynamics have changed and demand is shrinking; company earnings keep falling and losses are growing; debt crises erupt or unfavorable policies emerge. If fundamentals keep worsening, there is no floor, only lower prices. A low valuation can get even lower.
Time cost is a hidden trap. Even if you buy near the actual bottom, the price may move sideways for years without rising. Your capital is tied up, and you miss other opportunities; the psychological strain continues until you can’t take it anymore and sell at a loss. Many dip buyers lose money not in a crash, but when their resolve breaks during a long bottoming process.
II. Human nature: the urge to buy the dip is essentially driven by two kinds of greed:
Wanting to buy at the absolute bottom and make quick money by seeing an immediate reversal after buying;
Thinking that after a big drop, a rebound must be due and subjectively assuming the market “should stop falling.” The market won’t follow your wishes. Rushing to grab a bargain is “desiring to acquire”—always wanting to get low-priced shares that others couldn’t get. This obsession is most likely to lead you into a major trap.
Chapter 48 of the Tao Te Ching: “When one is given to action, one is not fit to take the world.” Applied to trading: subjectively guessing where the bottom is and forcing a trade is “meddling and acting recklessly.” A truly good opportunity is to wait for confirmation signals and enter in the direction of the trend, rather than trying to catch a falling knife against the trend.
III. Risks at the level of trading rules
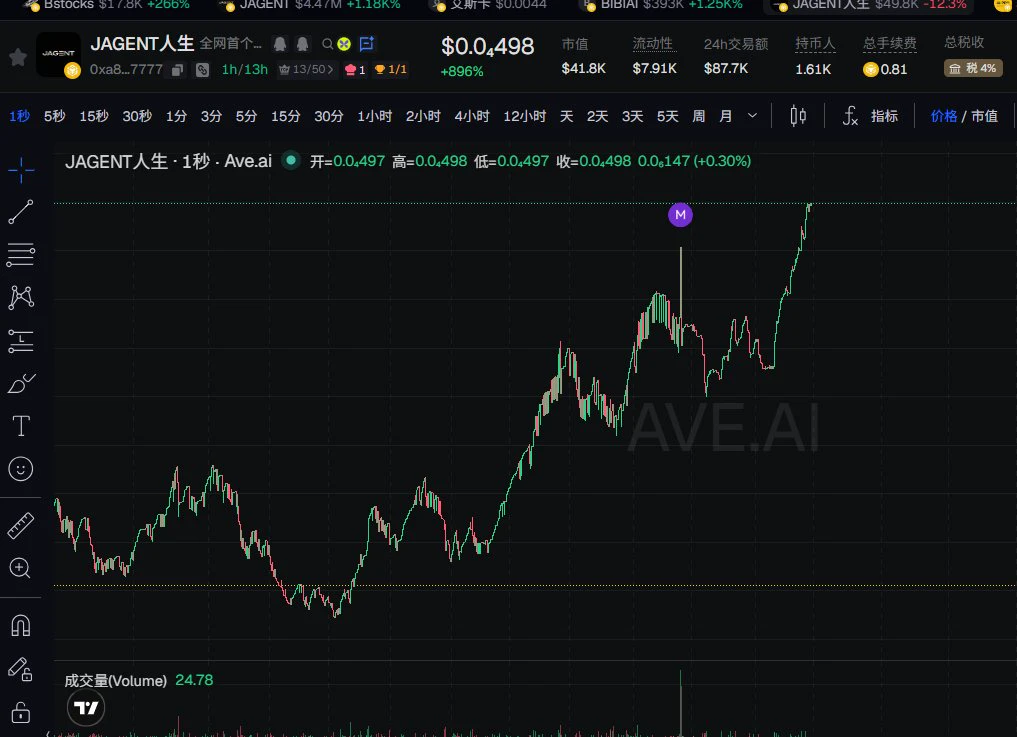
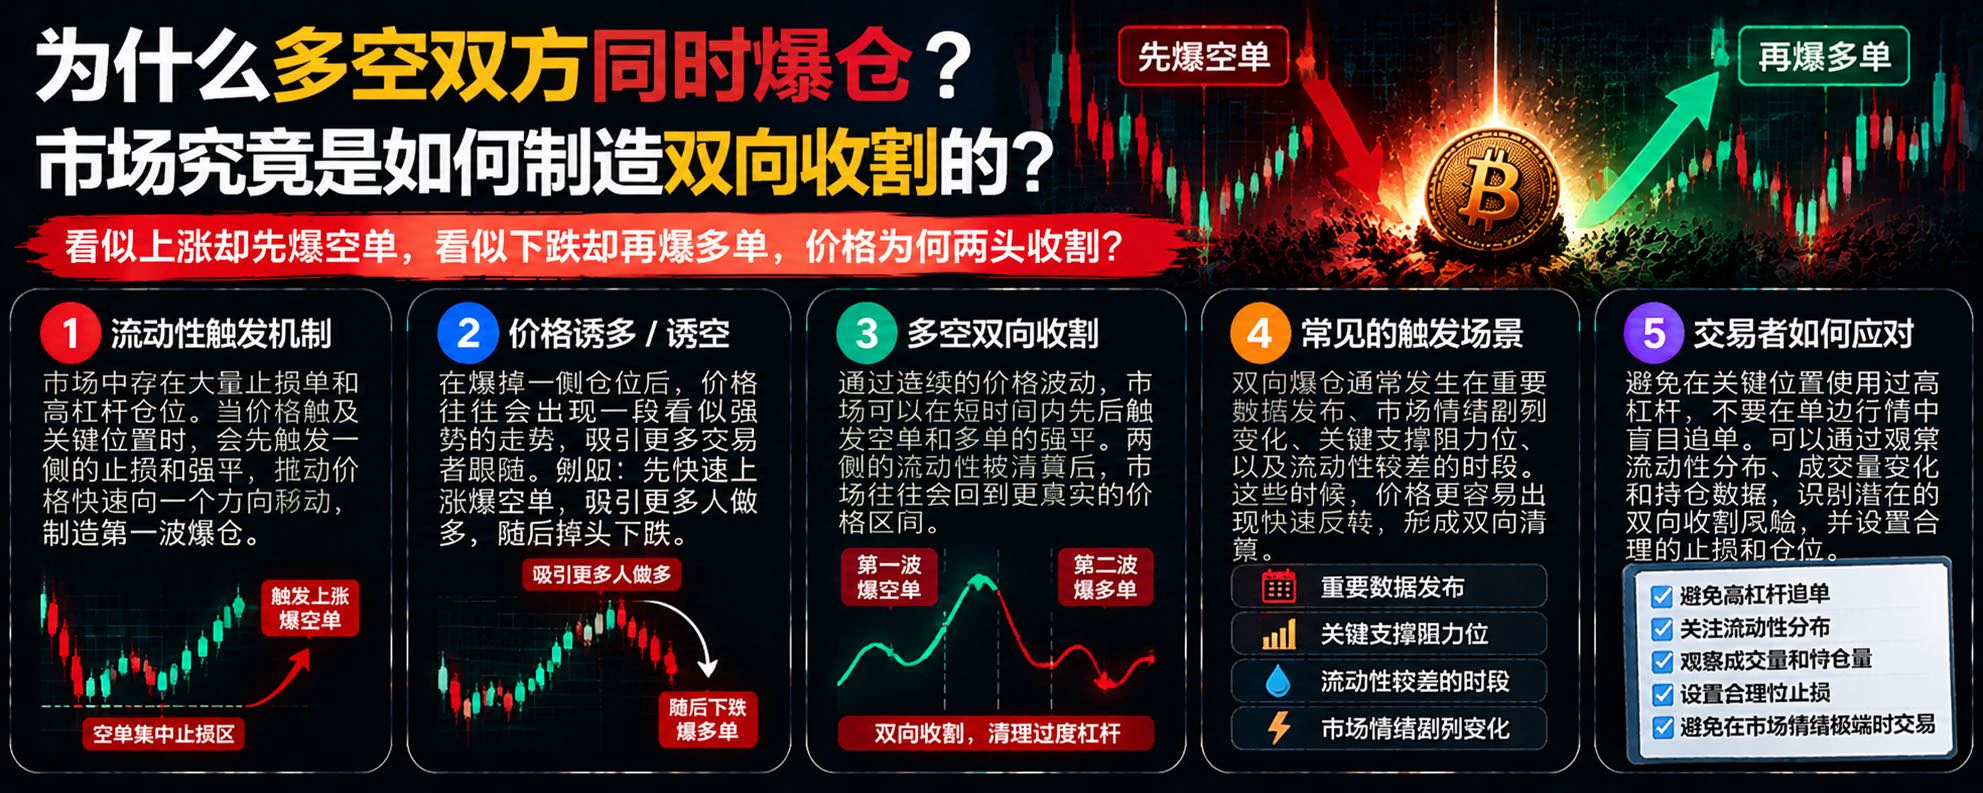
Downtrends have strong momentum. Once a trend forms, it reinforces itself. Most rebounds during a decline are brief bull traps—opportunities for sellers to unload their positions into the rebound—commonly called “falling knives.” Trying to catch one barehanded can get you hurt.
Loss of control over position sizing. Seeing a sharp drop, you think an opportunity has arrived and put a large portion of your capital into buying the dip. If prices keep falling, losses quickly mount, leaving no room for error.
Liquidity risk. Some stocks fall to low levels as trading volume dries up, making them hard to sell when you want to cut your losses; if a company blows up, its stock may hit the daily limit down for several sessions in a row.
IV. What counts as a “bottoming opportunity worth considering” (not buying the dip indiscriminately)
Don’t guess the bottom; wait for multiple signals to align:
Fundamentals stabilize: performance no longer continues to deteriorate;
Capital flow signals: prices stabilize on rising volume and stop making new lows; sentiment is washed out: negative news has repeatedly played out and the market is no longer panicking;
A clear stop-loss: decide before entering that if the price breaks down further, you will exit unconditionally.
The difference in one sentence: buying the dip (guessing a low against the trend) = reckless action; waiting for the bottom to be confirmed and then positioning with the trend = non-action, yet nothing is left undone.
Brief summary
You shouldn’t buy the dip indiscriminately because bottoms can’t be accurately predicted in advance and are often just pauses in a downtrend; fundamentals can keep deteriorating, and the lower prices fall, the cheaper valuations can get; the enormous time cost can wear you down until you sell at a loss; the urge to buy the dip comes from greed, from always wanting to bet on the absolute low, which is reckless action against the trend.