Square
Following
Hot
News
Notifications
Profile
Share your thoughts
placeholder
Article
After all the hacks this year we understand that even if your money is in a big exchange, it doesn't mean you're safe from being unable to use it.
Yet this looks more troubling...
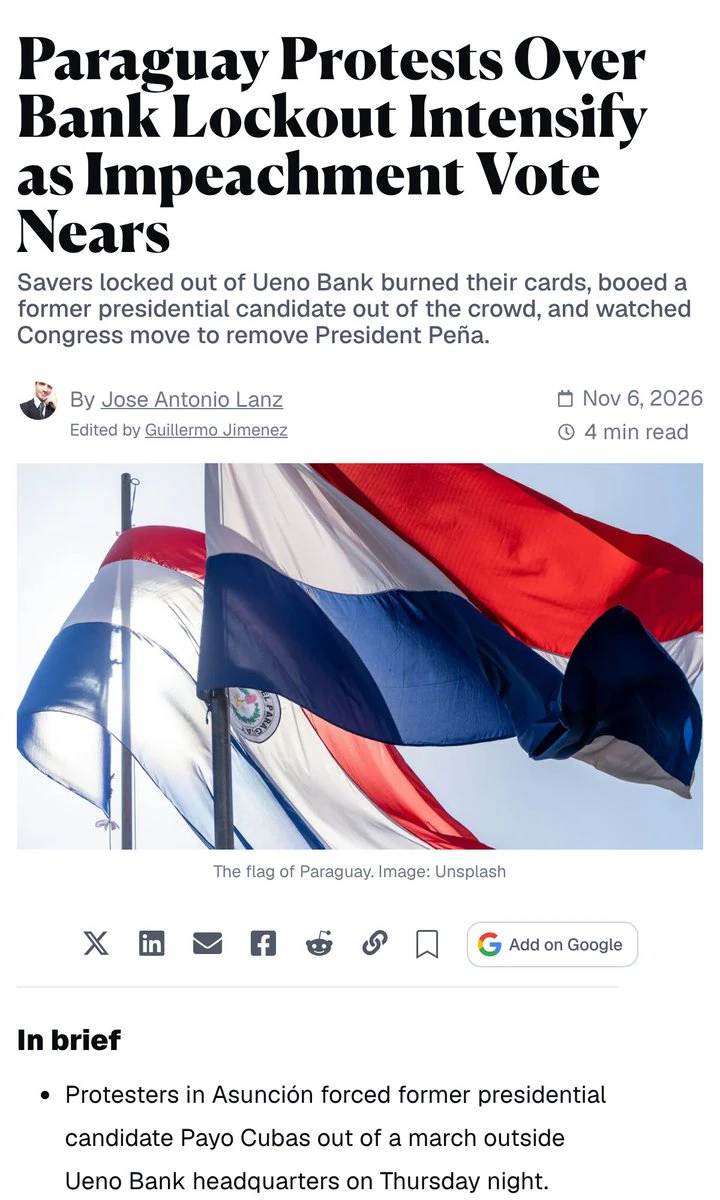
In Paraguay a digital bank was taken over this week and about 3 million people, around 60% of the country's adults, got locked out of their accounts.
The guarantee covers up to about $36,000 per person, but the first payouts only go to accounts with up to about $1,600.
post-image
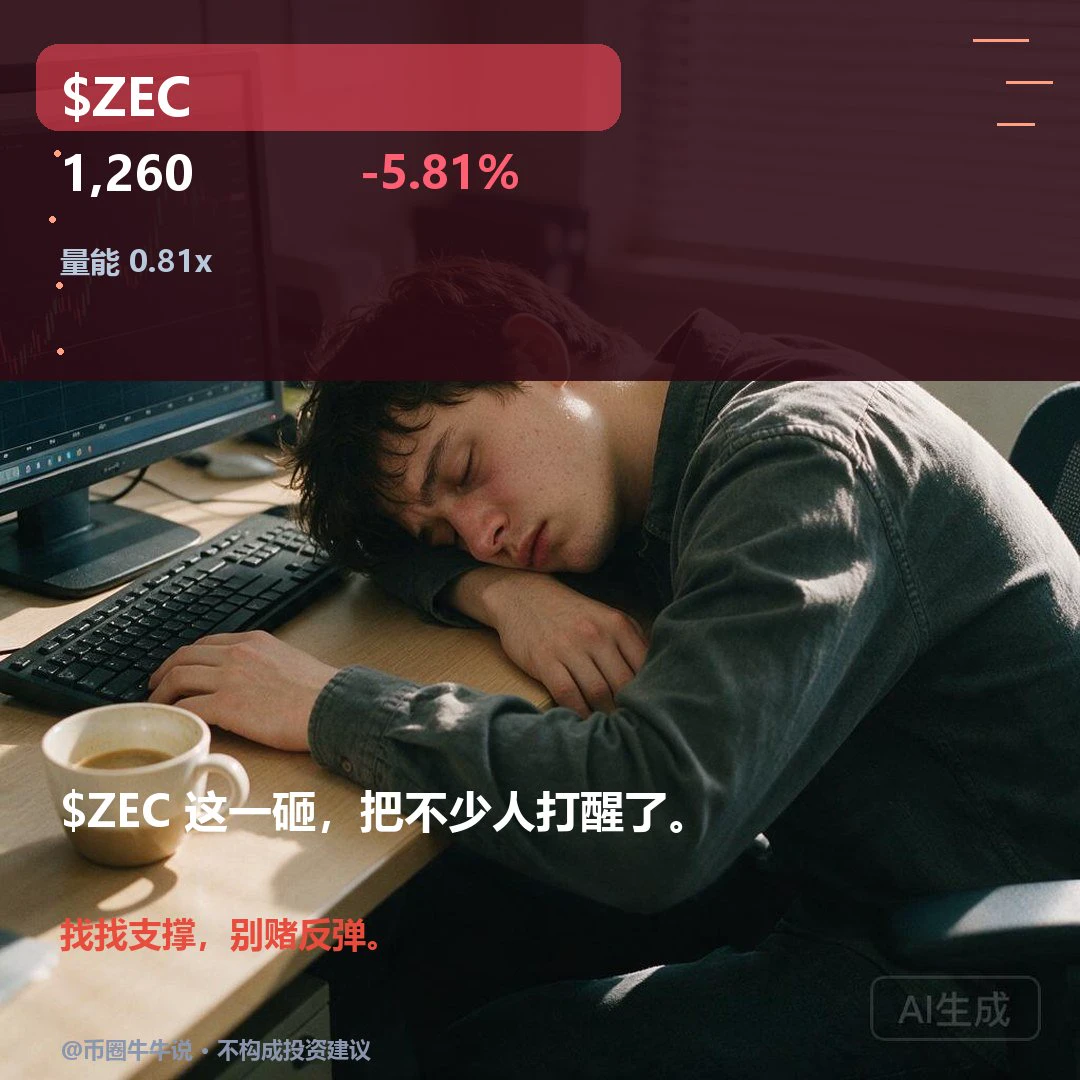
$ZEC 1260.25, 24H -5.81% (1235.00–1339.66). 1H is weak, RSI 41.22/EMA20 1270.69, support at 1235.00/resistance at 1334.33, volume ratio 0.81; 4H is weak, RSI 51.84/EMA20 1281.84, support at 1183.38/resistance at 1387.89. A sustained move above the 1334.33 resistance would be meaningful; a break below the 1235.00 support would signal weakness. Review and verify a sustained hold above 1334.33 and a break below 1235.00 followed by a reclaim; invalid if volume is lacking or the level is not reclaimed. The market is volatile; for observation only.
post-image
ZEC+1.16%
Trenches
ZIG
Z
bade
b
ZIG
0x8c...1145
Market Cap
$.
Change
.
24h Vol
$.
Holders
.
STONK
S
bade
b
STONK
6GmA...UNgx
Market Cap
$.
Change
.
24h Vol
$.
Holders
.
IDOL
I
bade
b
IDOL
0x3b...ab07
Market Cap
$.
Change
.
24h Vol
$.
Holders
.
BTC
B
bade
b
BTC
C5xp...pump
Market Cap
$.
Change
.
24h Vol
$.
Holders
.
FLOAT
F
bade
b
FLOAT
Bv1a...BMmr
Market Cap
$.
Change
.
24h Vol
$.
Holders
.
#StockTalkSeason

Stock Talk Season: Can Better Market Discussions Lead to Smarter Investment Decisions?

What Is the Biggest Myth?

Many people believe that successful stock investing is all about finding a company whose share price will rise. But that is only one part of the picture. Understanding why a company may grow, what risks it faces, and whether its current price makes sense are equally important.

A rising stock is not automatically a good investment, just as a falling stock is not automatically a bad one. Good decisions come from research, patience, and the ability to understand d
post-image
Two-Week Market Review: Through Rotating Gains and Losses, an Unassuming Approach Goes the Distance

  The two-week market period has come to a close. BTC completed two full cycles of gains and losses, while ETH followed in lockstep throughout. Volatility narrowed, and the pace remained highly synchronized, just as the old saying goes: “Tides rise and fall according to their own rhythms; clouds gather and disperse in their own time.”

  The first week began with wide swings around the 80k level, as daytime rebounds alternated with nighttime pullbacks and bulls and bears repeatedly whipsawed th
BTC-0.65%
ETH-1.23%
$MET Trend watch: After rising from the bottom area, trading volume has increased significantly as the price rebounded. It has moved back above the 7-day and 25-day moving averages, and short-term sentiment is warming. The market shows active capital inflows driving the move, with strong bullish momentum. There is still room for further upside, so the strategy is to add to long positions in line with the trend⬇️⬇️⬇️

MET +18.68%
Risk warning: The above is only my personal market view and does not constitute investment advice. Contract trading is highly volatile, so please manage your position
post-image
MET-0.16%
$UAI ‌
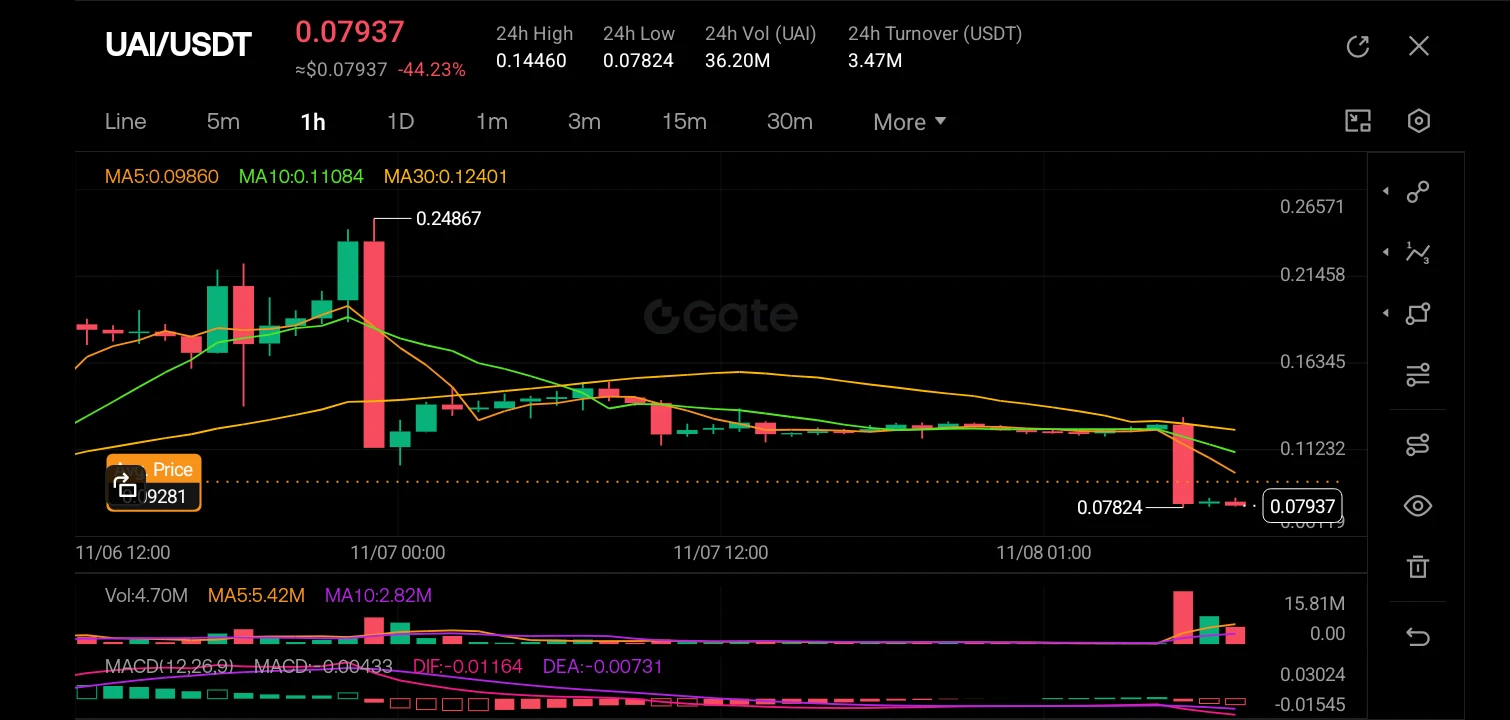
The 1-hour chart for UAI/USDT is showing a severe bearish breakdown, with the price currently sitting at 0.07937, representing a massive 44.23% drop over the 24-hour period. The chart clearly displays a steep waterfall decline from the recent high of 0.24867, completely obliterating the short and medium-term moving averages (MA5, MA10, MA30), which are now fanning out downwards in a classic bearish alignment. The most recent candle is a massive, long-bodied red marubozu that has crashed through any nearby support levels, accompanied by a significant volume spike (15.81M), indicating in
post-image
UAI-7.58%
  • 3
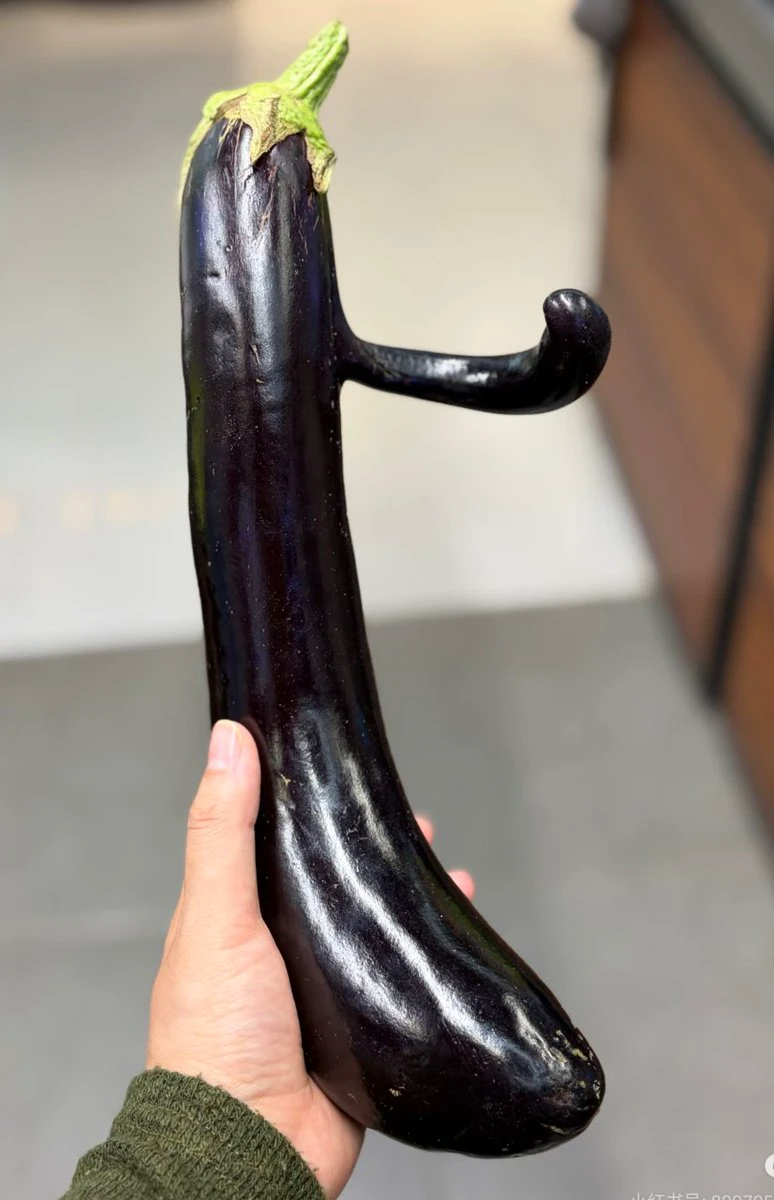
Everything has a spirit!
Treat it kindly.
post-image
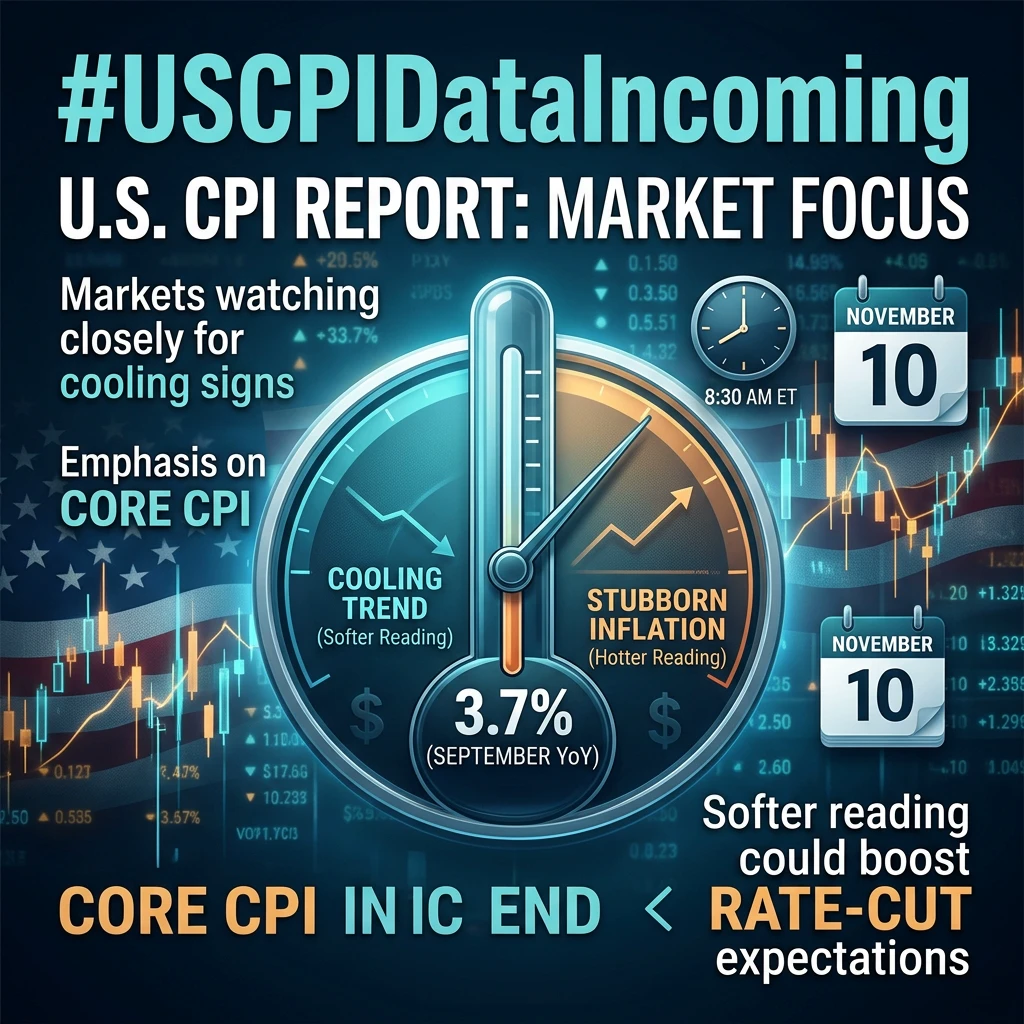
#USCPIDataIncoming

Will the Next U.S. CPI Report Trigger a Major Move in Bitcoin, Stocks and Gold?

The Key Question

Will U.S. inflation cool enough to improve market sentiment, or will another hot reading create fresh pressure across financial markets?

Investors are preparing for an important economic release on November 10. The October U.S. Consumer Price Index (CPI) report is scheduled for 8:30 a.m. Eastern Time. Its results could influence expectations about future Federal Reserve interest-rate decisions and create volatility across Bitcoin, U.S. stocks and gold.

The important point i
post-image
BTC-0.67%
$ARB The chart keeps forming higher lows. Brothers, take the opportunity to earn a bowl of Vietnamese pho🤩Go long now🔥🔥Take-profit 1: 0.182 Take-profit 2: 0.2 Take-profit 3: 0.25 Stop-loss: 0.139$IDOL $AIN
post-image
ARB+1.17%
IDOL-6.71%
AIN+3.85%
#StakeOnLaunchpoolToShare450KVLX Yield Optimization Protocol: Allocating Capital to the 450,000 VLX Staking Pool

The structural mechanics of wealth preservation during periods of high macroeconomic volatility require a disciplined shift toward non-directional, cash-flow-generating asset classes. As global equity indices navigate intense valuation resets and data-center sector adjustments, maximizing the capital efficiency of idle digital assets becomes a primary operational mandate. Recognizing this need, the official deployment of the Velas (VLX) Launchpool initiative introduces a high-viabi
VLX+0.00%
  • 5
  • 1
Former React core member Cheng Lou (@_chenglou) joined Core Automation from Midjourney.
He worked at Midjourney for about 3.5 years. Notable projects include the text layout library Pretext and the experimental neural programming tool Handwired; he previously contributed to React, Messenger, and ReasonML / ReScript.
His official new title has not yet been disclosed.
$NEAR 🔬

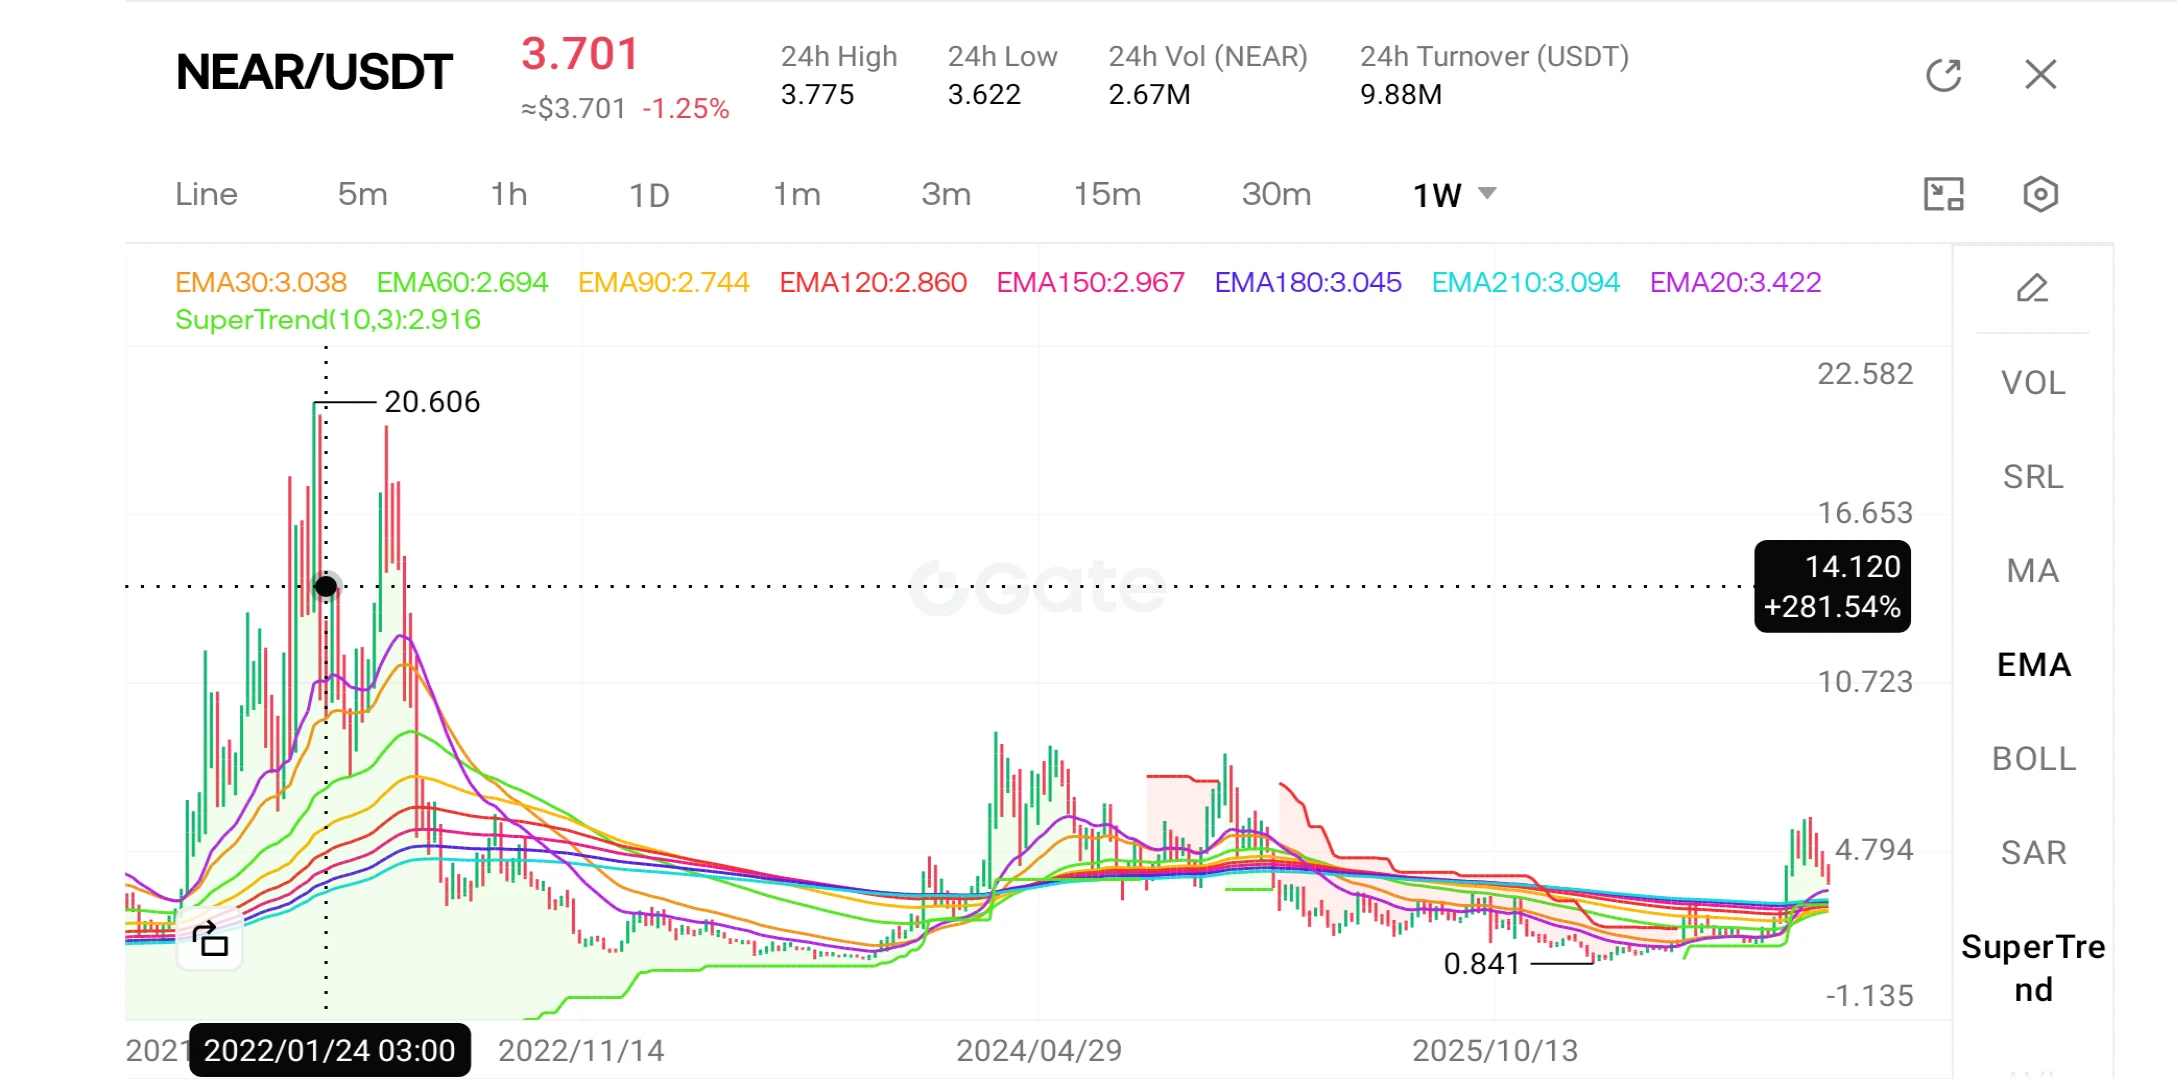
The native token of the NEAR Protocol is trading at approximately $3.65, having lost over 35% of its value since reaching a peak of $6 in early October. The price currently sits below its short- and medium-term moving averages but remains above its long-term moving average, with the $3.50–$3.60 range serving as a critical support level. Furthermore, it has been confirmed that the governance body has approved a proposal to gradually reduce the token supply, and new platforms focused on AI agents are being launched on the NEAR network.

What does this journey from peak to trough tell u
post-image
NEAR+1.17%
  • 5
  • 2
[ NEW STREAMER ] TODAY MARKET TALK
live-cover
LIVE661
In BTC trading, many people see the price break through an important resistance level and immediately chase the rally, worried they’ll miss an opportunity to profit. But experienced traders often pay attention to another important signal after a breakout: the pullback.
Why is a pullback after a breakout worth watching?
First, it helps confirm whether the breakout is valid. After the original resistance level is broken, it may turn into new support. If the price falls back to this area but doesn’t break significantly below it, that may indicate the market is reconfirming its role as support.
Se
BTC-0.67%
[new streamer]MARKET UPDATE
live-cover
LIVE1,054
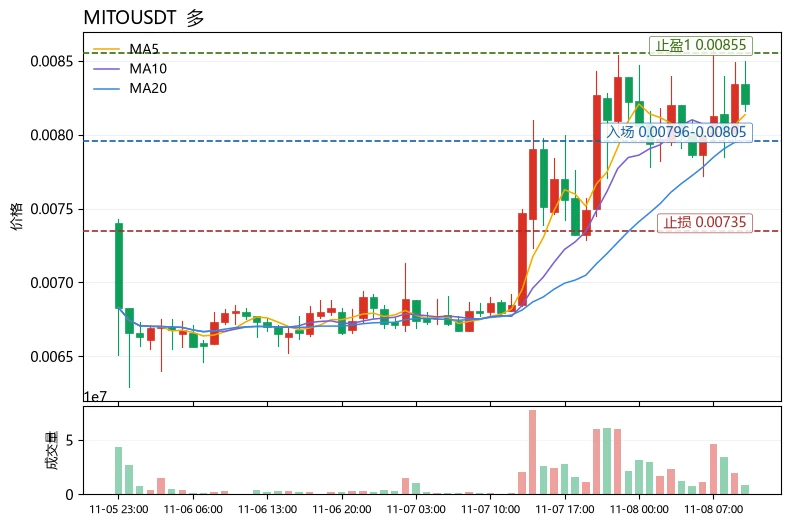
$MITO Short-term bias is bullish, but this is a low-tolerance trade amid high volatility, so the position must be kept below half the usual size. Rationale: The current price of 0.00821 is above MA5 (0.008136) and MA20 (0.0079635), with the moving averages in a bullish alignment; however, the MACD histogram remains negative (-1.393e-05), indicating that upward momentum is not yet confirmed. RSI at 59.2 has also not entered the strong zone, and the 30-candle amplitude is as high as 23.51%, making this a typical high-volatility asset. The Fear & Greed Index is at 28, in the fear zone; sentiment
post-image
MITO+8.51%
HYPE+0.24%
ETH-1.26%
$KORU Keep going long and look for a rebound! Targeting around 7.5–8! Others are fearful, I'm greedy! Just go for it! Hop aboard and pick up some easy money!
post-image
KORU-1.22%
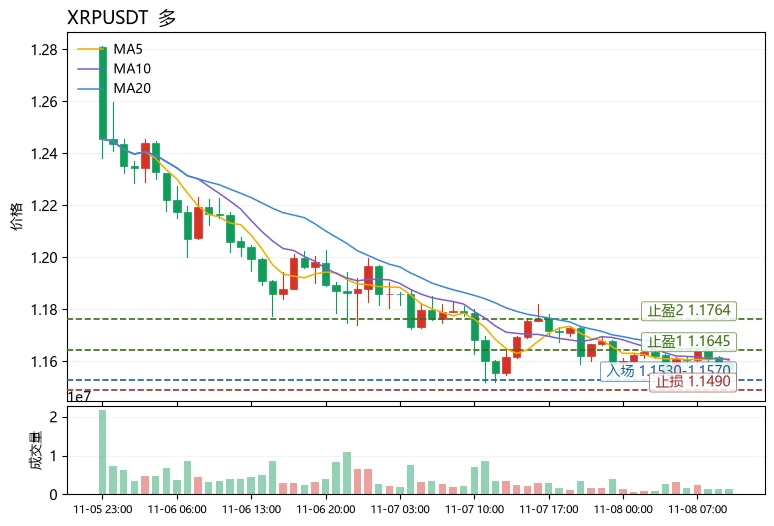
$XRP Current price: 1.1565. Resistance above is at 1.1645 (MA20) and 1.1764 (upper Bollinger Band), with support below at 1.1526 (lower Bollinger Band). The price is below MA5 (1.1604) and MA20 but above the lower Bollinger Band, forming a weak consolidation structure; bulls have yet to reclaim the medium-term moving average.
Technical breakdown: MA5 is below MA20, with the short-term moving average still capping rebounds. However, the MACD histogram is positive (+0.001018), indicating an early recovery phase as momentum shifts from bearish to bullish. RSI at 37.8 is approaching the weak zone
post-image
eur
eureur
Gate.Fun
MC:$5.55KHolders:3
0.06%
XRP-1.15%
ADA-1.48%
Load More

Join 40 M users in our growing community

⚡️ Join 40 M users in the crypto craze discussion

💬 Engage with your favorite top creators

👍 See what interests you

Trending Topics

USCPIDataIncoming

1.04k Views1.48k Discussing

The U.S. October CPI report will be released on November 10 at 8:30 a.m. ET. September CPI came in at 3.7% year over year, and markets will be watching closely for signs that inflation is cooling, especially in core CPI. A softer-than-expected reading could strengthen rate-cut expectations, while hotter inflation may pressure risk assets through higher Treasury yields and a stronger dollar. How do you think this CPI print will move $BTC, U.S. stocks and gold?

USAIStocksHitHard

23.56k Views3.69k Discussing

USNonfarmPayrolls

40.34k Views4.38k Discussing

View More