Share your thoughts
placeholder
Article
They say privacy coins quietly make big money — this time ZEC quietly hit a “10-year high.”
Yesterday it was still the invisible man of crypto; today the entire market is shouting its name. Low-key? Not a chance— even $1,000 couldn’t hold it back.

On the surface: ZEC broke above $1,000, hitting a nearly 10-year high, with privacy coins rallying across the board.
In reality: Gate spot $1,016.73 (24H +7.57%), perpetuals $1,015.81—the surge is real, but this was an “event-driven + short squeeze” frenzy, not a healthy bull market that climbed gradually.
Within a single day, the high was $1,050 a
post-image
ZEC+8.35%
TSLA-5.96%
Bad Boy Watch, Update 2, 26.9.05 (UTC+8) 9:30
Figure 1: RKLB daily chart
Little Rocket closed at 64.26 today, with an intraday high of 65.00, a low of 63.20, and a gain of 0.71%.
Little Rocket was rejected at the 10-day moving average yesterday. It is easier to fall than rise, and Little Rocket’s real upside catalyst depends on the Neutron rocket. Expectations ahead of its unveiling could bring positive sentiment to the market. Seizing this opportunity should yield decent returns.
Figure 2: GT daily chart
GT is currently above the 8u level. As long as it does not fall below 8u, there should be
CryptoPlayerWithBadIntentions
Bad Boy Watch, Part 2 Update, 26.9.04 (UTC+8) 10:50
Figure 1: RKLB daily K-line
Little Rocket closed at 63.80 today, with an intraday high of 64.90 and a low of 62.36, up 1.13%.
For now, it still appears to be trading above the yearly moving average. Yesterday, I was hoping Little Rocket would follow with a big bullish candle—how did my jinx end up boosting Big Rocket instead? Your big brother rose, so why didn't you rise as well?
Let's see how it performs tonight. First, it needs to move above the 10-day moving average, followed by the 5-day moving average crossing above the 10-day moving average. Take it step by step.
Figure 2: GT daily K-line
gt now appears to have firmly held above $8, and is now eyeing the $10 round-number level.
repost-content-media
RKLB+0.70%
GT-1.05%
A Brief Analysis of BTC’s Short-Term Trend from Dow Theory, Chan Theory, Elliott Wave Theory, Volume-Price Relationships, Order Flow, and Price Action
I. Dow Theory
Primary trend (1-hour timeframe): The primary downtrend from the historical high of 82,814 on May 6 confirmed a trend reversal in mid-August. The price began a strong rebound from the August 14 low of 62,488. After forming a double bottom at 63,979 at 03:00 on August 18, the bulls launched an epic rally. The price surged from 63,979 to the August 28 high of 81,346.95, setting a new high for the current phase, for a cumulative gain
BTC-1.63%
Scumbag Watch Episode 4, 26.9.05, Beijing time 8:30
Figure 1: CRCL daily candlestick chart
U.S. stock closing price: 102.05; intraday high: 102.785; low: 97.10; down 1.14%
CRCL opened lower and moved higher yesterday. It still looks relatively strong for now. After filling the small gap around 104, another push toward 120 is not out of the question.
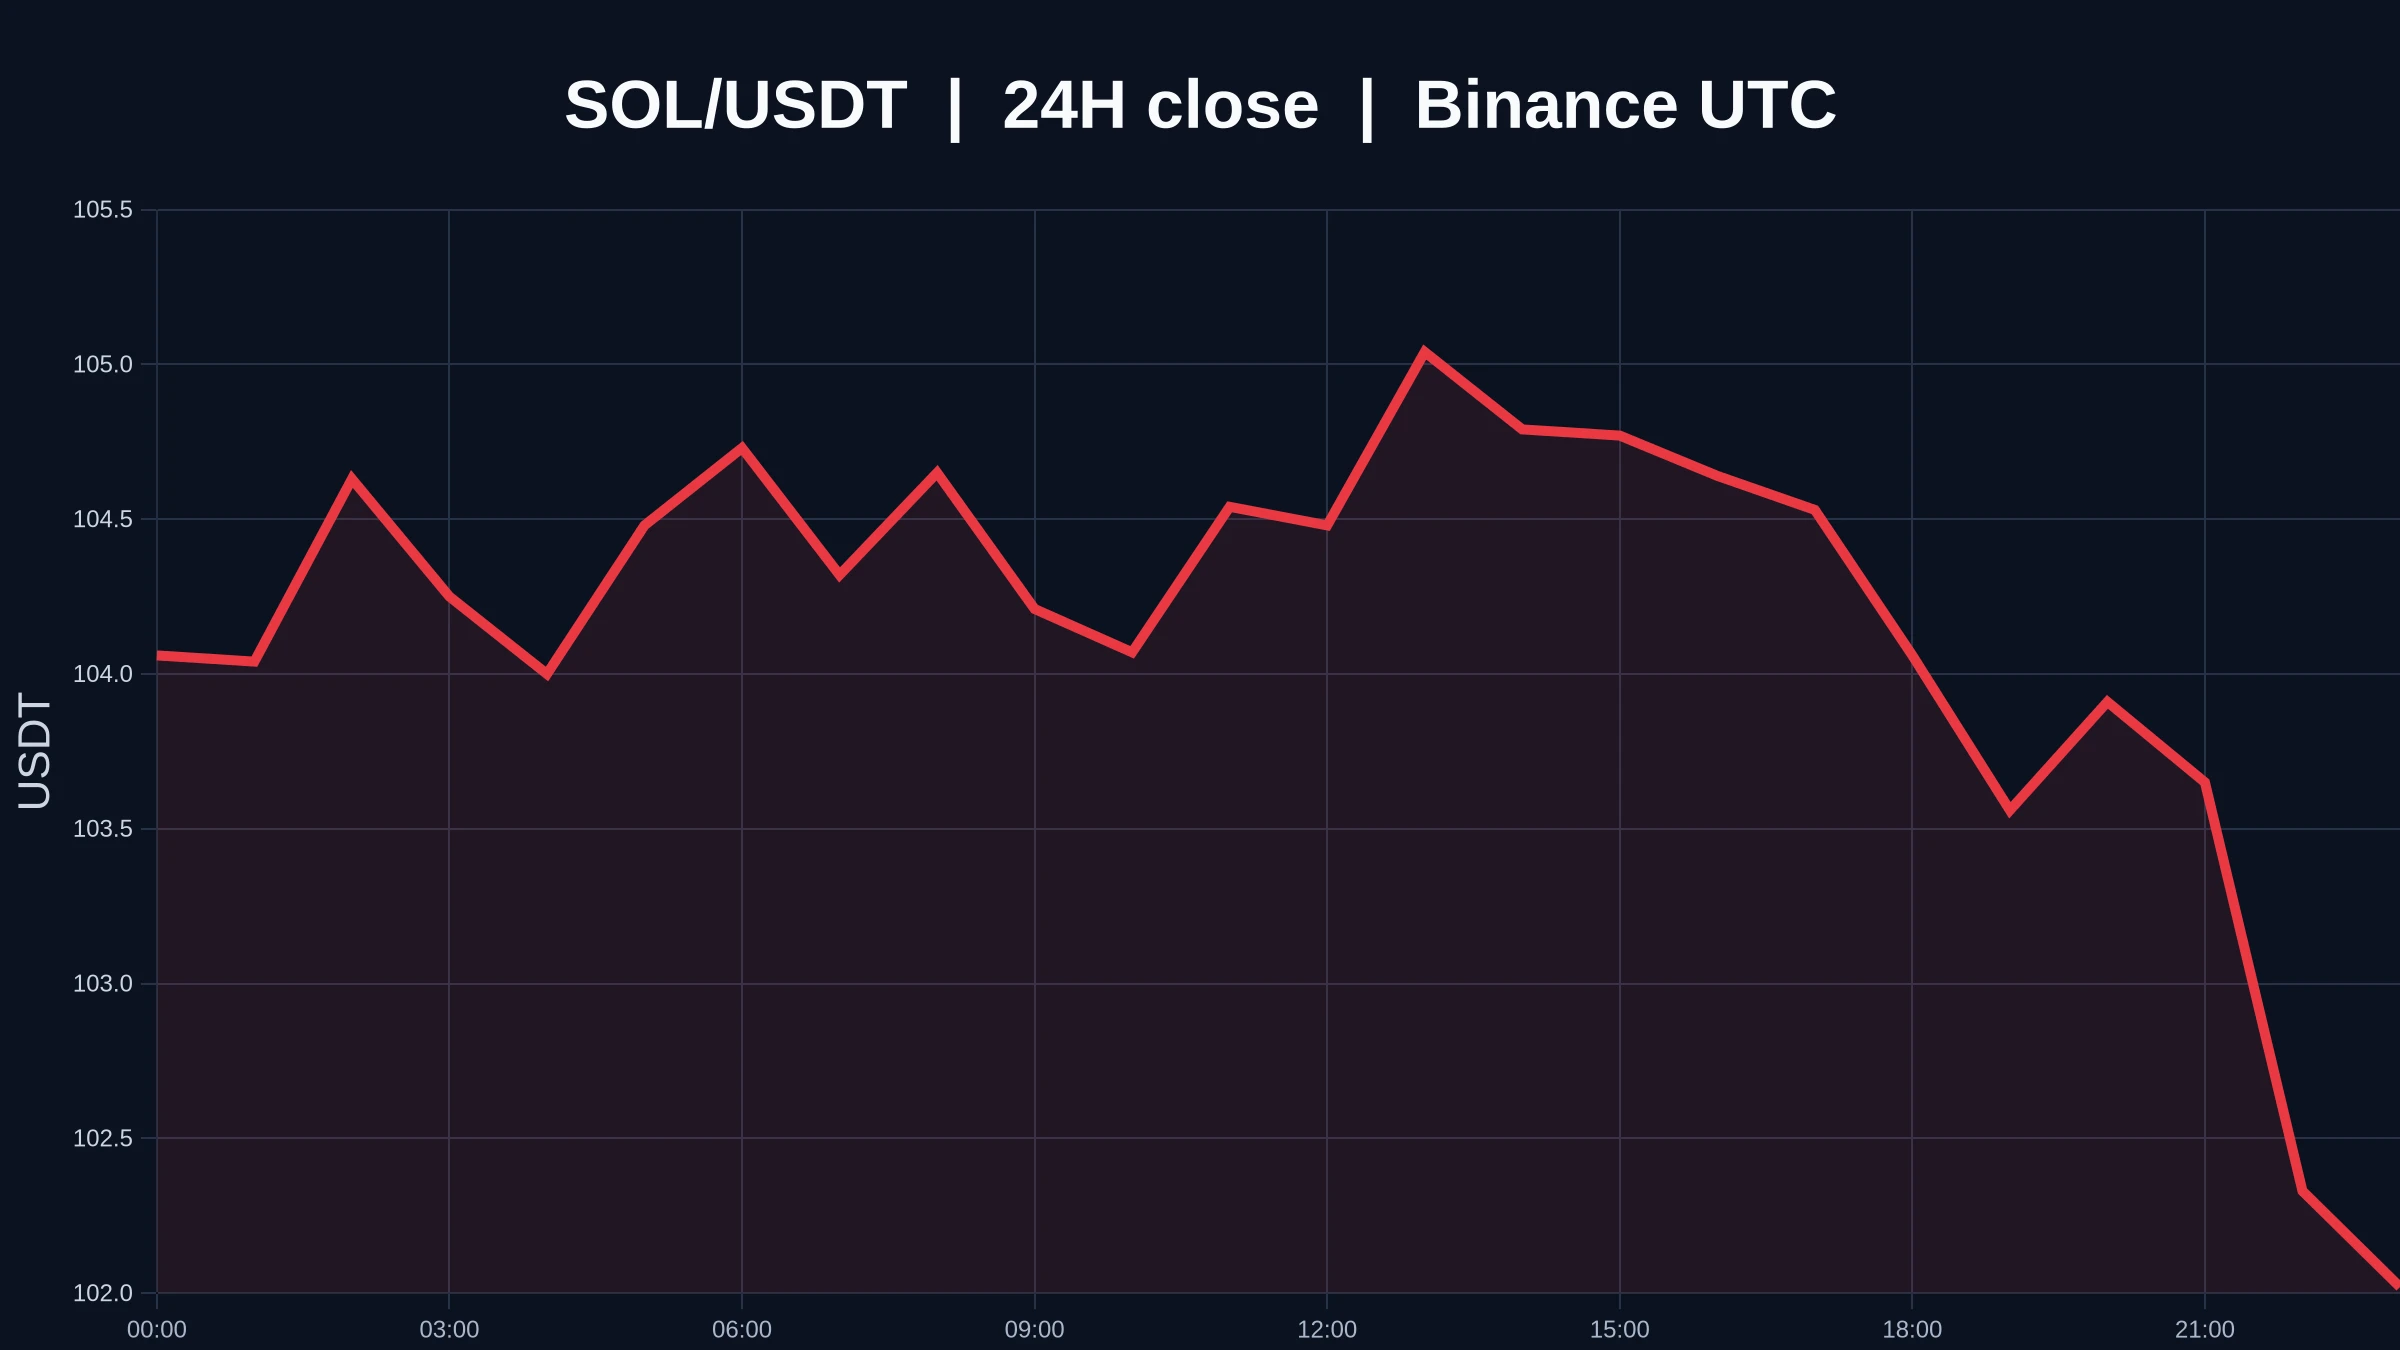
Figure 2: SOL daily candlestick chart
SOL closed above the 5-day moving average. Going forward, continue to monitor whether the 100 level will be decisively broken below again.
CryptoPlayerWithBadIntentions
Jerk Watch, Issue 4, 26.9.04 Beijing time 8:15
Figure 1: CRCL daily candlestick chart
U.S. stock market closing price: 103.23; intraday high: 103.28; low: 91.70; up 16.46%
As the jerk expected, crcl has no problem as long as it does not effectively break below the large bullish candlestick formed previously.
But today's performance did exceed the jerk's expectations, rising over 16% and nearly closing at the high. It completely made it impossible to get on board. So whether it can directly challenge the 150 level next, please wait and see patiently.
Figure 2: SOL daily candlestick chart
After sol found support at the upper boundary of the range, today's daily close provided strong confirmation. We will wait and see whether it will challenge the previous high again next.
Currently, crcl has also broken through the 100 mark. Of course, the SOL line was the one that reached the 100 mark.
The jerk is now launching a new prediction: which one will be the first to reach 150? Leave a comment and repost to participate.
Total prize pool: 200U
repost-content-media
CRCL-1.17%
SOL-1.61%
#BTCReclaims80K Reclaims 80K, Why This Level Matters Again
Bitcoin has reclaimed the 80,000 dollar level, bringing fresh attention back to one of the most important psychological zones in the crypto market. A move above 80K is not simply another price milestone. It can represent a meaningful shift in market sentiment, especially after periods of uncertainty, volatility, and heavy selling pressure.
The 80K level carries strong psychological importance because traders and investors naturally pay close attention to large round numbers. When Bitcoin trades below such a level, it can become resist
BTC-1.63%
  • 1
Bitcoin’s next big test is TODAY
BTC is hovering near $76.5K–$77K after US strikes on Iran spiked oil past $94 and revived inflation fears. Now the US jobs report drops today — and it lands into a market already pricing ~60% odds of a September Fed rate hike.
A hot number = more hike pressure = more heat on crypto.
A weak one could flip the whole mood.
Two macro bombs in one week, and BTC’s still outperforming gold and stocks.
Are you positioning before the print or waiting for the dust to settle?
BTC-1.63%
Everyone’s staring at gold, but $XAG /USDT just printed a short setup that smells like a trap—or a gift.

$XAG /USDT - SHORT

Trade Plan:
Entry: 66.19 – 66.37
SL: 67.17
TP1: 65.61
TP2: 65.17
TP3: 64.50

Why this setup?
- 4H bias is SHORT (55% confidence), but the 1D trend is *range*—so this isn’t a breakout, it’s a fade.
- Entry pinned at 66.28 with TP1 at 65.61 (a 1% drop) and TP3 at 64.50 (2.7% down).
- RSI on 15m is 50.65—neutral, not oversold, meaning downside room still exists before buyers step in.
- Why now? Price is stalling at range resistance; if 66.95 (invalidation) holds a
XAG-0.81%
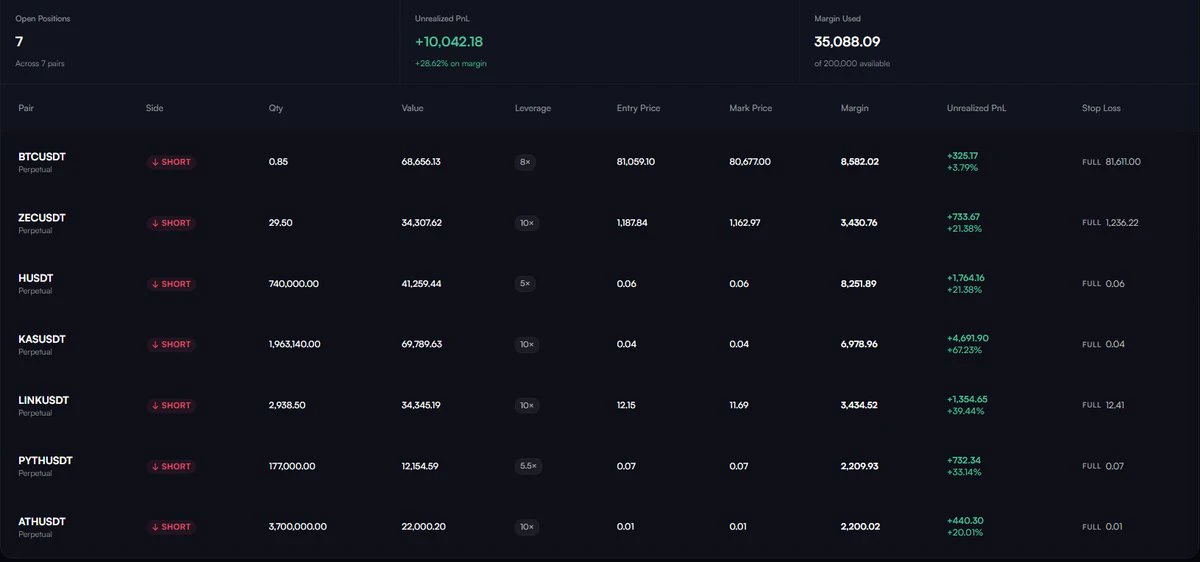
A few days ago, I was still calculating whether I had enough money for instant noodles this month. This morning, I was already wondering whether to add a sausage. Right after reading the bearish news, I noticed something was off with the market. $CFG bounced back, but the volume failed to follow, with insufficient support—a typical weak rally. I know this kind of market action all too well: any move up is just handing money to the bears.

I decisively entered a short at 0.30073, and it has now reached 0.10002, with a +661.94% return. What does comfort feel like? This is comfort.

As for the
post-image
CFG-5.62%
DOGE-2.72%
LAB+0.77%
$FONE looks completely dead. Large traders L/S ratio is stil 0.5, but retail traders LS ratio growing and 1.64 for now.
Literaly every green candle in past two days is some big short position being closed.
Open interest slowly drops, meanwhile there was still almost zero long liquidations meaning lot of people still holding their losing long positions waiting for a miracle.
Well, I guess retail traders are just exit liquidity.
‍Better don't long $FONE untill you'll see at least few green candles in a row and increase in open interest. It can realy keep dropping to zero.
#FONE
post-image
FONE-23.48%
Everyone’s staring at Bitcoin—but LINK just printed a 95% long signal that nobody sees yet.

$LINK /USDT - LONG

Trade Plan:
Entry: 11.58 – 11.64
SL: 11.32
TP1: 11.83
TP2: 11.98
TP3: 12.20

Why this setup?
- 4H structure is bullish with 1D trend confirming, but 15m RSI at 44.9 means we’re early, not late.
- Entry zone 11.58–11.64 is a liquidity grab before TP1 at 11.83 and TP2 at 11.98.
- ATR (1h) at 0.1227 gives tight risk: stop at 11.32 is only 2.5% away for a 3.2% first target.
- Why now? The pullback is shallow, and the invalidation at 11.31 is clean—either we bounce here or the t
LINK-1.75%
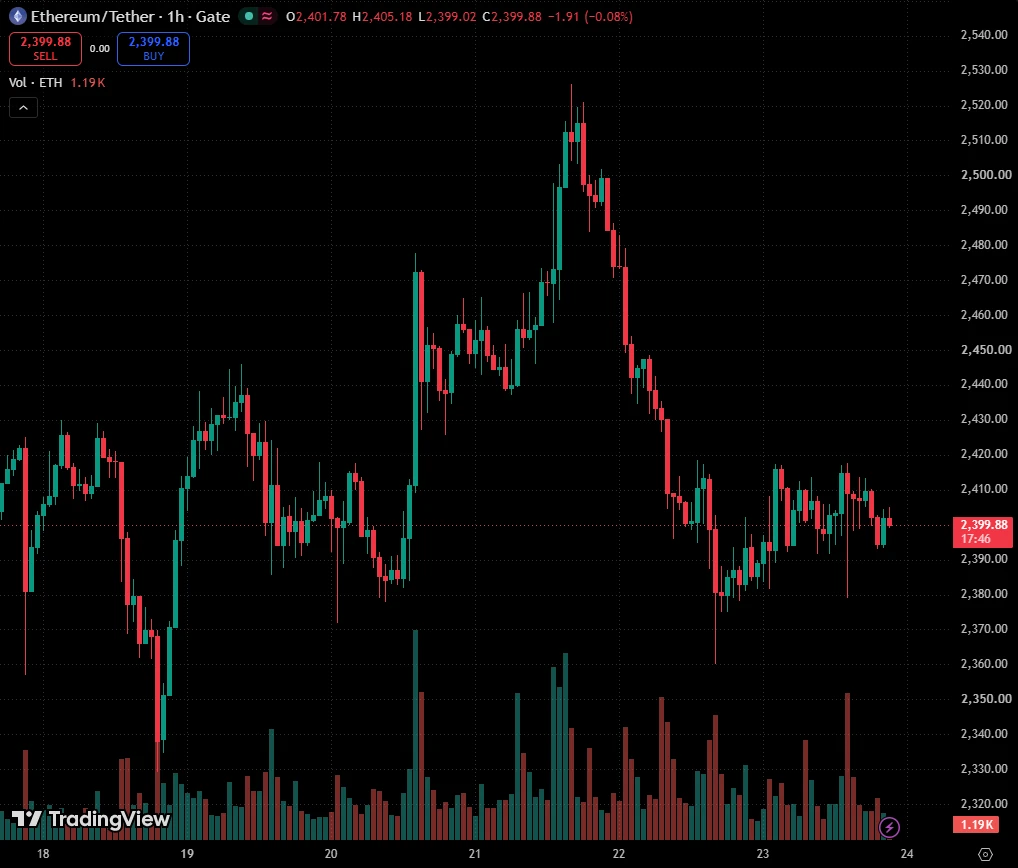
ETH is currently entering a high-level pullback phase, with signals across multiple timeframes gradually coming under pressure. Rebounds on smaller timeframes are mostly corrective moves during the decline, rather than a trend reversal. On the 4-hour timeframe, this adjustment cycle has only reached its midpoint, leaving room for a bottom-reversal signal to emerge. The price is fluctuating near the 4-hour short-term support at 2444, which is currently the key lifeline for the medium-term trend. No strong buying support is visible at present; once this support fails, the pullback could expand f
post-image
ETH-2.01%
Expectations for a high peak at the start of the year were followed by a sustained long-term decline; the probability has recently fallen further to a low of 14.5%, while market expectations for the bill to be enacted this year continue to cool.
post-image
JUST IN: Bitcoin is trading as an amplified version of gold amid macro uncertainty, with BTC/Gold correlation at multi-year highs and a four-year cycle headwind ahead. $BTC
post-image
BTC-1.63%
Another Flush out before a Massive Breakout
$400M Coming for $CASHCAT
Billions Coded
Never Ignore My Signals
See what happened with $PONS & Others
post-image
CASHCAT-16.98%
PONS-3.65%
[New stremer ]BTC
live-cover
LIVE549
$DASH Signal】1H breaks above the upper Bollinger Band, bullish momentum continues
$DASH RSI 1H 81.36, with the price at 64.26 breaking above the upper Bollinger Band at 62.88. MACD momentum is expanding across both timeframes, with the 4H histogram at 1.84. Bid depth dominates the order book, with a Bid/Ask ratio of 1.73, and the funding rate at 0.01% shows no signs of overheating. OI is stable, with no signs of short-side resistance.
🎯Direction: Long
⚡Entry/limit order: 64.0672 - 64.2600
🛑Stop-loss: 63.6174
🚀Target 1: 65.2239
🚀Target 2: 65.7059
🛡️Trade management:
- Execution strategy:
post-image
DASH+41.07%
I originally wanted to cut my losses and sacrifice them to the heavens, but the ceremony never happened—the meat roasted itself. 🔥 While everyone else was running, I took one more look at the order book.
At the time, the screen was full of panic, but the bottom held steady, funds were quietly entering, and the volume-price action wasn’t bad. I judged it to be a fake breakdown, so I opened a long position around 225.0 without hesitating for too long. The market has now reached 227.5, with a +49.26% return—nailed it.
The early phase was genuinely sluggish, but the breakout feels great. When you
post-image
SNDK+11.26%
XRP-3.05%
$NVDA — I’m Watching This Breakout 👀🔥
NVIDIA is holding up well after the recent move, but there’s one level I really want to see buyers take back:
$230.
That’s the door.
If NVDA breaks above $230 with good volume and holds the breakout, I’d be looking for:
🎯 TP1: $236
🎯 TP2: $242
🎯 TP3: $250
My trade plan:
🟢 Entry: $221 – $225
🛑 SL: $214.50
I don’t want to chase a huge green candle. Give me either a clean entry around the current zone or a confirmed $230 breakout.
The level I don’t want to see lost is $215. If that breaks decisively, I’m out — no arguing with the chart.
For me, it’s s
post-image
NVDA+0.02%
  • 2
  • 2
#HYPEBreaks88HitsNewAllTimeHigh HYPE Breaks 88, New All Time High Signals Powerful Momentum
Hyperliquid HYPE has once again captured the attention of the crypto market after breaking above the 88 level and reaching a fresh all time high. This is more than just another price milestone. It shows that buyers are still willing to step in aggressively even after a major rally, pushing HYPE into a new phase of price discovery.
When an asset reaches a new all time high, traditional resistance levels become much less useful because there is no historical price ceiling above the market. Instead, trader
HYPE-3.65%
  • 1
Load More

Join 40 M users in our growing community

⚡️ Join 40 M users in the crypto craze discussion

💬 Engage with your favorite top creators

👍 See what interests you

View More