







Share your thoughts
placeholder
Article
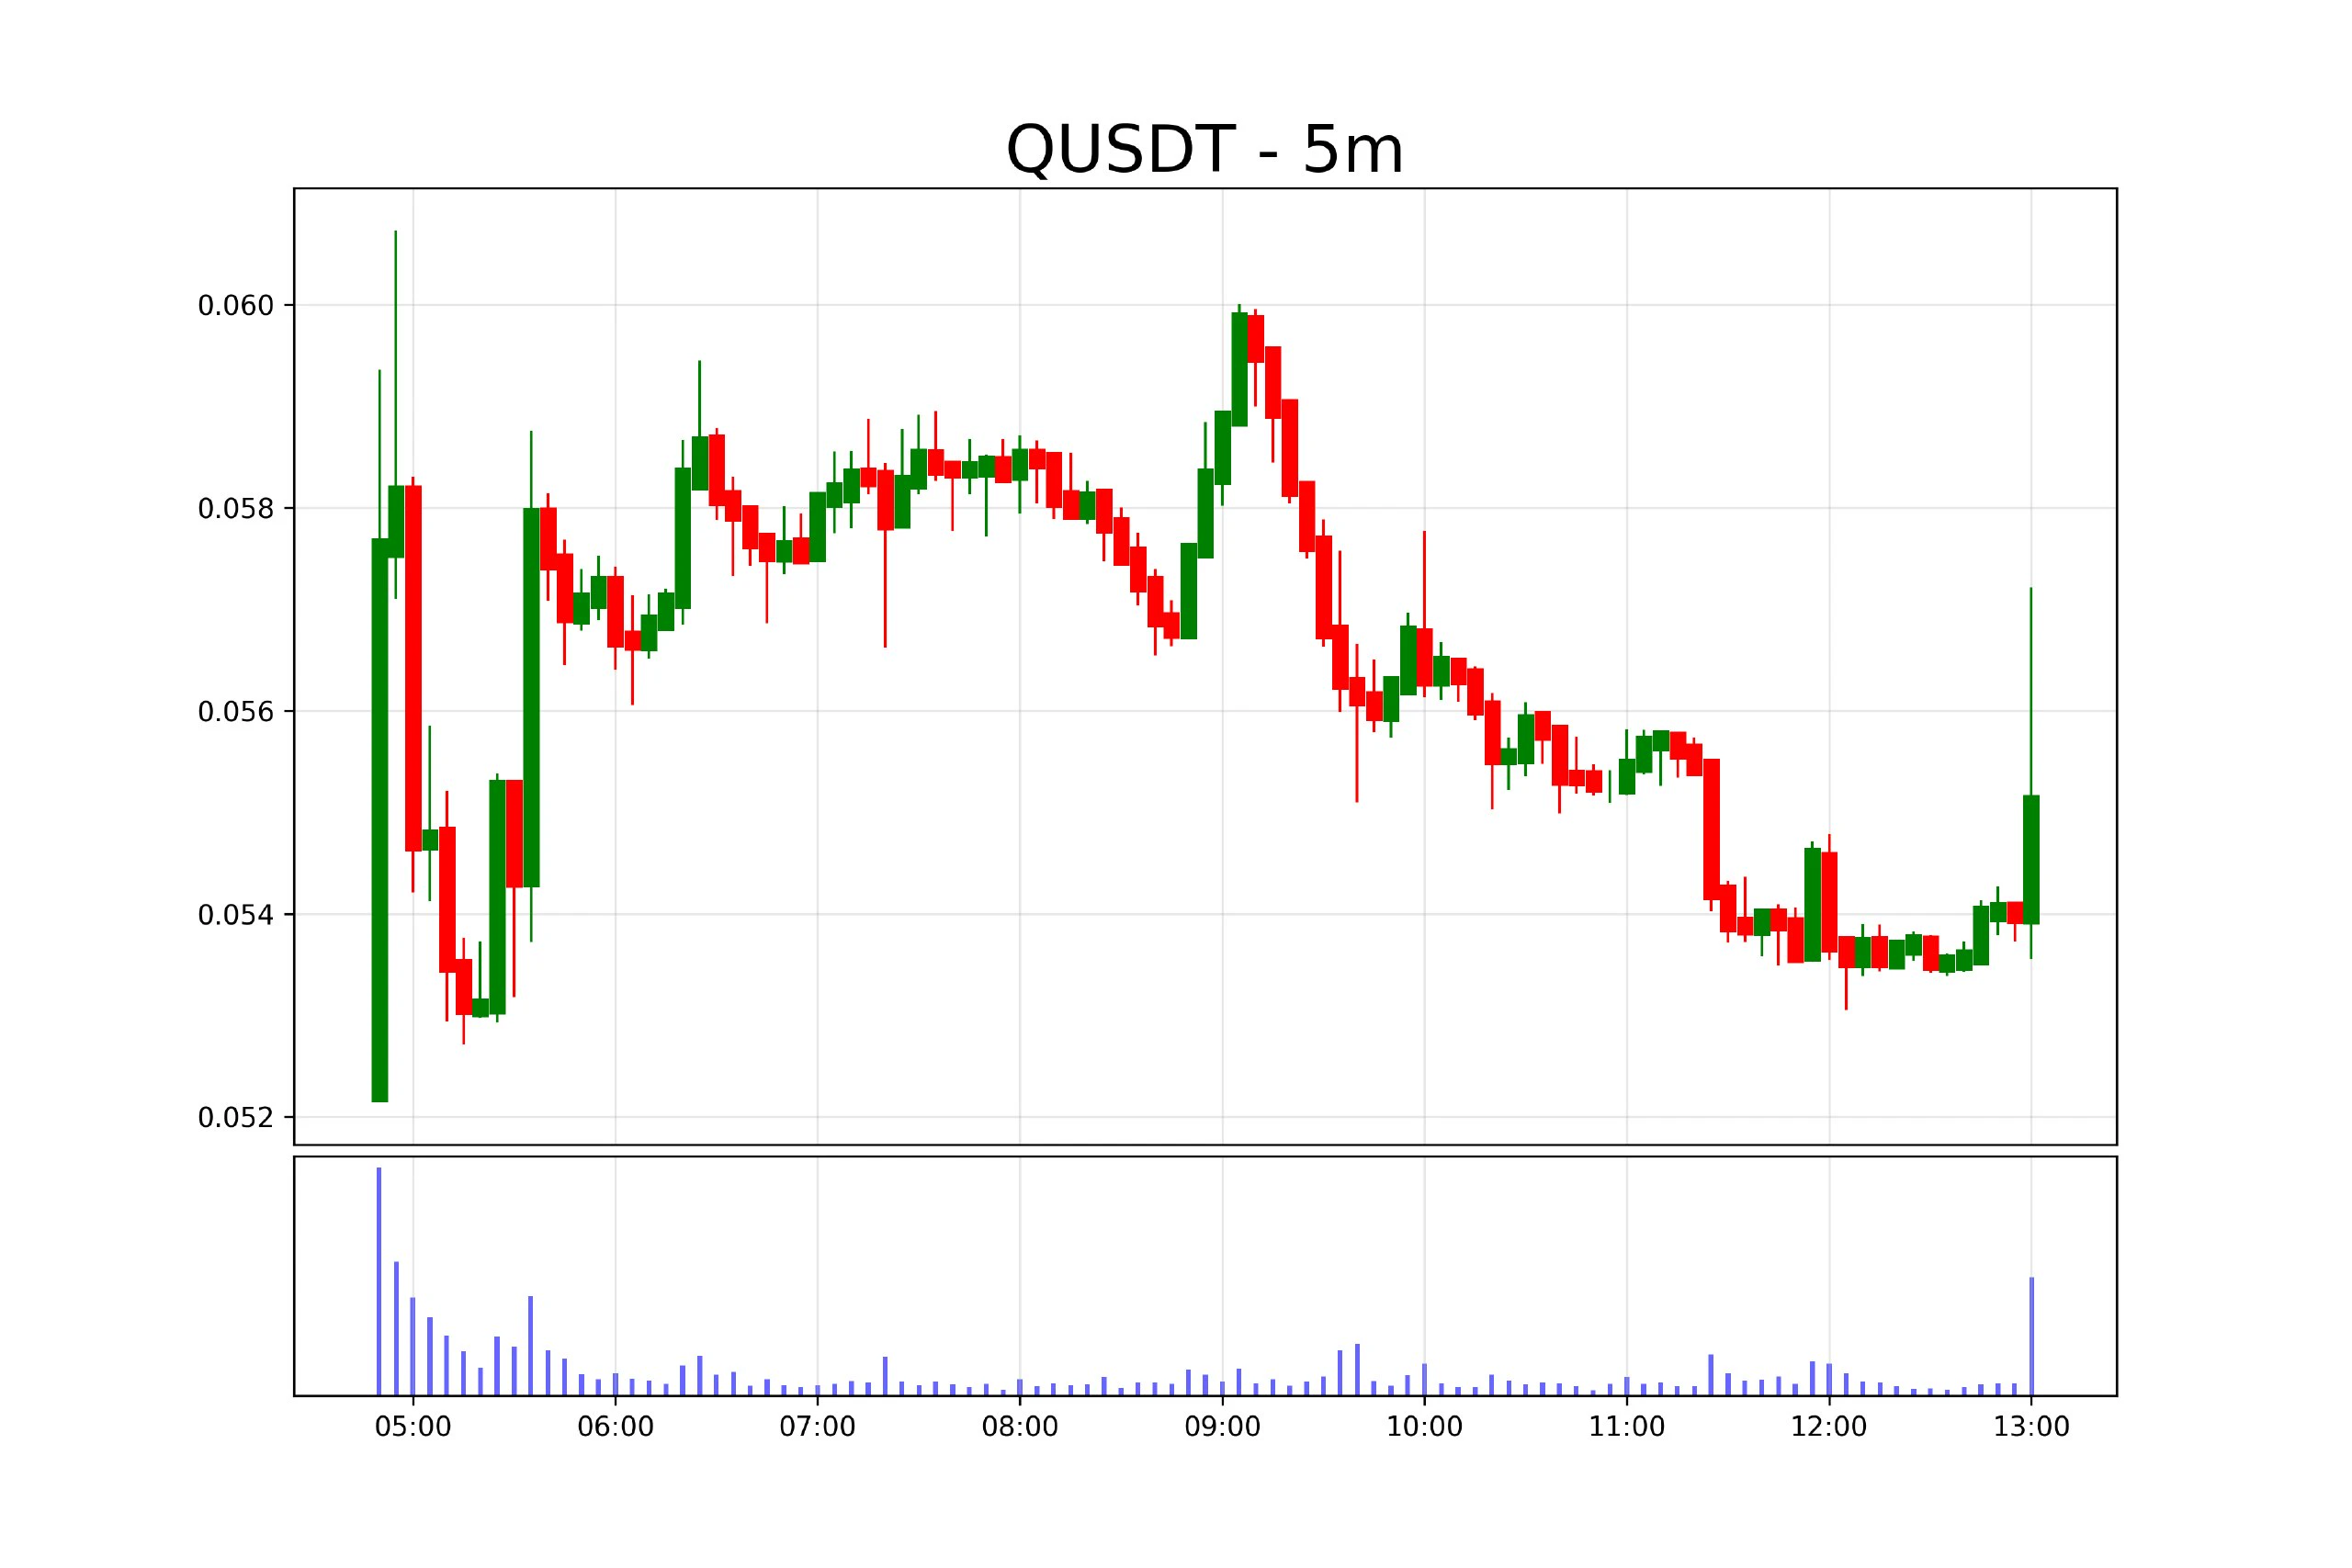
#龙虾 The market maker pumped for nothing; retail investors have all gotten wiser. 😂
post-image
龙虾+10.71%
  • 3
Brother with the address ending in 47c0d, you’ve scared me 😅. Don’t choose the third fixed-multiplier copy-trading option; choose the first asset-ratio option. I want everyone to make money, not lose money. As I previously explained, the third fixed-multiplier copy-trading option opens orders based on position value. For example, if the margin invested is only a few dozen U, opening a 500U position would lead to liquidation within minutes. Just choose the first, system-default asset-ratio copy-trading option 😅.
  • 4
$BTC is stuck in the liquidity zone.
$74K–$76K below, $80K–$82K above.
Expect more chop until one side gets swept.
#CoinDeskRevealsGateRWAPerpetualsTop3Globally
#AugustCoreCPIBeatsExpectations
#SenateReleasesNewCLARITYAct
post-image
BTC-0.74%
Live trading - Analysis crypto market
live-cover
LIVE1,882
Yesterday’s ETH strategy has already taken profit.
Those who followed Muhan’s pace have successfully secured their profits.
The market is volatile, so risk management should always come first. #CoinDesk披露GateRWA永续合约全球Top3 $ETH
post-image
ETH-2.50%
🚨 BREAKING: U.S. Bitcoin ETFs have recorded $462.73 MILLION in net outflows this week.
That marks their largest weekly outflow in the past 10 weeks.
Institutional demand for Bitcoin is showing signs of weakness as investors pull hundreds of millions of dollars from spot $BTC ETFs.
Is this the start of a bigger Bitcoin correction?
post-image
BTC+0.22%
U.S. spot $BTC ETFs have recorded three straight days of net outflows, with roughly $450 million leaving the funds between September 8 and 10.
This comes after a strong three-week period that brought about $3.8 billion into U.S. spot Bitcoin ETFs, making the recent withdrawals worth watching as a shift in short-term demand.
For me, the bigger clue is whether this becomes a longer trend or simply a short pause in institutional buying.
Broader U.S. markets have also faced pressure from rising oil prices, inflation concerns, and changing expectations around Federal Reserve policy, creating a more
post-image
BTC+0.22%
$IOTX Up 15 points in a day, but with only 2.8M in trading volume—is this a real breakout or a bull trap? First, sentiment: the Fear & Greed Index is still at 45, in the neutral-to-cold zone, while the funding rate has turned positive at 0.01%, meaning longs are starting to pay to hold positions. This is the first sign of short-term overheating. On-chain data is interesting: active addresses rose 22% over the past 24 hours, but whale holdings concentration fell 3%, a typical structure of retail buying the top while institutions distribute. Technically, 0.0029 is yesterday’s hard floor, while 0
IOTX+17.16%
supported by easing core cpi ethereum hit $2600 for for the first time in seven months
live-cover
LIVE1,885
ETF weekly net inflows reached $18.98 million, while XRP drifted lower on shrinking volume: buying the expectation, selling the reality
Good grief, the ETF really swept in $18.98 million in cash this week, yet the $XRP chart only yawned in response—the current price is 1.3436, down 2% in 24h, with volume at just 0.291 times the 30-day average. I’m bearish in the short term: the money is flowing into expectations, while the price is following reality.

One-line event summary: a data account posted that XRP ETF net inflows reached $18.98 million this week. I’ll accept half of the narrative—the
XRP-2.06%
UNI at $6.25—are you chasing it?
First, on the surface: explosive bullish news, but the price isn't rising.
Over the past 30 days, Uniswap spot trading volume reached $70.6 billion, exceeding the combined volume of the next three DEXs. On September 4, 184k UNI were burned in a single day. Arthur Hayes bought 240k UNI over the counter.
But what about the price? It dumped from 7.48 to 6.09 and is now at 6.25, moving sideways within a range.
Because the bullish news has already been priced in, while this week's FOMC and the subsidy expiration on 9/29 are two hard hurdles.
First: the burn is real,
post-image
UNI-1.48%
ETH-2.60%
BTC-0.74%
Someone revealed on Maimai
Bitmain’s 2025 year-end bonuses still haven’t been paid
post-image
#AugustCoreCPIBeatsExpectations
August inflation data has delivered an important signal for global markets, with Core CPI coming in stronger than many market participants expected. The latest reading is especially important because core inflation excludes food and energy prices, making it one of the key indicators used to understand underlying price pressures.
A hotter-than-expected Core CPI can influence expectations around interest rates, liquidity, bonds, stocks, the U.S. dollar, and ultimately the crypto market. For traders on Gate, understanding the macroeconomic backdrop is increasingly
BTC-0.74%
GM ☕️
Starting my Sunday with a coffee and a walk around my local market, remember to touch grass this weekend ☀️
post-image
As many of you already know, I'm a big fan of moving averages.
That said, in the past when $BTC closed its monthly candle above SMA9, that usually signaled the bottom of the bear market.
Any retest to the moving average in September and/or October will be a good opportunity for an entry in $BTC and #altcoins 🤝🏻
BTC-0.74%
For this batch of $MARSCOIN long positions, I’m taking profit on 70% around 0.10712. It’s not that I’m bearish, but profit-taking is starting to emerge near the previous high, trading volume hasn’t continued to expand, and holding the full position no longer offers a great risk-reward ratio.
When I entered, I was looking for a pullback and confirmation after the breakout. The key level around 0.10162 held repeatedly, and the pullback came with declining volume, so I felt comfortable going long with the structure. With a floating profit of +108% at this point, I’m locking in most of the gains
post-image
MARSCOIN-14.37%
SNDK-3.82%
BNB-2.69%
#MEUSDT
ME/USDT is showing a short-term bullish structure on the 1-hour chart. Price is around 0.0664, up about 3.75%, after pushing from the 0.0621 area toward the recent high of 0.0679.
The breakout above 0.0649 was the key move, and price is still holding above MA30 at 0.0650. MA5 is around 0.0668 and MA10 around 0.0666, so the immediate battle is happening right around the current price.
The main resistance is 0.0679–0.0684. If buyers break and hold above 0.0679, I would watch 0.0695–0.0710 as the next potential upside zone.
On the other hand, losing 0.0650 would weaken the bullish setup.
post-image
ME+3.81%
  • 2
$XAU /USDT is range-bound, but this setup screams short.

$XAU /USDT - SHORT

Trade Plan:
Entry: 4351.71 – 4353.27
SL: 4359.95
TP1: 4346.90
TP2: 4343.17
TP3: 4337.58

Why this setup?
Why now? The daily trend is range, yet the 1h ATR of 3.106912 shows enough volatility to justify a defined short trade. The 15m RSI at 40.63 confirms bearish momentum without being overextended, making the entry zone around 4352.49 a high-probability trigger. Targets are stacked logically with TP1 at 4346.90, TP2 at 4343.17, and TP3 at 4337.58, offering incremental exits as price slides. The invalidation level
XAU-0.11%
Calerto turns calendar invites into loud meeting alarms that break through Do Not Disturb.
Silent pings get buried. Sync Apple or Google Calendar, set a prep buffer, and tap Join for Zoom, Meet, or Teams when the alarm hits.
Would you trust an alarm more than a calendar ping?
Another expansion for @plumenetwork users and vault holders
$PLUME 's vaults (nALPHA, nOPAL, nBASIS, nFALCON) are all live on @AerieCapital
RWA lending on Ethereum made possible by Plume
post-image
PLUME-1.88%
RWA-1.03%
Load More

Join 40 M users in our growing community

⚡️ Join 40 M users in the crypto craze discussion

💬 Engage with your favorite top creators

👍 See what interests you