Square
Following
Hot
News
Notifications
Profile
Share your thoughts
placeholder
Article
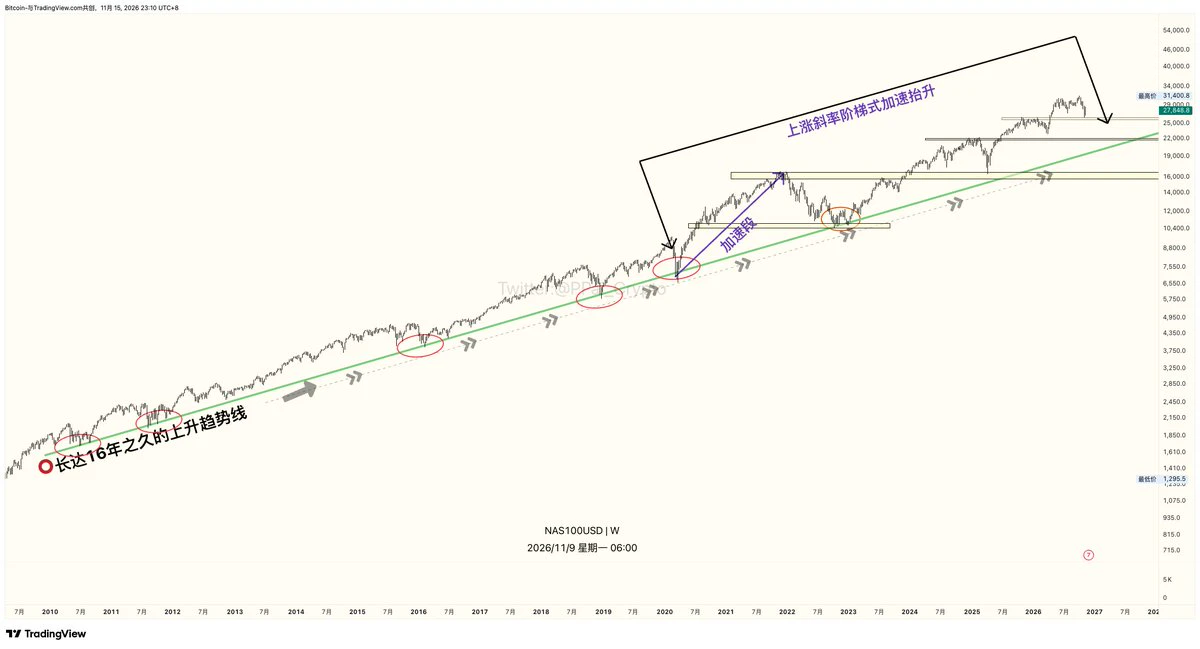
Every time I review the chart and see #NAS100,
I can’t help but exclaim: “Damn!”
It’s so beautiful it leaves me speechless, so breathtaking.
That’s why I’m always wondering
when we’ll finally get a massive bearish candle😂
That’s human nature.
But objectively speaking, it will become increasingly difficult
for the current upward slope to continue.
post-image
NAS100-0.07%
Trenches
mihao
m
bade
b
mihao
4Cxj...pump
Market Cap
$.
Change
.
24h Vol
$.
Holders
.
bill
b
bade
b
bill
85Rh...pump
Market Cap
$.
Change
.
24h Vol
$.
Holders
.
PIEVERSE
P
bade
b
PIEVERSE
0x0e...25a9
Market Cap
$.
Change
.
24h Vol
$.
Holders
.
AGT
A
bade
b
AGT
0x5d...e274
Market Cap
$.
Change
.
24h Vol
$.
Holders
.
IDOL
I
bade
b
IDOL
0x3b...ab07
Market Cap
$.
Change
.
24h Vol
$.
Holders
.
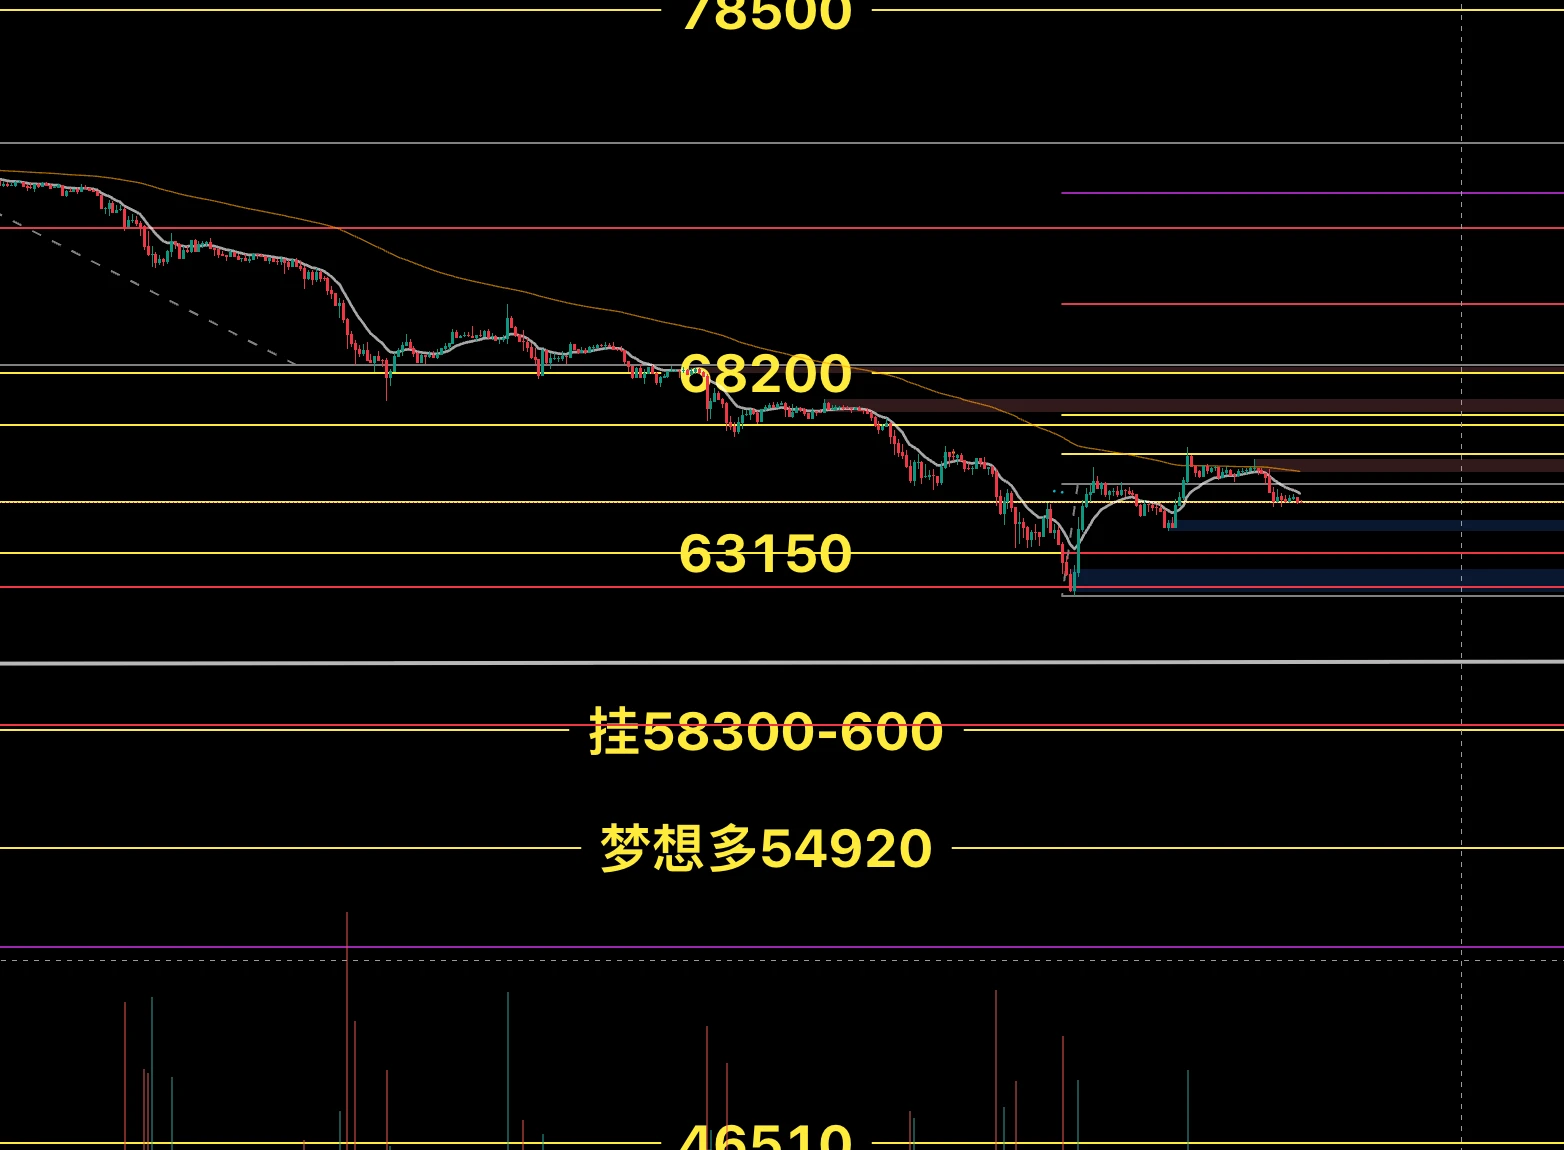
BTC overnight limit orders; core position entered yesterday at 52300 for a speculative play, targeting today + early Monday
1、63150 Bet on the bottom
2、Dream dip buy 1: 58300-600
3、Dream dip buy 2: 54925
post-image
BTC-0.67%
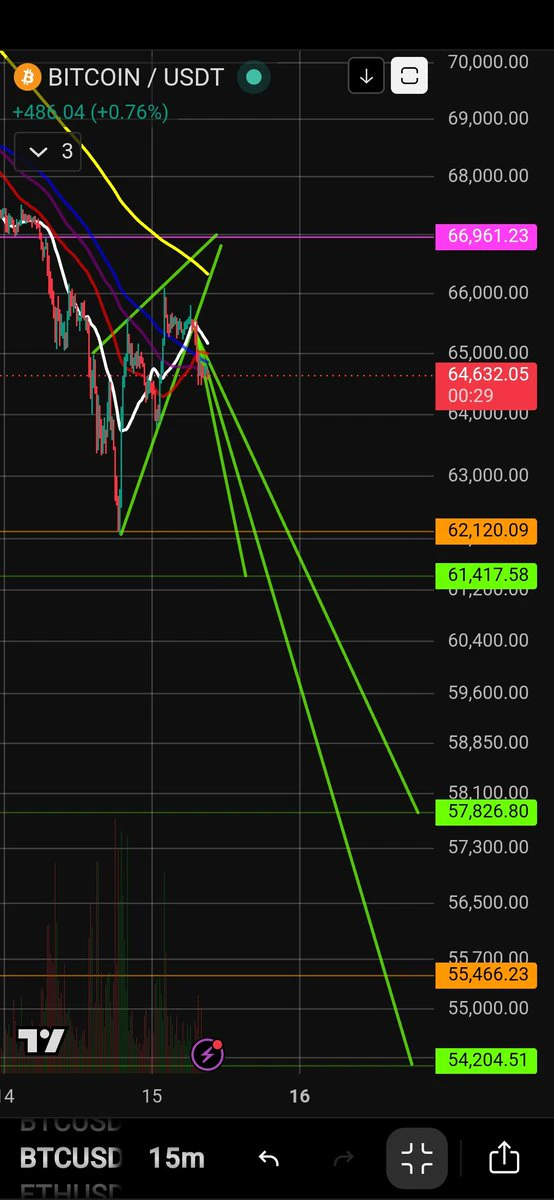
$BTC Breaking Downwards Again!? 👀
15 Min Timeframe ⏰️
$BTC green rising wedge breaking down.
May see a retest of the yellow 15min 200MA.
Watch for possible support at the bottom of the rising wedge at $62,120.
$BTC Targets 🎯
1) $62,120
2) $61,417
3) $57,826
4) $55,466
5) $54,204
NFA, DYOR ⚠️
#Crypto #Trading #BTC
post-image
BTC-0.67%
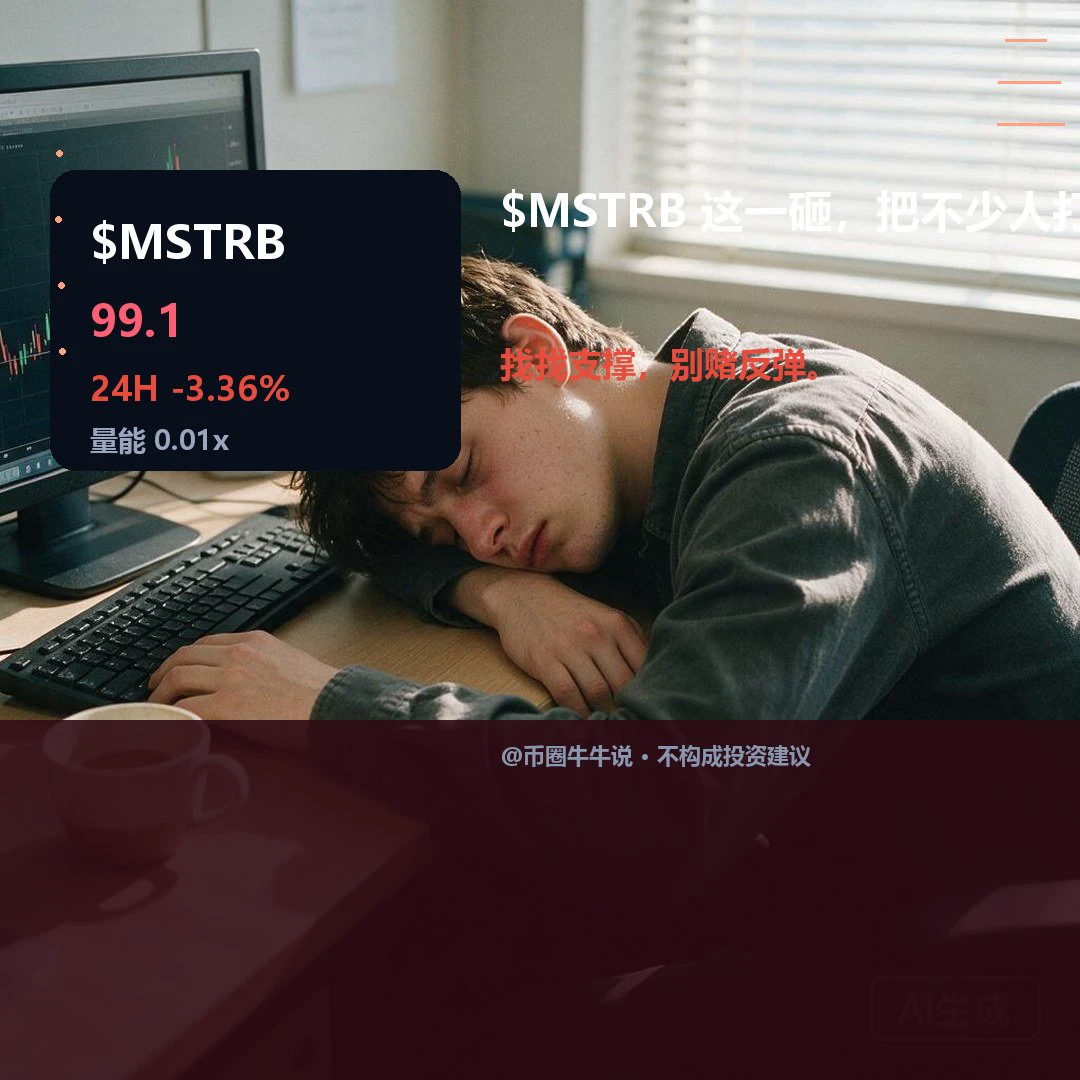
$MSTRB Currently at 99.1, down 3.36% over 24H, with an intraday range of 94.99–103.59. The 1H trend is weak, with the RSI at 41.7, while the 4H trend is also weak, with the RSI down to 24.7, showing a synchronized downward structure across both time frames. For an upside move, price needs to hold above resistance at 103.59. If it breaks below support at 94.99 and fails to reclaim it, weakness is likely to continue. In the follow-up review, focus on whether price holds above 103.59 and whether it can reclaim 94.99 after losing that level. Volume is only 0.01x, so a low-volume breakout is likely
post-image
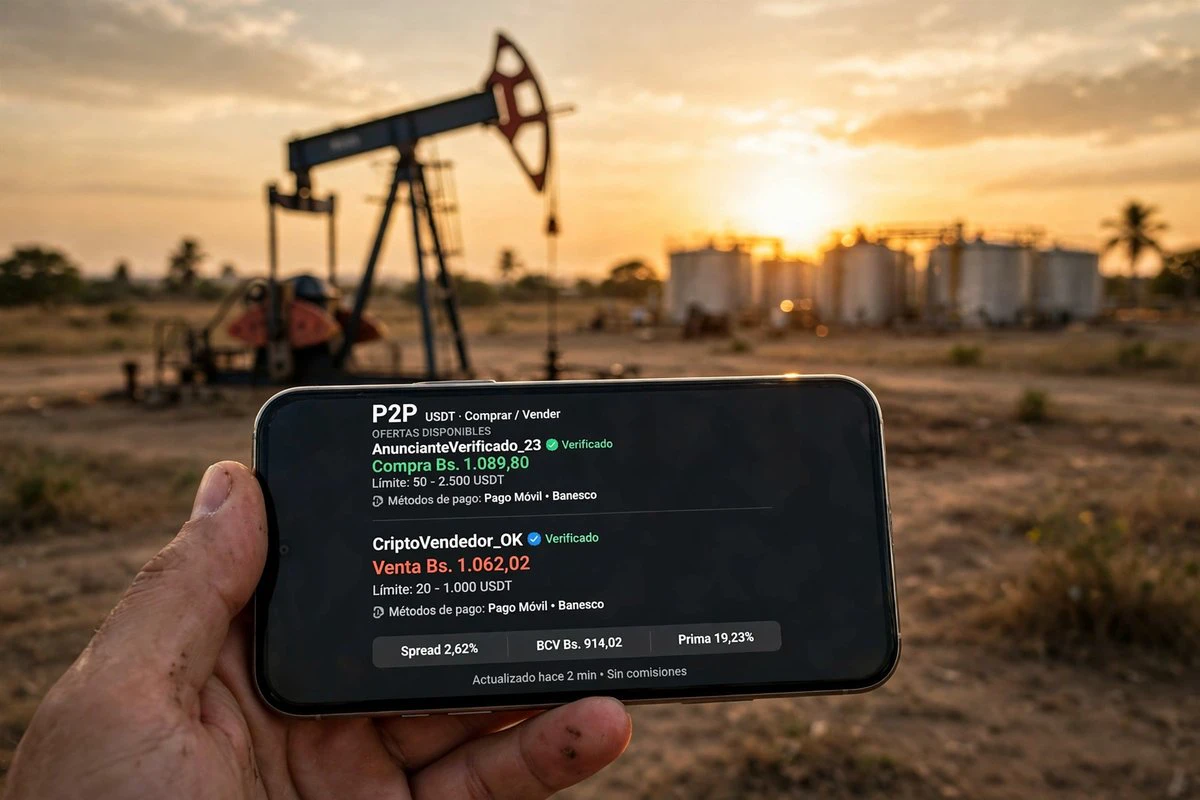
🛢️ Qatari oil company UCC is negotiating for El Furrial and Jusepín: What does this mean for the dollar and P2P?
Qatari oil company UCC Oil and Gas Holding is in talks to take over operations at two onshore fields in northern Monagas: El Furrial and Jusepín. The information, attributed to sources close to the process and reported by Bloomberg, points to a partnership with PDVSA at El Furrial, with a commitment to make a “significant investment” in infrastructure. For ordinary Venezuelans, the news may seem far removed from everyday life; for anyone buying and selling USDT every day, it’s anot
post-image
SHEL+1.28%
Shorts won on price, but lost to $BARD 's 1.649 volume ratio

$BARD plunged from 0.1287 to 0.1013, down 16.281% in 24h, and I'm bullish right at this level.

First, the volume ratio is 1.649: 24h trading volume is 2528838 USDT. Even as the price plunged, volume increased instead. Those cutting their positions have left, while buyers are still stepping in. The last three 15m volume bars were 254,460, 224,404, and 258,162, each exceeding the previous hour's average volume of 221,314.

Leverage has also been washed out, with OI at 53,418,086 USDT, down 15.8% from the early-morning snapshot. The fu
BARD-1.24%
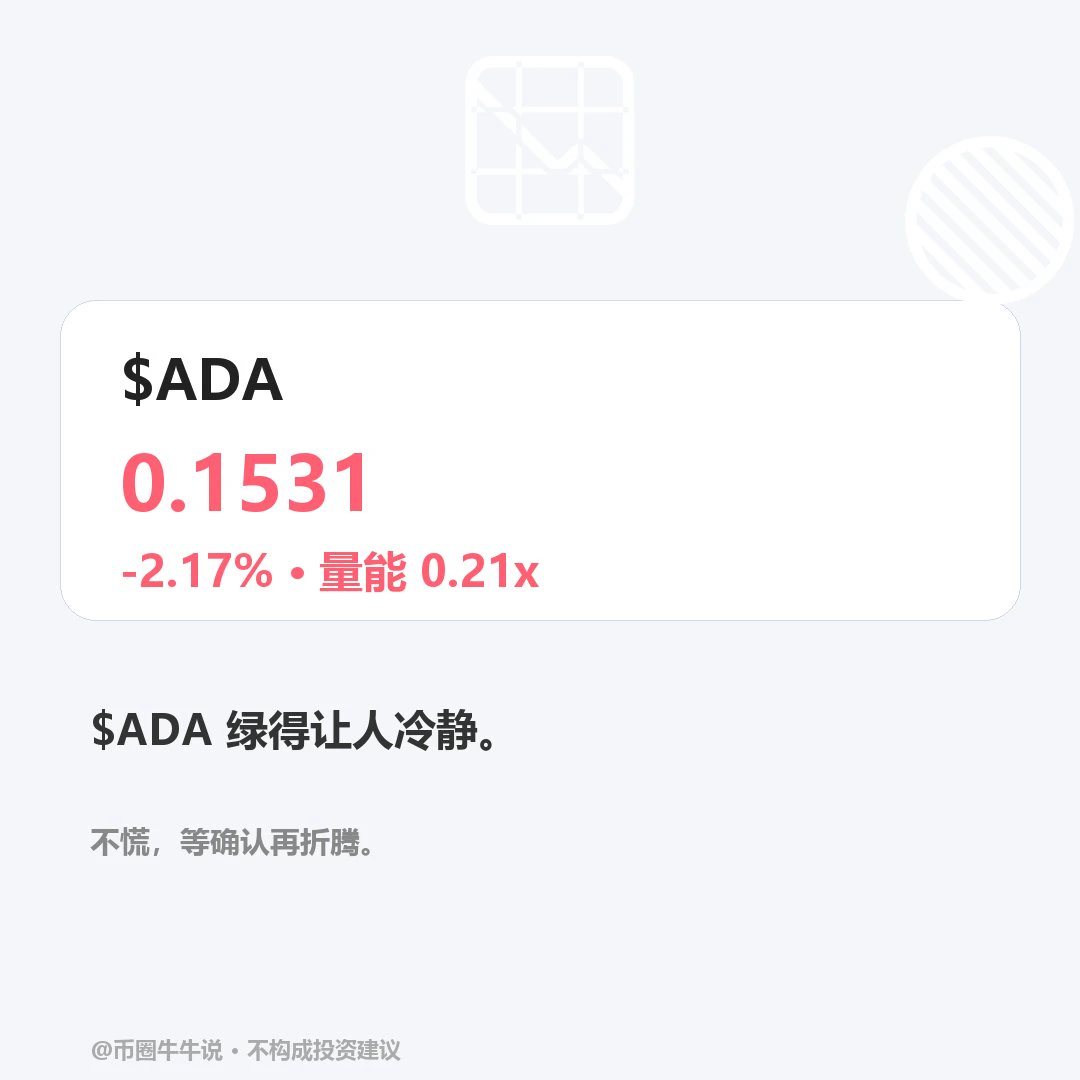
$ADA is currently at 0.1531, down 2.17% over 24H (range: 0.1426–0.158). Trends are weak on both timeframes. The 1H RSI is 76, indicating overbought conditions, but price structure remains under pressure. The 4H RSI is 26.7, indicating oversold conditions, with divergence. Resistance is at 0.1577, and support is at 0.1426. For an upside move, price needs to hold above 0.1577. If it breaks below 0.1426 and fails to reclaim it, weakness is likely to continue. In the follow-up review, check whether price holds above 0.1577 and whether it can reclaim 0.1426 after losing that level. Volume is only 0
post-image
ADA-1.48%
Two retirees with the exact same average returns can finish with radically different wealth. The one who hits big losses early (while still withdrawing) is permanently impaired; the one who hits them late is fine. Sequence of returns risk is invisible in the average yet decisive in the outcome. Order matters more than the number people usually quote.
post-image
#ShareWeekly ‌#Ethereum at $1,809.13: The Breakdown, the Oversold Signal, and Eight Tests ETH Must Pass Before a Real Recovery

Ethereum is approaching a critical technical zone, but the important question is no longer simply how far it has fallen. It is whether selling pressure is finally losing control or whether the market is preparing for another leg lower.

At the supplied price of $1,809.13, ETH is trading far below its major daily moving averages. Momentum indicators show significant weakness, derivatives data reveal heavy long liquidations, and recent ETF flows point to institutional
post-image
Across all my stock accounts the total pull back from the ATH on 4th October, just over a month ago, is around £270k
Or to put it another way, almost all gains in the stock market for the year has been wiped out in 30 days 🤣😬
post-image
$BTC .D Bitcoin Dominance Falling
$OTHERS.D Altcoin Dominance Is Rising
$USDT.D Stable Currency Dominance Is Falling
post-image
BTC-0.67%
STABLE-1.39%
#ETHBrieflyFallsBelow2000
Ethereum Price Analysis: ETH Reclaims $1,800, but the Recovery Still Needs Confirmation

Ethereum is attempting to regain its footing after an aggressive sell-off pushed the market toward $1,710. With ETH now trading around $1,813, buyers have managed to recover part of the decline, but the broader structure remains under pressure. The important development is not simply that price has moved back above $1,800. It is whether buyers can defend that level and build enough momentum to challenge the next resistance zones.

The Market Is Stabilizing, Not Yet Reversing

ETH
ETH-1.26%
BTC-0.67%
Good night, get up early tomorrow and give it your all! $XAUUSD
post-image
XAUUSD+0.00%
A whale adds to long positions whenever ZEC falls; 5x leveraged position loses $3.5 million
live-cover
LIVE1,391
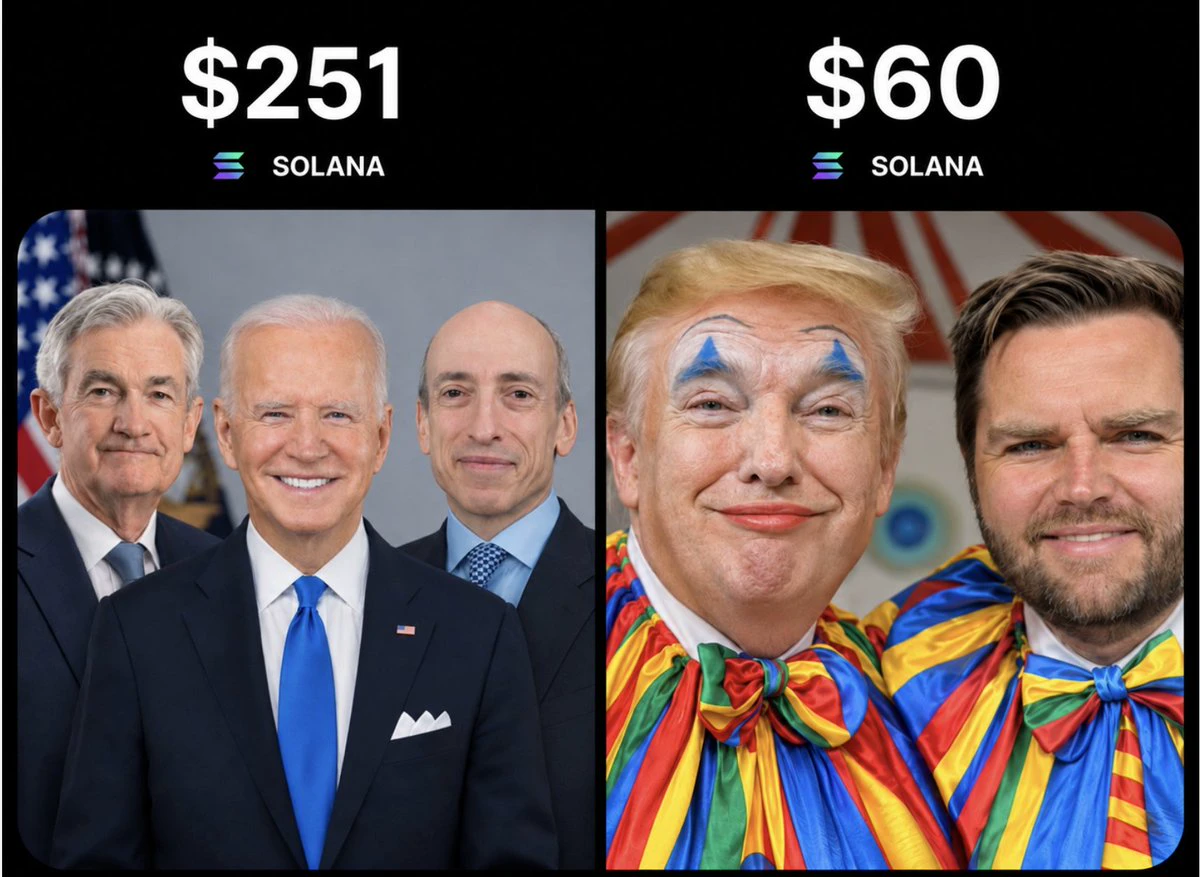
We appreciate you, Mr. Crypto President! 😂
post-image
$JCT My order at 0.0019 didn't fill, and I watched it climb all the way to 0.0028.

Reviewing this trade: Yesterday afternoon, I noticed $JCT trading sideways on declining volume around 0.0019, so I placed a buy-the-dip order. But overnight, it broke out on a surge in volume, with 24h trading volume hitting 147.9M and a gain of 18.72%. My order missed by one tick. I’d be lying if I said it didn’t sting, but discipline is discipline—if it doesn’t hit my price, it doesn’t hit my price. Chasing is not part of my plan.

The price is now 0.0023, already 12% above the 24h low. I won’t chase at this
  • 2
A whale adds to long positions whenever ZEC falls; 5x leveraged position loses $3.5 million
live-cover
LIVE1,733
#比特币跌破7万美元 #WCTCS9 Bitcoin in 2026: A Mid-Cycle Pullback Held Down by Macro Factors, Not the Start of a New Bear Market

I. Where things stand: down about 47% from the cycle peak, with short-term holders capitulating
As of mid-November 2026, Bitcoin is trading near $66,800. The cycle peak in October 2025 was $126,208, followed by a washout that briefly took the price down to $57,758. The current price is in the middle ground of a “deep drawdown without breaking below the previous low.”
One key structural signal is that Bitcoin has traded below the short-term holder realized price of $75,429 fo
BTC-0.67%
Load More

Join 40 M users in our growing community

⚡️ Join 40 M users in the crypto craze discussion

💬 Engage with your favorite top creators

👍 See what interests you

Trending Topics

GateIPOAccessAnthropic

359.4K Views2.7K Discussing

Gate IPO Access Phase 3 features Anthropic (ANT), with USDT subscription interest starting from 100 USDT. Successful allocations will be delivered as real shares to Gate Stock Accounts. Indicative price: $70–$78/share Subscription: Nov 12–17 (UTC+8) Allocation is not guaranteed. Please manage risk accordingly.

Dr.HanOxfordUnionSpeech

152.1K Views514 Discussing

USOctoberPPIBelowExpectations

485.7K Views1.5K Discussing

View More