

Square
Following
Hot
News
Notifications
Profile
Share your thoughts
placeholder
Article
HOT HOT HOT 🚨🚨🚨$NAORIS continues its strong rally, with steady momentum—riding the Long wave is pretty nice.$PIEVERSE is pumping strongly again with an Alpha reward; tagging along on the Long wave for a bit is still good.$VVV continues to soar; I’ll hop aboard the Long wave for a bit.📈📈📈
post-image
NAORIS+0.66%
PIEVERSE+0.58%
VVV+0.37%
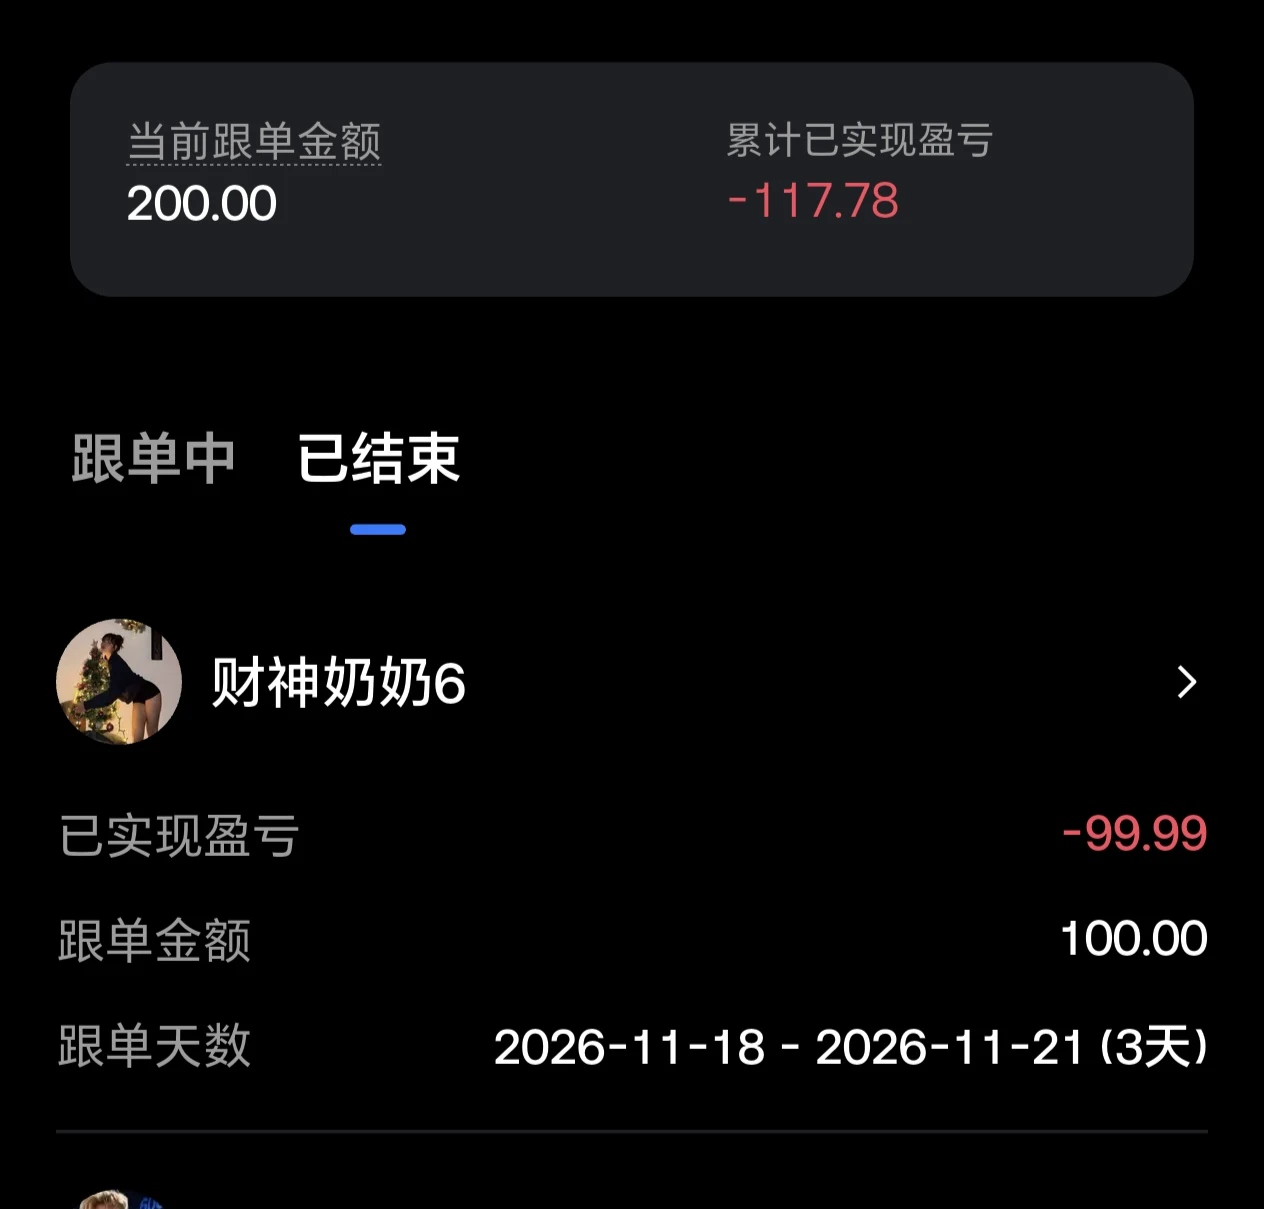
The shady trading signal provider Caishen Nainai 6 blew it all in two days🤬🤬🤬
post-image
  • 1
Trenches
IDOL
I
bade
b
IDOL
0x3b...ab07
Market Cap
$.
Change
.
24h Vol
$.
Holders
.
PIEVERSE
P
bade
b
PIEVERSE
0x0e...25a9
Market Cap
$.
Change
.
24h Vol
$.
Holders
.
FIONA
F
bade
b
FIONA
B34n...pump
Market Cap
$.
Change
.
24h Vol
$.
Holders
.
Singularity
S
bade
b
Singularity
7R4M...pump
Market Cap
$.
Change
.
24h Vol
$.
Holders
.
CLAUDIA
C
bade
b
CLAUDIA
2j5S...W2ZM
Market Cap
$.
Change
.
24h Vol
$.
Holders
.
Short-term view on $BTC and U.S. stocks: Bitcoin’s realized price is at $53,000, and the long-term holder cost basis is $48,000. This crash took it from $87,000 to $55,000, a drop of $32,000 already. Even if it falls another $10,000, averaging down means you still wouldn’t be at a loss if it rebounds to $60,000. Bitcoin’s 3-day and 5-day moving averages and weekly KDJ are all already negative, so a rebound could happen at any moment. Wait for a Fibonacci retracement bounce before considering shorting. Given the current market, BTC is only one wave away from completing its seven-wave pattern o
post-image
BTC-0.67%
NAS100-0.07%
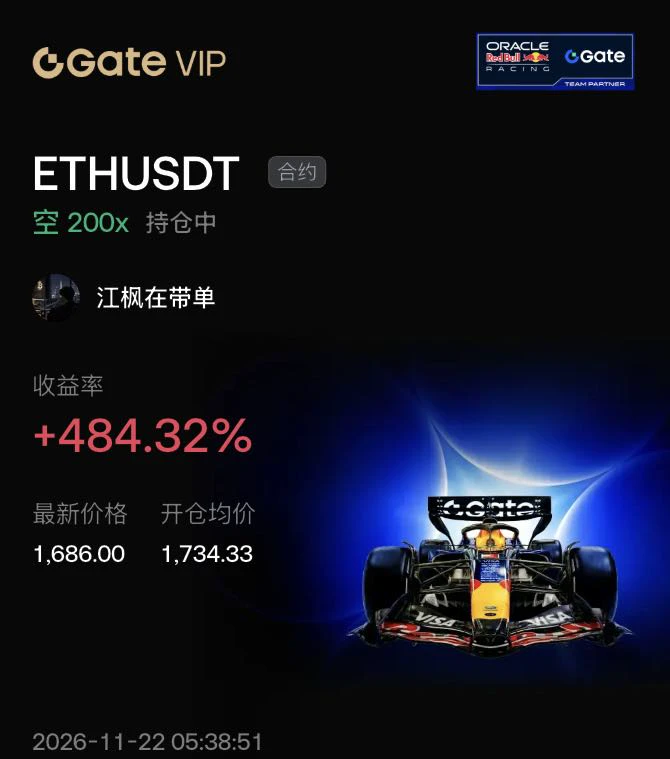
$ETH This Ethereum bounce has eaten away more than half the unrealized profit on this trade.

Early in the morning, it fell to 1578, and the unrealized profit was still over 1,300%; now, at 1686, it’s down to just 484%. The price has only risen 5%, but the return has dropped by more than 800 points—that’s how 200x leverage works.

The bounce isn’t surprising. After falling more than 7% in a day and breaking below 1600 for the first time, shorts are taking profits, while dip buyers are coming in to test the waters. With more than 400 million worth of long positions liquidated, the downward pres
post-image
ETH-1.23%
BTC-0.65%
  • 1
#CookBacksFurtherRateHikes
The Fed's Hawkish Warning Could Change the Entire Market Outlook: Bitcoin, Tech Stocks and Gold Face a New Challenge

The Federal Reserve's inflation battle is entering another critical phase, and the latest comments from Governor Lisa Cook have introduced a fresh source of uncertainty across global financial markets.

On November 20, Cook questioned whether September's 25-basis-point rate increase would be sufficient to bring inflation under control. Her warning was particularly important because she highlighted the potential consequences of delaying further action
post-image
BTC-0.65%
MU-13.88%
ANT-8.68%
  • 2
  • 1
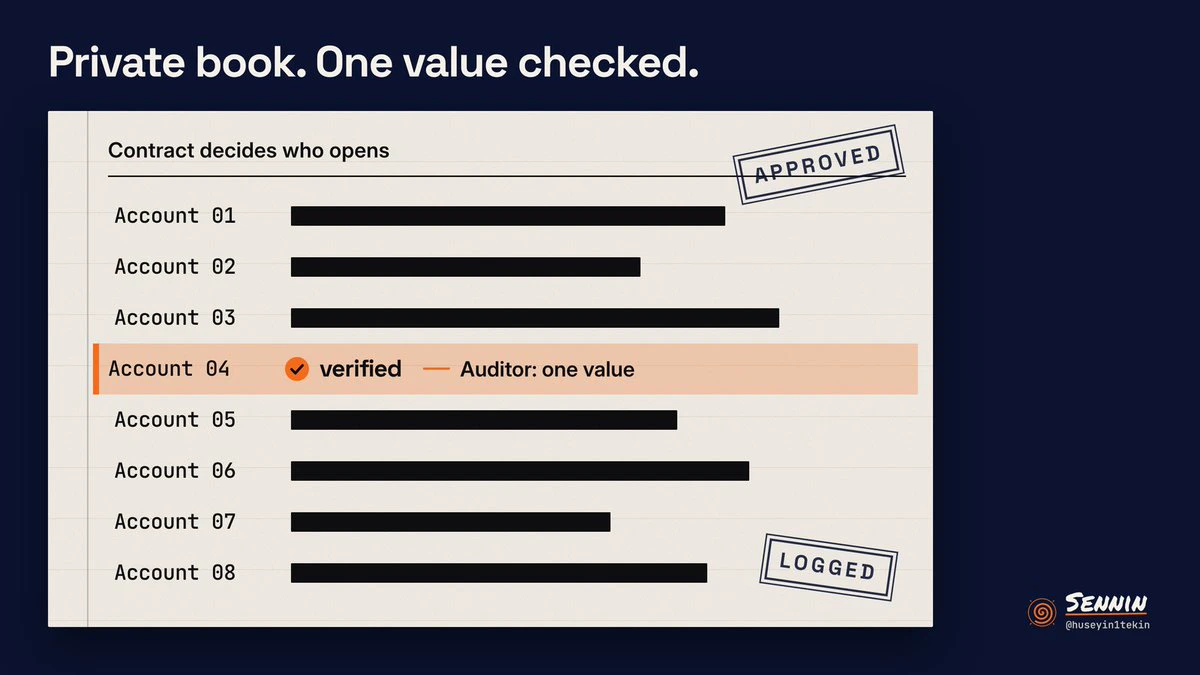
Read through the Primus FHE docs tonight.
Balances and amounts stay encrypted onchain. The contract decides who can open each value, and every opening has to be approved and recorded. So an auditor can check one number without the whole book going public.
They mention it for payroll and treasuries.
I still want to see that record of who opened what. For now decryption runs through a TEE-protected service, with threshold MPC planned later.
post-image
FHE-3.50%
Fear Grips Global Markets as Wall Street Approaches a Critical Point
live-cover
LIVE26
BTC-0.67%
ETH-1.26%
USDC+0.01%
XRP-1.15%
$TAO Short thesis update: 186 is a resistance zone on the 4-hour chart. Price has already hit my take-profit target, so I’m watching closely now. If a 4-hour candle closes above 189, I’ll abandon the bearish view.
The current 4-hour price is 185, below the EMA50 (193), and bears still control the momentum. The stop-loss distance is about 1.8%, with 2.9% room to the third target. If TP3 is reached, the risk-reward ratio would be around 1.6R.
Short entry range: 185.2–185.6. Staggered targets: 183.4 → 182.1 → 180.1. Structural invalidation: 188.7
Where would you place your stop loss? This is not
post-image
TAO+0.41%
Nvidia just lost nearly $900 BILLION in one week.
And Nvidia-backed funding rounds account for 27.2% of global venture deal value this year.
It sells AI chips, funds the companies buying them, and owns stakes in their success. That's a dangerous amount of the AI economy tied to one company.
When Nvidia cracks, how much of the AI boom cracks with it?
NVDA-13.84%
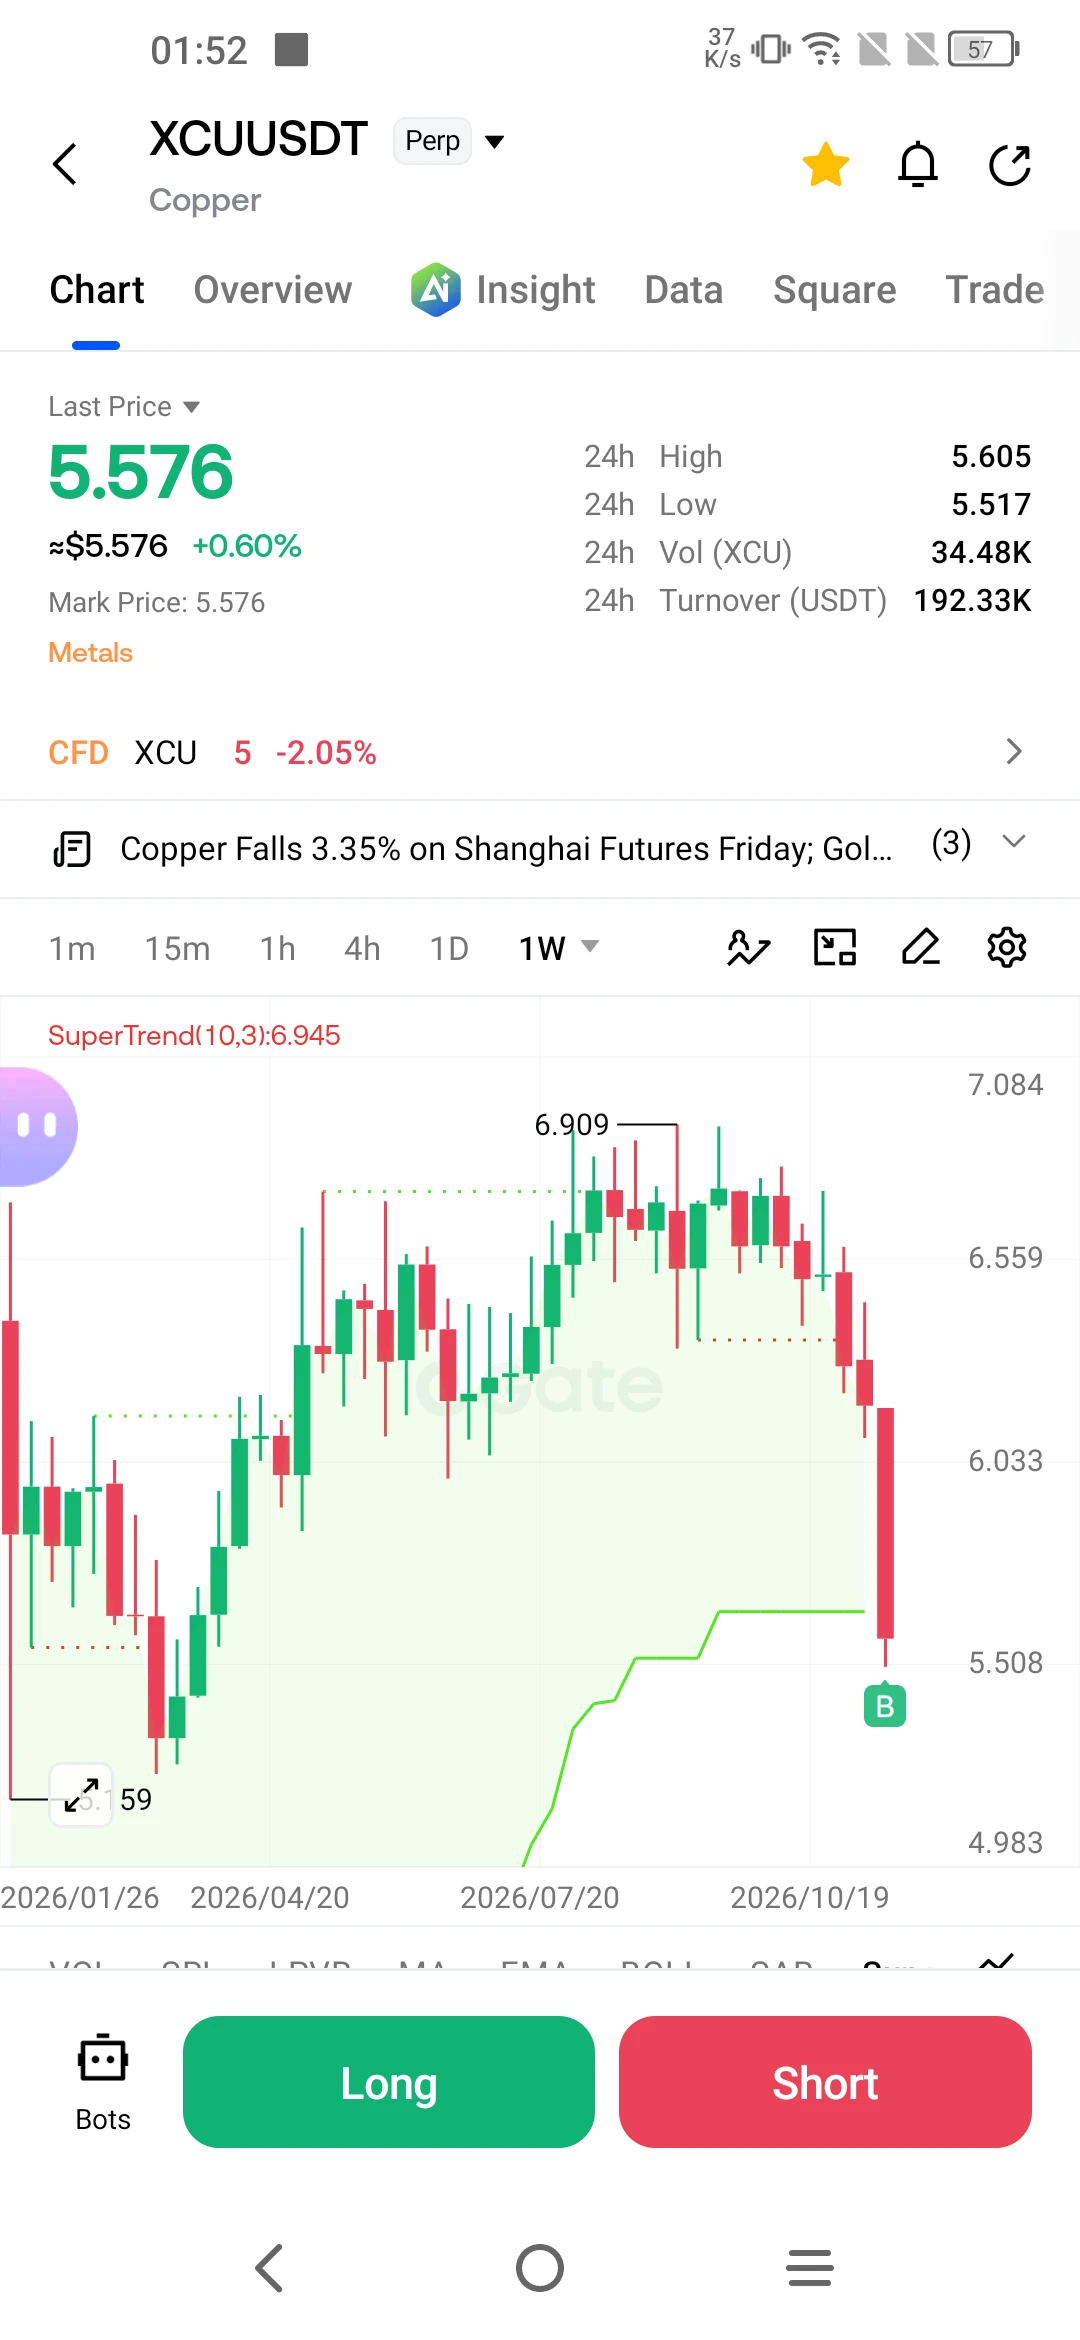
$XCU ‌
The copper market is being shaken with a speed and intensity not seen in a long time. Futures have shed more than 9% this week, marking their worst weekly performance since 2026. As clearly illustrated on the chart, prices have retreated from a peak of $6,909 to the $5,500 range. Having hit record highs in September—driven by expectations of massive demand for cabling for artificial intelligence (AI) data centers—prices are now under severe pressure as that same narrative unravels.

So, what lies behind this sudden collapse? In essence, the market is repricing the AI story, with overly
post-image
XCU+0.20%
  • 4
  • 1
#NvidiaDropsNearly14Percent

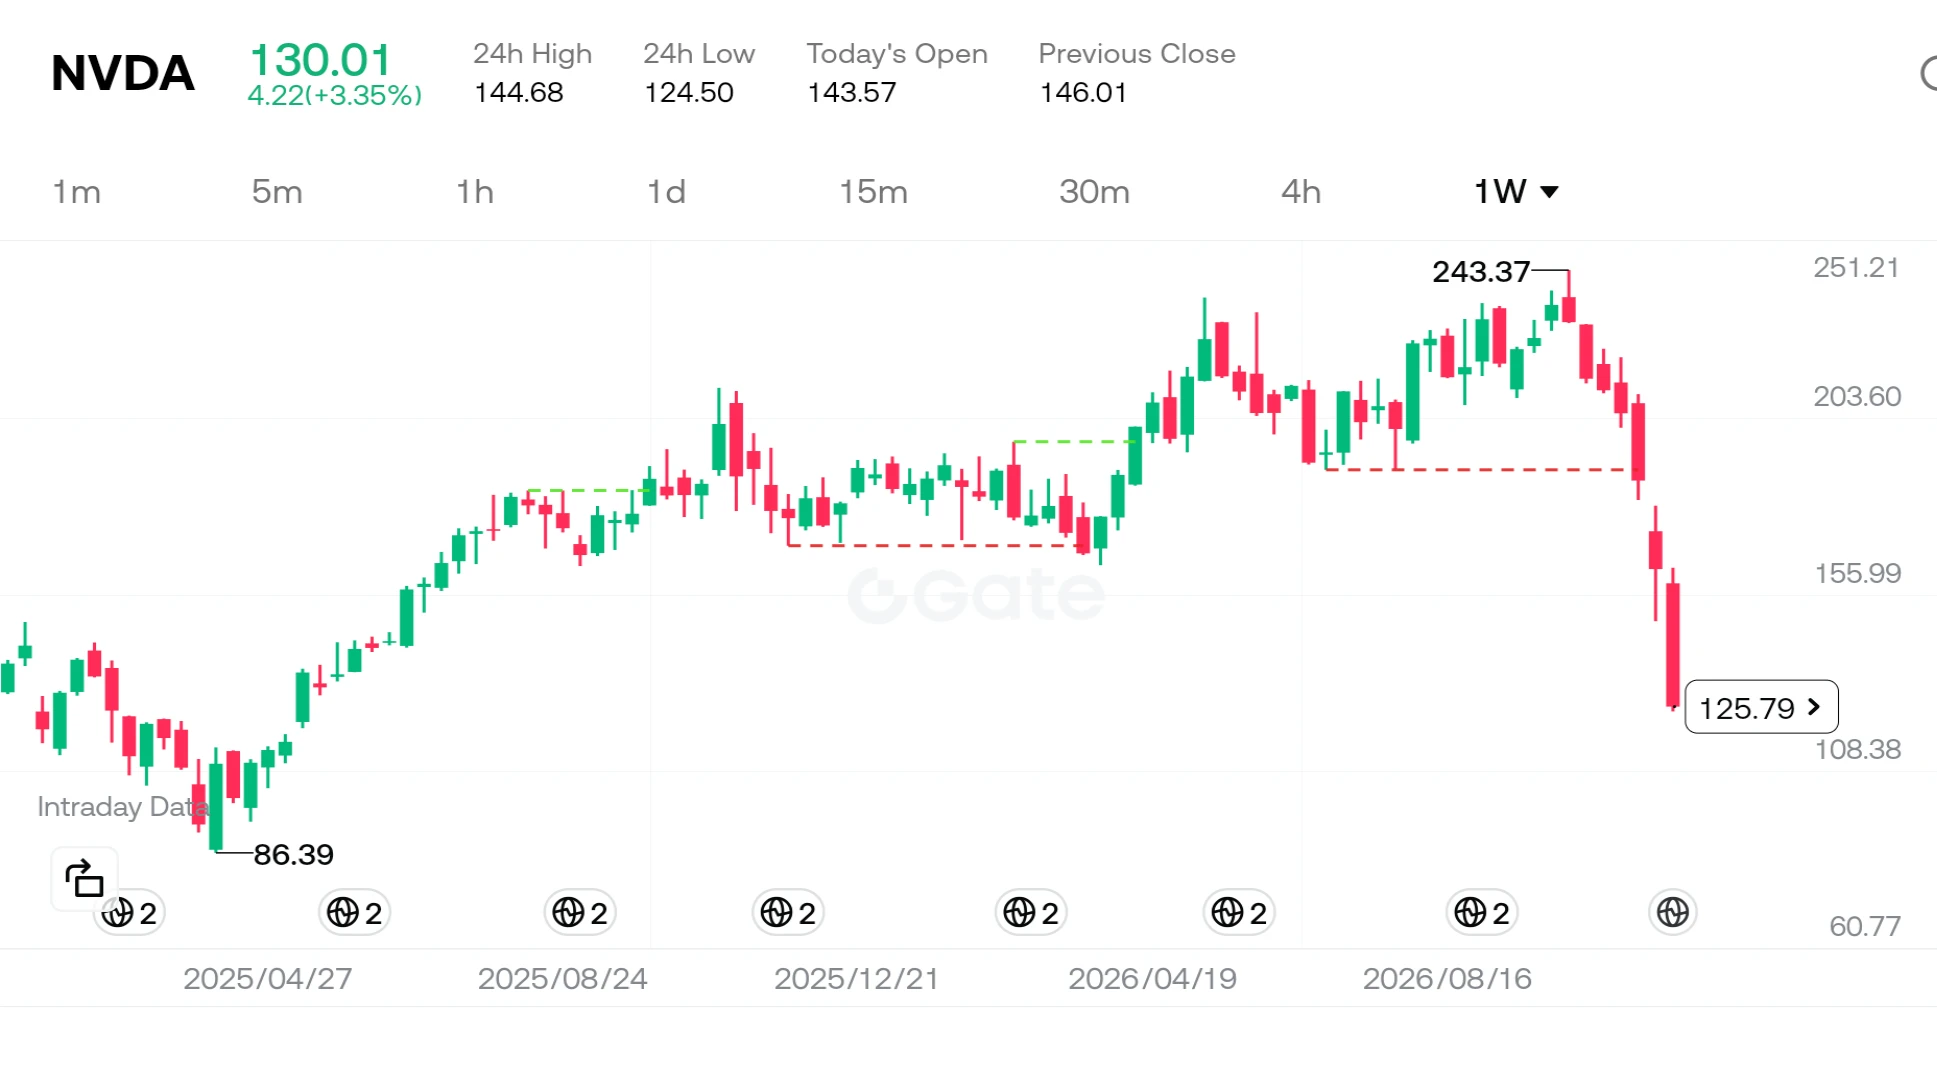
Nvidia shares fell 14%, losing $491 billion in value
Nvidia shares closed Friday down 14.01% at $125.53. News that the SEC is reviewing its accounting practices and selloffs spreading across AI stocks led to a loss of approximately $491 billion in the company's market value in a single day.
The selloff was not limited to Nvidia
Double-digit losses were also seen in semiconductor companies such as AMD and Broadcom during Friday's session. The sharp decline in the Nasdaq showed how vulnerable stocks tied to the AI theme have become to shared risks. Therefore, interp
post-image
NVDA-13.84%
AMD-13.27%
AVGO-12.23%
NDAQ-0.95%
$VVV is showing a clear recovery, with short-term buying becoming active again.
My long setup: entry range at .1206–$24.3940, target at $25.7609, stop at 23.0271
From the chart, as long as $VVV holds 23.7110, the bullish structure will remain intact; a break above 24.5190 could open the way for a further move toward 27.1278.
$VVV SOL AKE
Risk warning: The above reflects only my personal market view and is not investment advice. Contract trading is highly volatile, so be sure to manage position sizes and stop losses.
post-image
24
2424
Pump.Fun
MC:$3.14KHolders:2
26.19%
VVV+0.37%
Driven by active trading volume, price action continues to edge higher; despite limited overall market participation, resistance remains intact. The uptrend is showing initial momentum, but the indicators have yet to fully align, suggesting the move may stall. $AKE — Long entry: 0.005343 Take-profit 1: 0.005401 Take-profit 2: 0.005450 Stop-loss: 0.005129
post-image
AKE+6.07%
Recently, $XAU gold has been plunging day after day. The main reason is that renewed expectations of Fed rate hikes have pushed up real interest rates, compounded by concentrated profit-taking at previous highs and a synchronized selloff triggered by cross-market liquidity stress.
Specifically, three key factors are at play:
1. Main driver: Reversal in rate hike expectations and soaring real interest rates
This was the most direct trigger for the gold price collapse. The market had widely bet that the Fed would cut rates, but recent U.S. inflation data, such as October CPI, has repeatedly com
XAU+0.38%
AKE+6.39%
  • 1
BTC markets predictions
live-cover
LIVE1,839
BTC-0.67%
JUST IN: 🇮🇷 🇺🇸 Iran says it will reopen the Strait of Hormuz if President Trump agrees to make a deal.
Price on MAGMA continues to edge upward on noticeably subdued turnover. Quiet advances like this often struggle to carry through once they test heavier overhead supply.$MAGMA — LONGEntry: 0.2543TP1: 0.2569TP2: 0.2594Stop: 0.2441
post-image
MAGMA-0.57%
  • 1
$NVDA ‌
Nvidia has been losing ground for seven consecutive weeks—a trend not seen since 2008. The stock plummeted 14% last Friday alone, bringing its total decline over this seven-week period to approximately 46%. As clearly illustrated on the chart, the price has retreated from a peak of $243 to the $125 range. So, what is the story behind how this once-most-valuable company reached this point?

In reality, this is not merely a stock market correction; it is the result of three major, intersecting storms hitting the same vessel.

First, let’s look at the company’s internal dynamics. Uncerta
post-image
NVDA-13.84%
  • 6
  • 2
Open a short position on $SUI . Trade setup: Entry 0.6459 - 0.6491, targets 0.6160 and 0.591, stop loss 0.6686. SUI failed to reclaim local moving-average resistance; price is expected to quickly move lower and retest support below. Note: A strong 1-hour rebound trend could invalidate this short if price reclaims 0.6500. Don't go all in, bro. Position size should suit your own account.
post-image
SUI-1.05%
XRP Technical Outlook: Bearish Pressure Continues as Price Tests $0.93 Support

XRP is trading around $0.9364 after another strong bearish move on the daily chart. Price has broken below the previous support structure and is trading beneath all four major EMAs. Sellers remain in control, while the $0.8619 area is now an important support zone to watch.

EMA Structure

XRP is trading below all major moving averages, confirming a bearish market structure.

- 20 EMA: $1.0502
- 50 EMA: $1.1777
- 100 EMA: $1.2374
- 200 EMA: $1.3108

The 20 EMA remains below the 50, 100, and 200 EMAs. This alignment
XRP-1.12%
Load More

Join 40 M users in our growing community

⚡️ Join 40 M users in the crypto craze discussion

💬 Engage with your favorite top creators

👍 See what interests you

Trending Topics

BTCBreaksBelow60K

2.1M Views30K Discussing

BTC fell below $60,000 on November 20 for the first time since July, alongside a tech stock selloff and broader pressure on risk assets. Will $60K become resistance, or can BTC quickly reclaim it? What price or volume signals would convince you that selling pressure is easing?

GateDirectIPOPhase3ANTAllocates92100Shares

797.2K Views4.9K Discussing

NvidiaDropsNearly14Percent

333.9K Views7.6K Discussing

View More