




Share your thoughts
placeholder
Article
$SOL Signal】4H Death Cross, Short the Rebound
$SOL 4H MACD death cross, 1H rebound lacks momentum, and the price repeatedly tested around 102.08 without success. Bid depth imbalance -6.96%, with sell pressure dominating the order book.
🎯Direction: Short
⚡Entry/Pending Order: 101.495-101.800 Short directly when the rebound reaches the lower boundary of the range
🛑Stop-loss: 102.818
🚀Target 1: 100.273
🚀Target 2: 99.510
🛡️Trade Management:
- Take 50% off at Target 1 and move the stop-loss up to breakeven. - If the price falls back to the entry level, exit automatically to protect principal.
post-image
SOL-2.20%
BTC-1.91%
Pullbacks in a bull market can be just as damaging. BTC surged to 82282 before falling back to 79500, with the market directly entering a tug-of-war between bulls and bears.
The long-term moving averages are still trending upward, so the uptrend has not been directly declared over, but the short-term trend has clearly weakened. The MACD red bars on the 2-hour chart continue to contract, indicating fading bullish momentum; a large bearish candle on the 15-minute chart sent prices plunging, with all moving averages turning into resistance, making rebounds vulnerable to selling pressure. Those wh
post-image
BTC-1.93%
Yesterday,
Trump,
those three words were a traffic sensation😎
post-image
Everyone’s fading ONDO at 0.3724—but the 4h tape just whispered something they can’t hear.

$ONDO /USDT - LONG

Trade Plan:
Entry: 0.3713 – 0.3735
SL: 0.3618
TP1: 0.3804
TP2: 0.3857
TP3: 0.3937

Why this setup?
Why now? The 1D trend is bullish, and the 4h structure is armed LONG with 95% confidence.
- Entry ref 0.3724, with a tight low at 0.3713—buyers are defending this zone.
- TP1 at 0.3804 (+2.1%), TP2 at 0.3857 (+3.5%), TP3 at 0.3937 (+5.7%).
- RSI 15m at 75 is hot, but ATR 1h (0.0044) shows low volatility—so a squeeze is loading.
- Invalidation is far at 0.3515; the risk/reward
ONDO+1.84%
9.5 BTC Market Trend: Silk Road Analysis
Long: If the pullback holds above 79100‑79300, enter a small long position
First target: 79700‑79800; if it breaks through, look toward 80500
Defensive stop-loss: 78700
Short: If the rebound reaches 79800‑80000 but meets resistance and fails to rise further, enter a small short position
First target: 79400‑79200; if it breaks down, look toward 78800
Defensive stop-loss: above 80300
Range-bound shakeout market; avoid chasing rises or selling into declines
The current market is in a repetitive range-bound pattern, with opportunities for bo
post-image
BTC-1.93%
ETH-2.61%
[New Streamer]new update
live-cover
LIVE1,046
$PONS continues to break out. The next post explains why there is still at least 3x upside and what the underlying principle is…
post-image
PONS+3.32%
Gold plunges, Treasury yields surge, U.S. stock futures fall across the board—rate hike expectations reignited
The impact of the nonfarm payrolls data was not limited to the crypto market; traditional financial markets reacted just as sharply.
First, gold. Spot gold plunged in a straight line after the data was released, falling below the $4,400 per ounce level. It hit an intraday low of $4,382.62, with its daily decline widening to 2% at one point. Silver fell in tandem, with spot silver down more than 2%. Why did gold also fall? The logic is the same as with Bitcoin—rising rate hike expectat
SNDK+11.88%
🚨 #BTCReclaims80K
#Bitcoin just reminded everyone why risk management always comes before prediction.
One strong economic report... One wave of liquidations... And suddenly, the entire crypto market was filled with panic.
But is this really the beginning of a massive bear market?
Not so fast.
The biggest mistake traders make is reacting to the first move instead of understanding why it happened.
Here's what actually unfolded.
The U.S. August jobs report came in much stronger than markets expected.
• 162K new jobs were added. • Expectations were only around the mid-50K range. • July's data was
BTC-1.93%
INDEX-29.38%
This trend is so clear I don't even need to think—the account is partying on its own.

During the repeated intraday swings, $SKHYNIX was being shaken back and forth within a small range, testing most people's patience. But I noticed one detail: every dip was quietly met with buying, while the lows kept getting higher. This isn't an unwanted token—it's building up strength.

Once the move was confirmed to be stable, the entry was at 1235.91. Now, it's already reached 1289.19, and the return comes to +308.46%. What a relief. The first half was so grinding it made people sleepy, but the second
post-image
SKHYNIX+3.76%
DOGE-3.02%
ADA-5.27%
JUST IN: OpenAI faces scrutiny over GPT-6 Astra evaluation adjustments that boosted its metrics while some competitors' scores dipped, fueling questions on transparency. No crypto tie-in; no speculation beyond stated concerns.
post-image
In 2026, the Bitcoin market is expected to remain volatile, with a pullback to around 75,000 being the most likely scenario; a rise to 85,000 during the year has strong consensus; breaking through 90,000 will be somewhat difficult and is considered a neutral-to-optimistic event.
post-image
BTC-1.91%
My “idle funds” on Gate have started earning money on their own
Gate recently launched a feature called “Idle Money Treasure”—idle USDT and USDC in your account automatically earn interest, with no lock-up and no manual subscription. Interest is paid out automatically every day.
I didn’t pay much attention at first, thinking, how much interest could it really generate? Then I checked after a week and found a few dozen U in my account. It wasn’t much, but the feeling of your money growing on its own without doing anything is pretty satisfying.
Before, my USDT just sat there. Now it can earn mon
USDC-0.02%
Welcome to Cryptoluter! As a crypto educator dedicated to breaking down market complexities, this account provides simple daily insights, key portfolio updates, and step-by-step guidance to help both beginners and active traders grow together. Focus on tracking real-time asset analytics, building disciplined risk strategies, and uncovering new market opportunities with daily updates—follow along and level up your trading journey! #GateStockInsightsChallenge $BTC
BTC-1.93%
  • 9
  • 2
Everyone’s long LTC while the 4h quietly flips—are you holding the wrong side of LTC?

$LTC /USDT - SHORT

Trade Plan:
Entry: 52.17 – 52.41
SL: 53.73
TP1: 51.21
TP2: 50.49
TP3: 49.41

Why this setup?
- RSI on 15m is screaming at 70.47—overheated, mean-reversion fuel for a SHORT.
- 1D trend is range, but our 4h bias says fade the pump, not chase it.
- Entry zone 52.29 with TP1 at 51.21—that’s a 2% drop before the daily open even blinks.
- Why now? The last push to 52.41 looks like a liquidity grab; ATR (0.46) says volatility is coiled for a snap back.

Debate:
TP2 at 50.49 or fakeout
LTC+3.37%
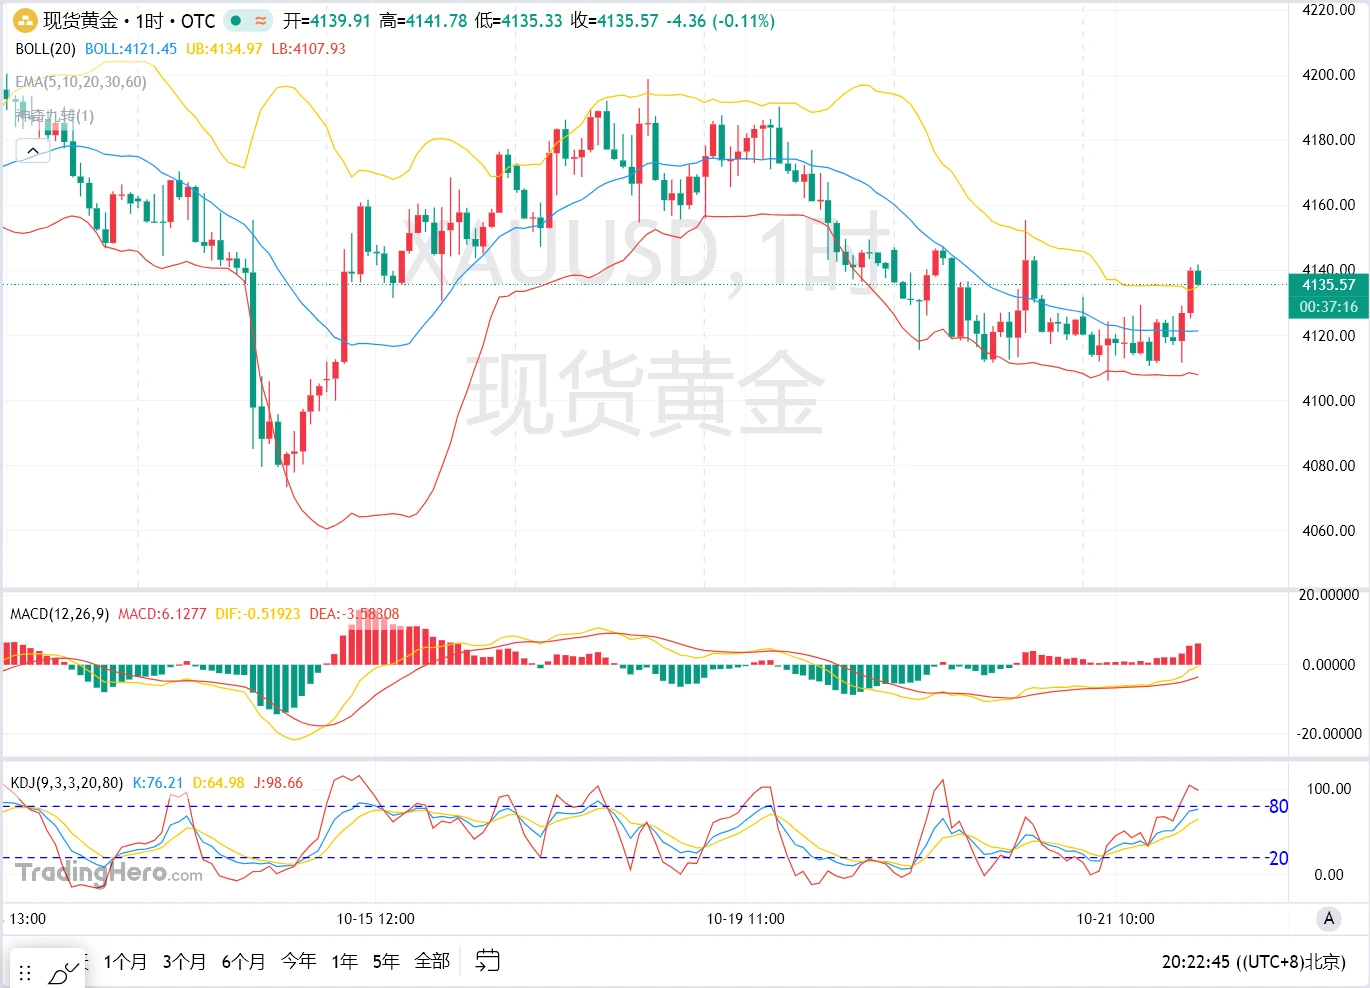
Gold may rebound higher with two relatively attractive selling zones worth watching
$XAU $XAUT
XAU-0.88%
XAUT-0.80%
  • 4
This week’s market action was compounded by the bombshell of the nonfarm payrolls report, and with it also being the first week of September, the overall pace was fairly intense.
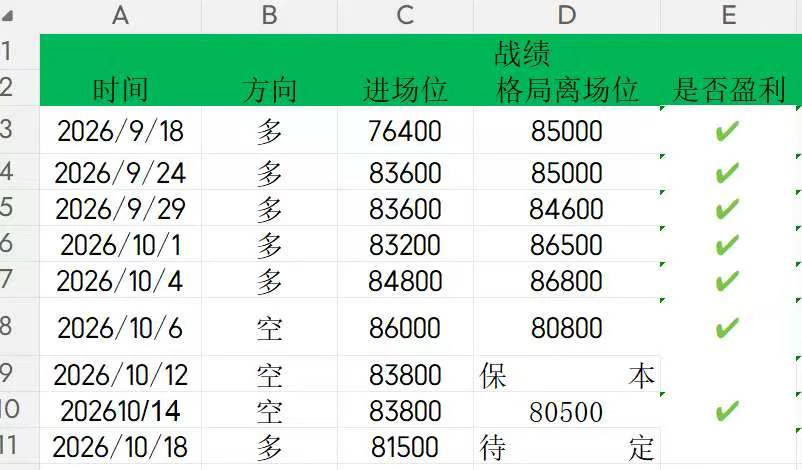
Fortunately, we still managed to catch a few waves of opportunities. Overall, we kept a pretty good rhythm. Let’s keep it up next week.
$XAU
XAU-0.88%
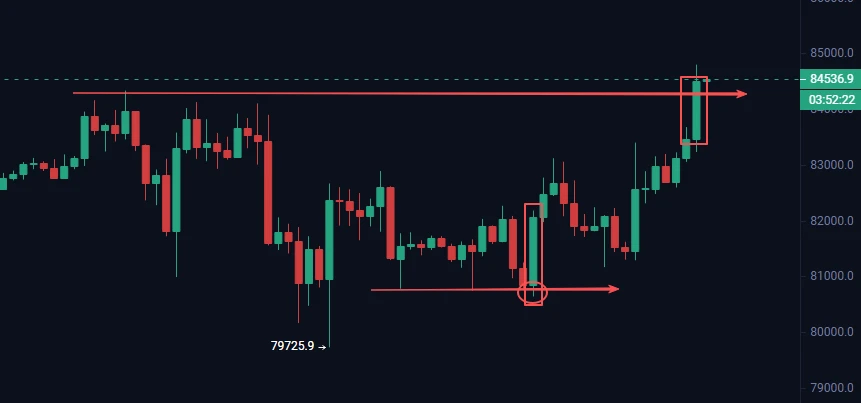
$BTC Hit the First Target — 4H Breakout Keeps Bulls in Control
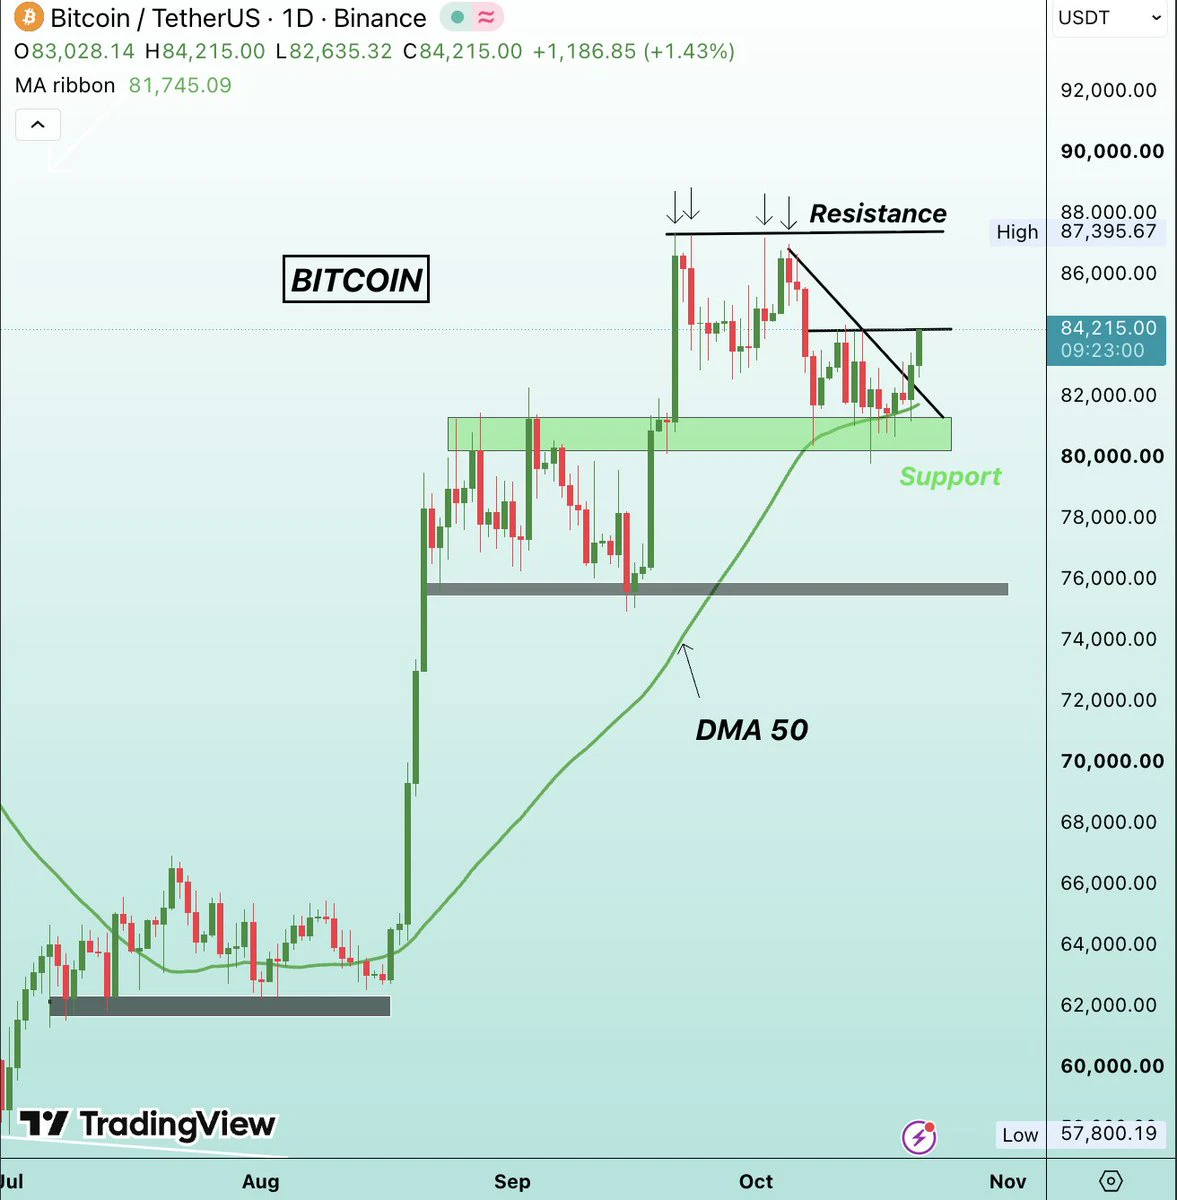
As expected, Bitcoin resumed its upward move after a minor correction and successfully reached the first target at $78,040.
More importantly, the latest 4-hour candle closed above the key $77,400–$77,630 trading zone, strengthening the short-term bullish structure.
As long as BTC holds above this reclaimed area, I expect the upward move to continue, with the potential for stronger bullish momentum over the coming hours.
The next focus now shifts toward the second target at $78,570, followed by the important $78,770 trading level
post-image
BTC-1.93%
  • 3
  • 1
$AT I’m bearish on this structure. The whale-to-retail position ratio has been pushed down to 12.07x, with retail almost entirely on the opposite side, but OI is only $9M —such a small amount of open interest supporting such a skewed ratio simply means the market is too thin; whoever holds more tokens calls the shots. $HUMA 7.02x with $12M in OI, and $GPS 6.36x, show the same pattern. These tokens have no spot market to begin with, on-chain liquidity is pitifully thin, and token holdings are concentrated, so wherever whales lean, prices basically follow. Looking at the overall picture: among 2
post-image
AT+1.37%
HUMA-1.63%
GPS-0.94%
Load More

Join 40 M users in our growing community

⚡️ Join 40 M users in the crypto craze discussion

💬 Engage with your favorite top creators

👍 See what interests you

View More