Share your thoughts
placeholder
Article
#晒出我的持仓收益 has gone through two roller-coaster rides—should we reduce our position?
post-image
#USStocksRecordSixthLargestWeeklyInflowSince2008 U.S. Stocks See Sixth-Largest Weekly Inflow Since 2008
U.S. equities are seeing a powerful return of institutional buying. According to Bank of America flow data, clients were net buyers of U.S. equities for the second consecutive week, with around $7 billion flowing into stocks and equity ETFs during the latest week. That ranks as the sixth-largest weekly inflow since 2008.
The biggest driver was institutional investors and hedge funds, while private retail clients remained net sellers for a sixth straight week. Buying was particularly strong
post-image
The short strategy at the 365-day moving average level, with the coin price at 82222, has multiplied the principal 11x in 8 days and successfully come to a close!
Subscription special price: 8.8, today only. Subscribe and get on board—the next big trade is being laid out!
post-image
  • 6
📊 August CPI is coming in hot today—how will the market move?
The U.S. August CPI is about to be released, and the inflation data will directly impact market expectations for the Fed’s next policy move. BTC, U.S. stocks, and gold could all see volatility!
💡 How do you plan to trade after the CPI is released?
A. Positive data, go long directly
B. Negative data, short with the trend
C. Wait for the volatility to settle before entering
D. Position early and bet on the direction
💭 Are you bullish or bearish? Share your trading direction in the comments, and let’s wait for the CPI and seize the
post-image
GateLiveChinese
📊 August CPI is coming in hot today—how will the market move?
The U.S. August CPI is about to be released, and the inflation data will directly impact market expectations for the Fed’s next policy move. BTC, U.S. stocks, and gold could all see volatility!
💡 How do you plan to trade after the CPI is released?
A. Positive data, go long directly
B. Negative data, short with the trend
C. Wait for the volatility to settle before entering
D. Position early and bet on the direction
💭 Are you bullish or bearish? Share your trading direction in the comments, and let’s wait for the CPI and seize the market opportunities!
👉 Tune in to Gate Live: https://www.gate.com/live
repost-content-media
BTC-1.36%
#GateTop4MainstreamCEX .
Gate Top 4 Mainstream CEX
Gate is no longer just another crypto exchange. Its growing scale, expanding ecosystem, strong reserve position, wide asset selection and increasing trading activity show why Gate deserves serious attention among the leading mainstream centralized exchanges.
60M+ USERS
Gate has crossed the 60 million registered-user milestone. This is a major achievement because such scale means the platform is no longer serving a small crypto community. It is operating as a global ecosystem connecting millions of users with trading, Web3, earning, market disc
  • 5
XRP is range-bound but one hidden number says otherwise

$XRP /USDT - LONG

Trade Plan:
Entry: 1.3381 – 1.3447
SL: 1.3005
TP1: 1.3720
TP2: 1.3925
TP3: 1.4231

Why this setup?
Why now? The daily trend is range, yet the 4h bias is LONG with 77.4 confidence, and the 15m RSI sits at 35.0, showing room to run before overbought. The 1h ATR of 0.013095 means volatility is compressed, so a breakout from the entry zone of 1.3381 to 1.3447 could move fast. TP1 at 1.3720 and TP2 at 1.3925 are realistic targets if momentum holds, while the invalidation level at 1.3844 is the hard line that stops the tr
XRP-2.50%
On the daily chart, bearish momentum continues to be released, the price center is moving lower, and pressure over the larger cycle is evident. The 4-hour chart shows a strong decline, with bears in control, prices continuing lower, weak rebounds, and bulls struggling to resist. Bears also dominate the hourly cycle, with strong downside momentum; short-term rebounds are mostly technical recoveries with poor sustainability. Bearish resonance across multiple timeframes; maintain a bearish bias intraday.
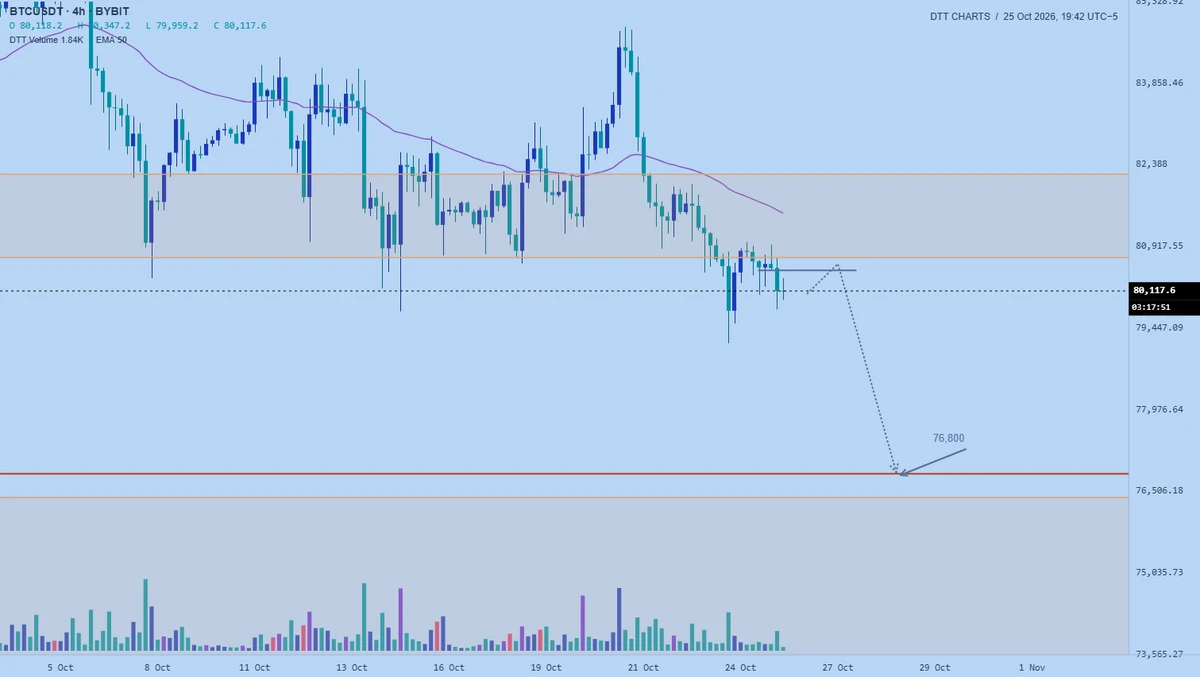
BTC: short near 77000-77500 on a rebound, with downside targets at 76500-75500
ETH: short nea
post-image
BTC-1.36%
ETH-0.21%
Observing the F***boy: SPCX
Big Rocket closed at 148.18 in U.S. trading, up 0.43%, with an intraday high of 154.70 and a low of 144.89.
Looking at the daily candlestick chart, Big Rocket's closing price was between the 5-day and 10-day moving averages. The overall rebound trend remains unchanged, and the impact of the share unlock is also diminishing.
Specifically, it opened lower in premarket trading, with the day's low also occurring around the opening. The bulls then surged ahead and pushed steadily toward the 155 level. However, after failing to set a new high, they began to retreat. The m
post-image
SPCX+0.46%
#GateMeme Inside Gate's Three-Week Meme Carnival, the Trenches Launch, and the Push to Make On-Chain Meme Trading Social
Meme markets have evolved from internet jokes into one of the most dynamic and community-driven sectors of the cryptocurrency industry. What began as viral humor has grown into a global movement where creativity, social engagement, market narratives, and trading opportunities intersect. Gate has been building aggressively around this culture, and the #GateMeme initiative represents one of its most comprehensive efforts yet to connect traders, content creators, and the broade
post-image
Insiders are quietly loading $USELESS /USDT while the 1h RSI whispers something dangerous.

$USELESS /USDT - LONG

Trade Plan:
Entry: 0.22688 – 0.23544
SL: 0.19005
TP1: 0.26199
TP2: 0.28255
TP3: 0.31338

Why this setup?
Why now? The daily trend is firmly bullish, setting a higher-timeframe backdrop that favors upside. The 1h ATR of 0.01713 tells us volatility is compressed enough for a sharp breakout from the entry zone around 0.23116. A 15m RSI at 36.87 signals oversold conditions within that entry window, suggesting a bounce is overdue rather than a continuation of weakness. The first tar
USELESS-1.76%
hot Topics only
live-cover
LIVE1,730
#AppleSeptemberEvent
Apple is entering a completely new chapter with the iPhone Duo, and for $AAPL the most interesting question now is not whether the new product looks impressive. The real question is whether Apple can turn this new premium foldable category into a powerful new revenue and upgrade cycle.
With AAPL currently around $325, the stock is standing at a critical technical area. The recent high near $330 is now the key resistance that bulls need to overcome. A clean breakout above $330 with strong buying volume could change the short-term market structure and open the door toward $
  • 6
$PI I’m speechless, seriously—everyone is long. Tell me, how could it possibly go up in this situation?
post-image
PI+0.35%
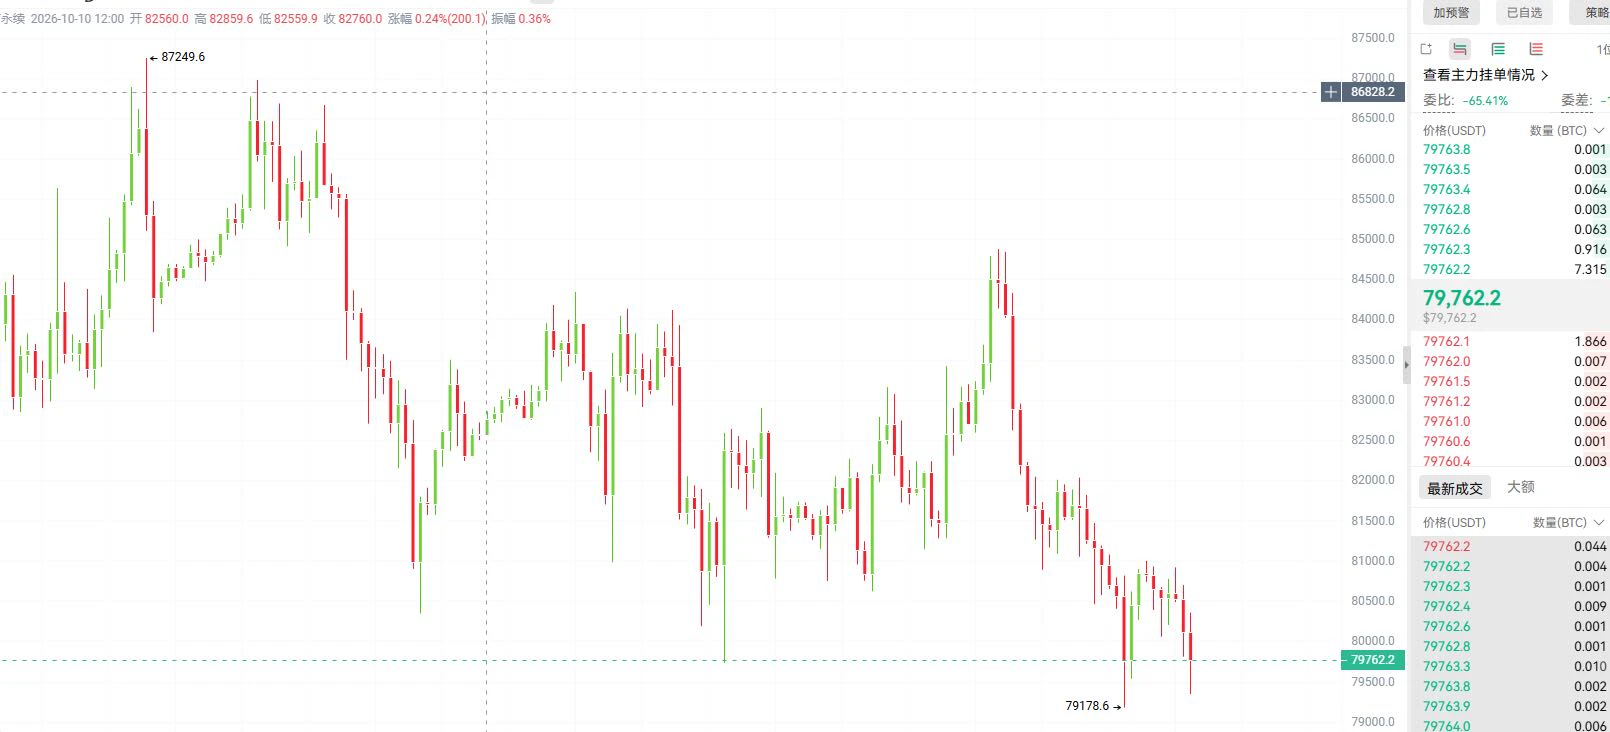
#美国8月PPI录得5.4%高于预期 Bitcoin falls below $77,000, down 3.165% in 24 hours as rate hike expectations roil the crypto market
Bitcoin has recently undergone a notable correction, with its price falling below the $77,000 threshold and its 24-hour decline reaching 3.165%. This round of price retreat is closely tied to steadily rising expectations for a Federal Reserve rate hike.
According to the CME FedWatch Tool, the market currently prices in a 60.2% probability of a 25-basis-point rate hike in September, with only a 39.8% probability of rates remaining unchanged. Looking ahead to October, rate hik
BTC-1.36%
  • 2
#AppleSeptemberEvent : The iPhone Duo Arrives, the Pro Lineup Gets Serious, and Siri Finally Learns to Listen
Apple’s September 2026 event, titled “Surprise and Shine,” has come and gone, and it delivered one of the most consequential product cycles in recent memory. Held on September 9 at the Steve Jobs Theater in Apple Park, the keynote was the first September launch led by new CEO John Ternus, and it carried the weight of expectation that comes with a leadership transition at the world’s most valuable company. What Ternus and his team unveiled was a lineup that answers long-standing questio
post-image
An analysis of BTC’s short-term trend based on Dow Theory, Chan Theory, Elliott Wave Theory, volume-price relationships, order flow, and price action (strategy recommendations)
Comprehensive assessment
Dow Theory shows that the short-term uptrend line has broken; the primary trend remains unchanged but has entered a correction
Chan Theory shows that the downward stroke (80,538→76,513) has greater momentum than segment a, with the price hovering below the lower boundary of the new central range [76,700, 77,550]
Elliott Wave Theory shows that the decline in wave ④-c has reached the c≈a target, a
post-image
BTC-1.36%
I was just about to go in and rant, but then I looked at the account and thought, forget it—let it pump however it wants, I’ll keep quiet. A few days ago, the last thing I saw before bed was $COW pulsing upward. The volume-price action was clearly off, with elephant-sized sell orders pressing down from above—it was obviously a trap for anyone chasing the move. I followed in with a short at 0.1602; it’s now at 0.1276, with +979.99% secured. It dragged sideways for ages, but the reversal was clean and decisive.
In this kind of market, don’t expect to capture everything at key levels. I’m taking
post-image
COW-3.19%
LAB-3.36%
SOL-1.35%
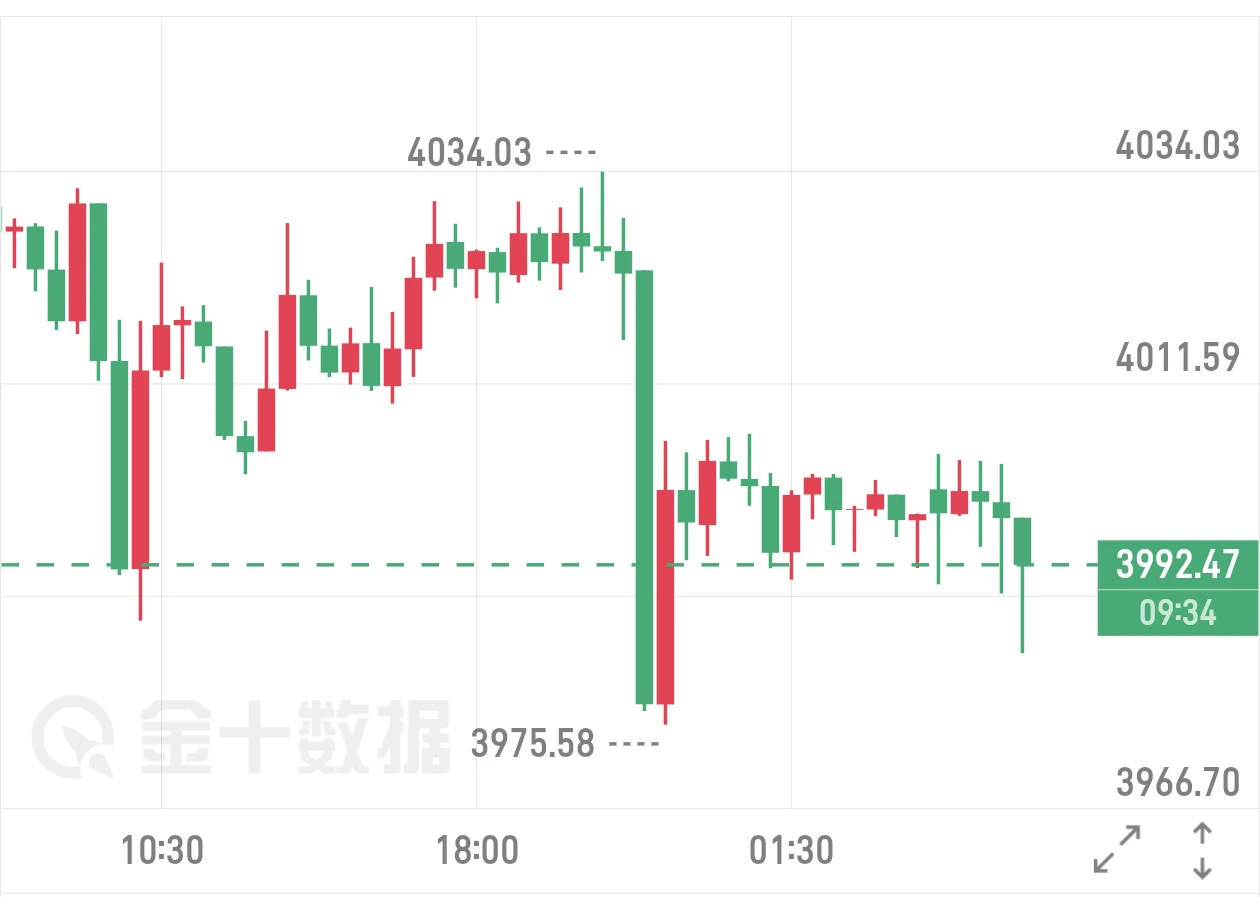
Gold plunged sharply yesterday, tumbling 100 points in a single day. Gold prices fell again in early trading today, hitting as low as 4311, with bearish momentum fully released and the market completely shifting into a weak pattern.
Yesterday’s PPI data came in significantly above expectations, raising market expectations for a September rate hike and strengthening the dollar. These were the main factors behind yesterday’s decline. Tonight’s CPI data is about to be released, and market volatility will increase then.
From the chart, after a round of declines, gold has currently stopped falling
post-image
XAUUSD+0.20%
Load More

Join 40 M users in our growing community

⚡️ Join 40 M users in the crypto craze discussion

💬 Engage with your favorite top creators

👍 See what interests you

View More