Square
Following
Hot
News
Notifications
Profile
Share your thoughts
placeholder
Article
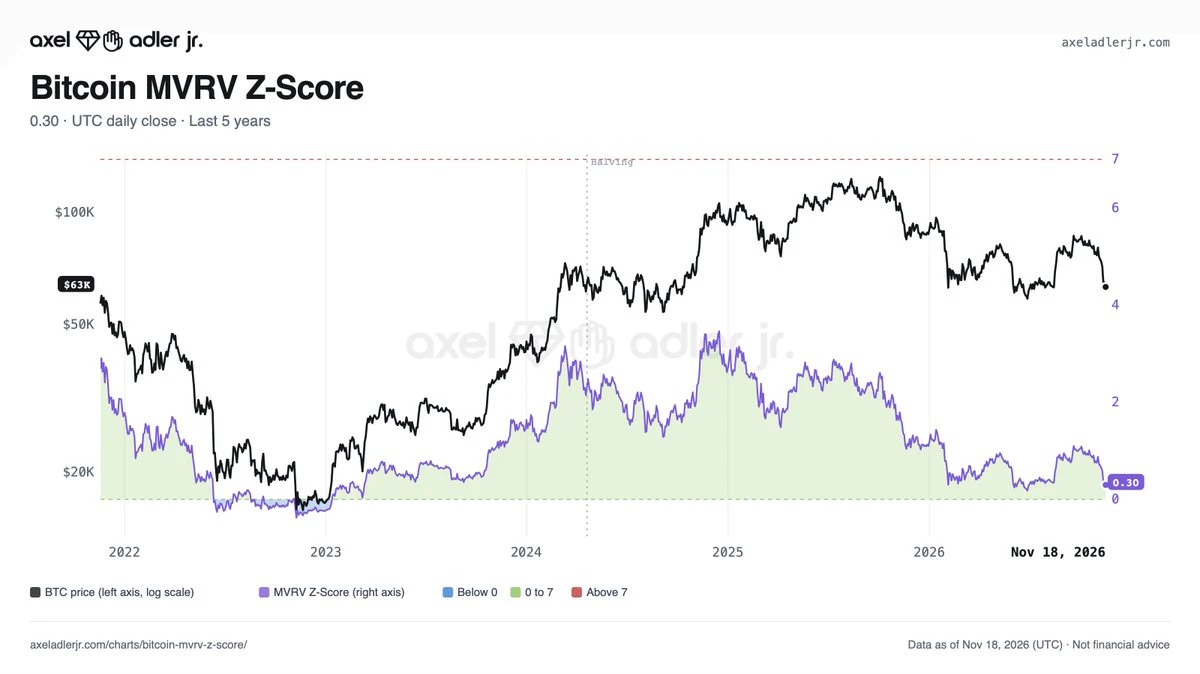
Bitcoin’s MVRV Z-Score fell from 0.66 to 0.30 over the past week. At zero, Bitcoin’s market cap equals its realized cap. The last time the metric was below zero, it stayed there for 68 consecutive days, from November 2022 to January 2023.
Bitcoin MVRV Z-Score: 0.30
post-image
BTC-0.67%
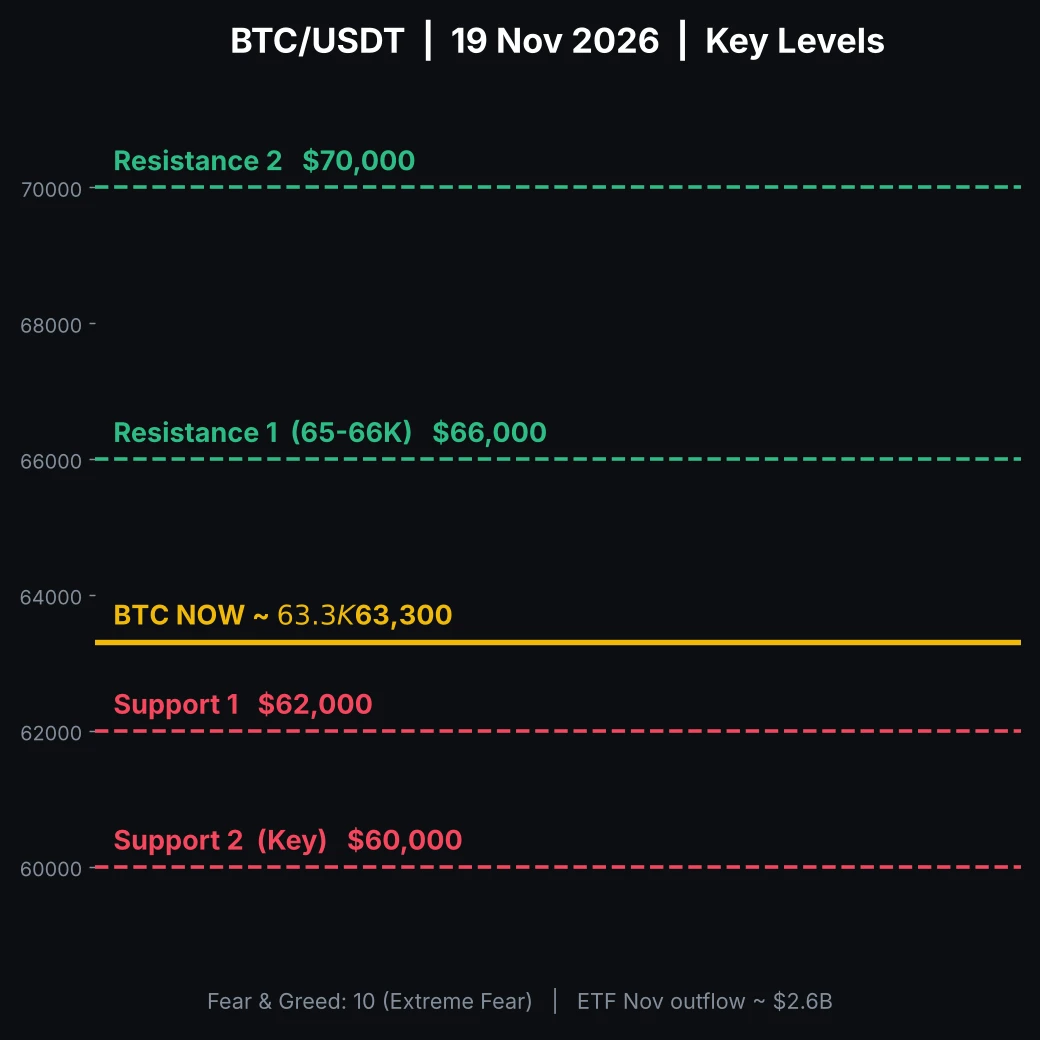
📊 BTC | ~$63,300
Resistance sits at $65K–66K, with the next level at $70K. Support is at $62K, followed by $60K. ETFs recorded roughly $2.6B in outflows this month. ⚠️ NFA
#BTC #GateSquare
post-image
BTC-0.67%
Trenches
PIEVERSE
P
bade
b
PIEVERSE
0x0e...25a9
Market Cap
$.
Change
.
24h Vol
$.
Holders
.
DacityCoin
D
bade
b
DacityCoin
DKYc...pump
Market Cap
$.
Change
.
24h Vol
$.
Holders
.
GTA6
G
bade
b
GTA6
4kjr...zDnz
Market Cap
$.
Change
.
24h Vol
$.
Holders
.
mihao
m
bade
b
mihao
4Cxj...pump
Market Cap
$.
Change
.
24h Vol
$.
Holders
.
PROS
P
bade
b
PROS
0x8b...9832
Market Cap
$.
Change
.
24h Vol
$.
Holders
.
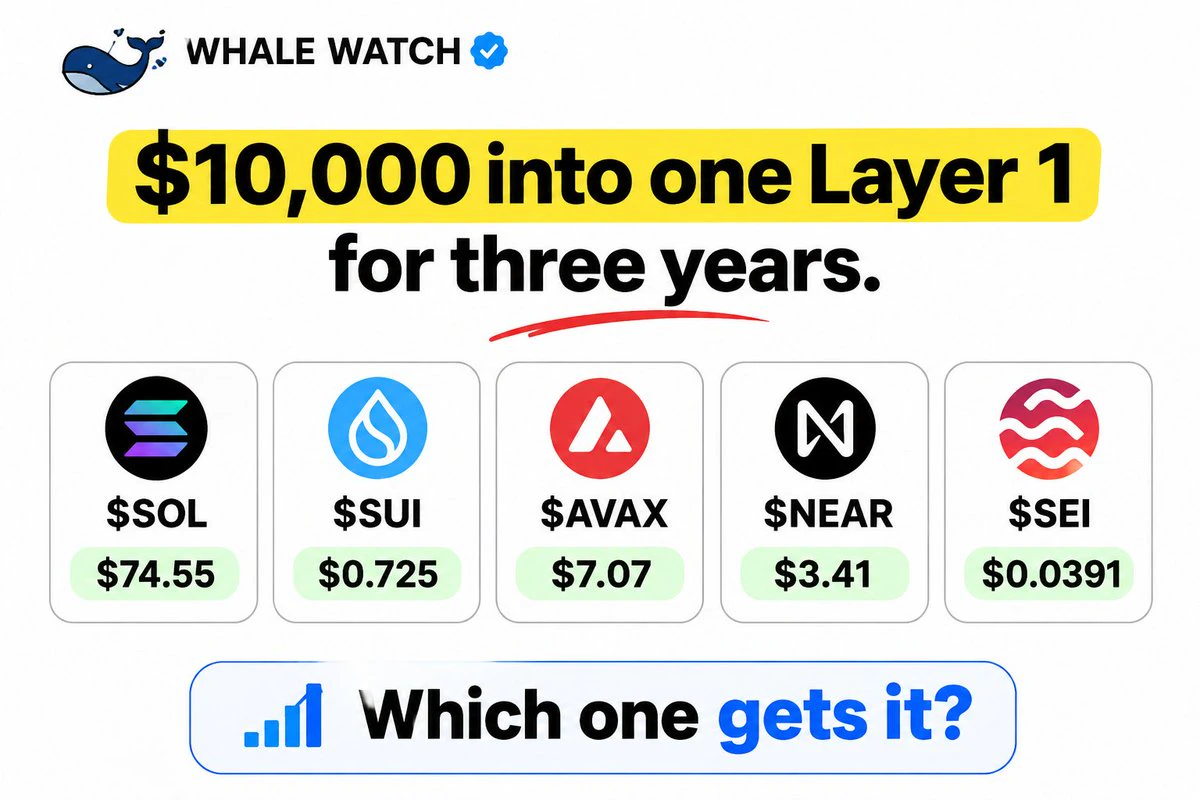
🐋 WHALE WATCH : $10000 into one Layer 1 for three years.
Current prices =>
$SOL — $74.55
$SUI — $0.725
$AVAX — $7.07
$NEAR — $3.41
$SEI — $0.0391
Which one gets it ?
post-image
SOL-0.77%
SUI-1.05%
AVAX-0.10%
SEI-1.58%
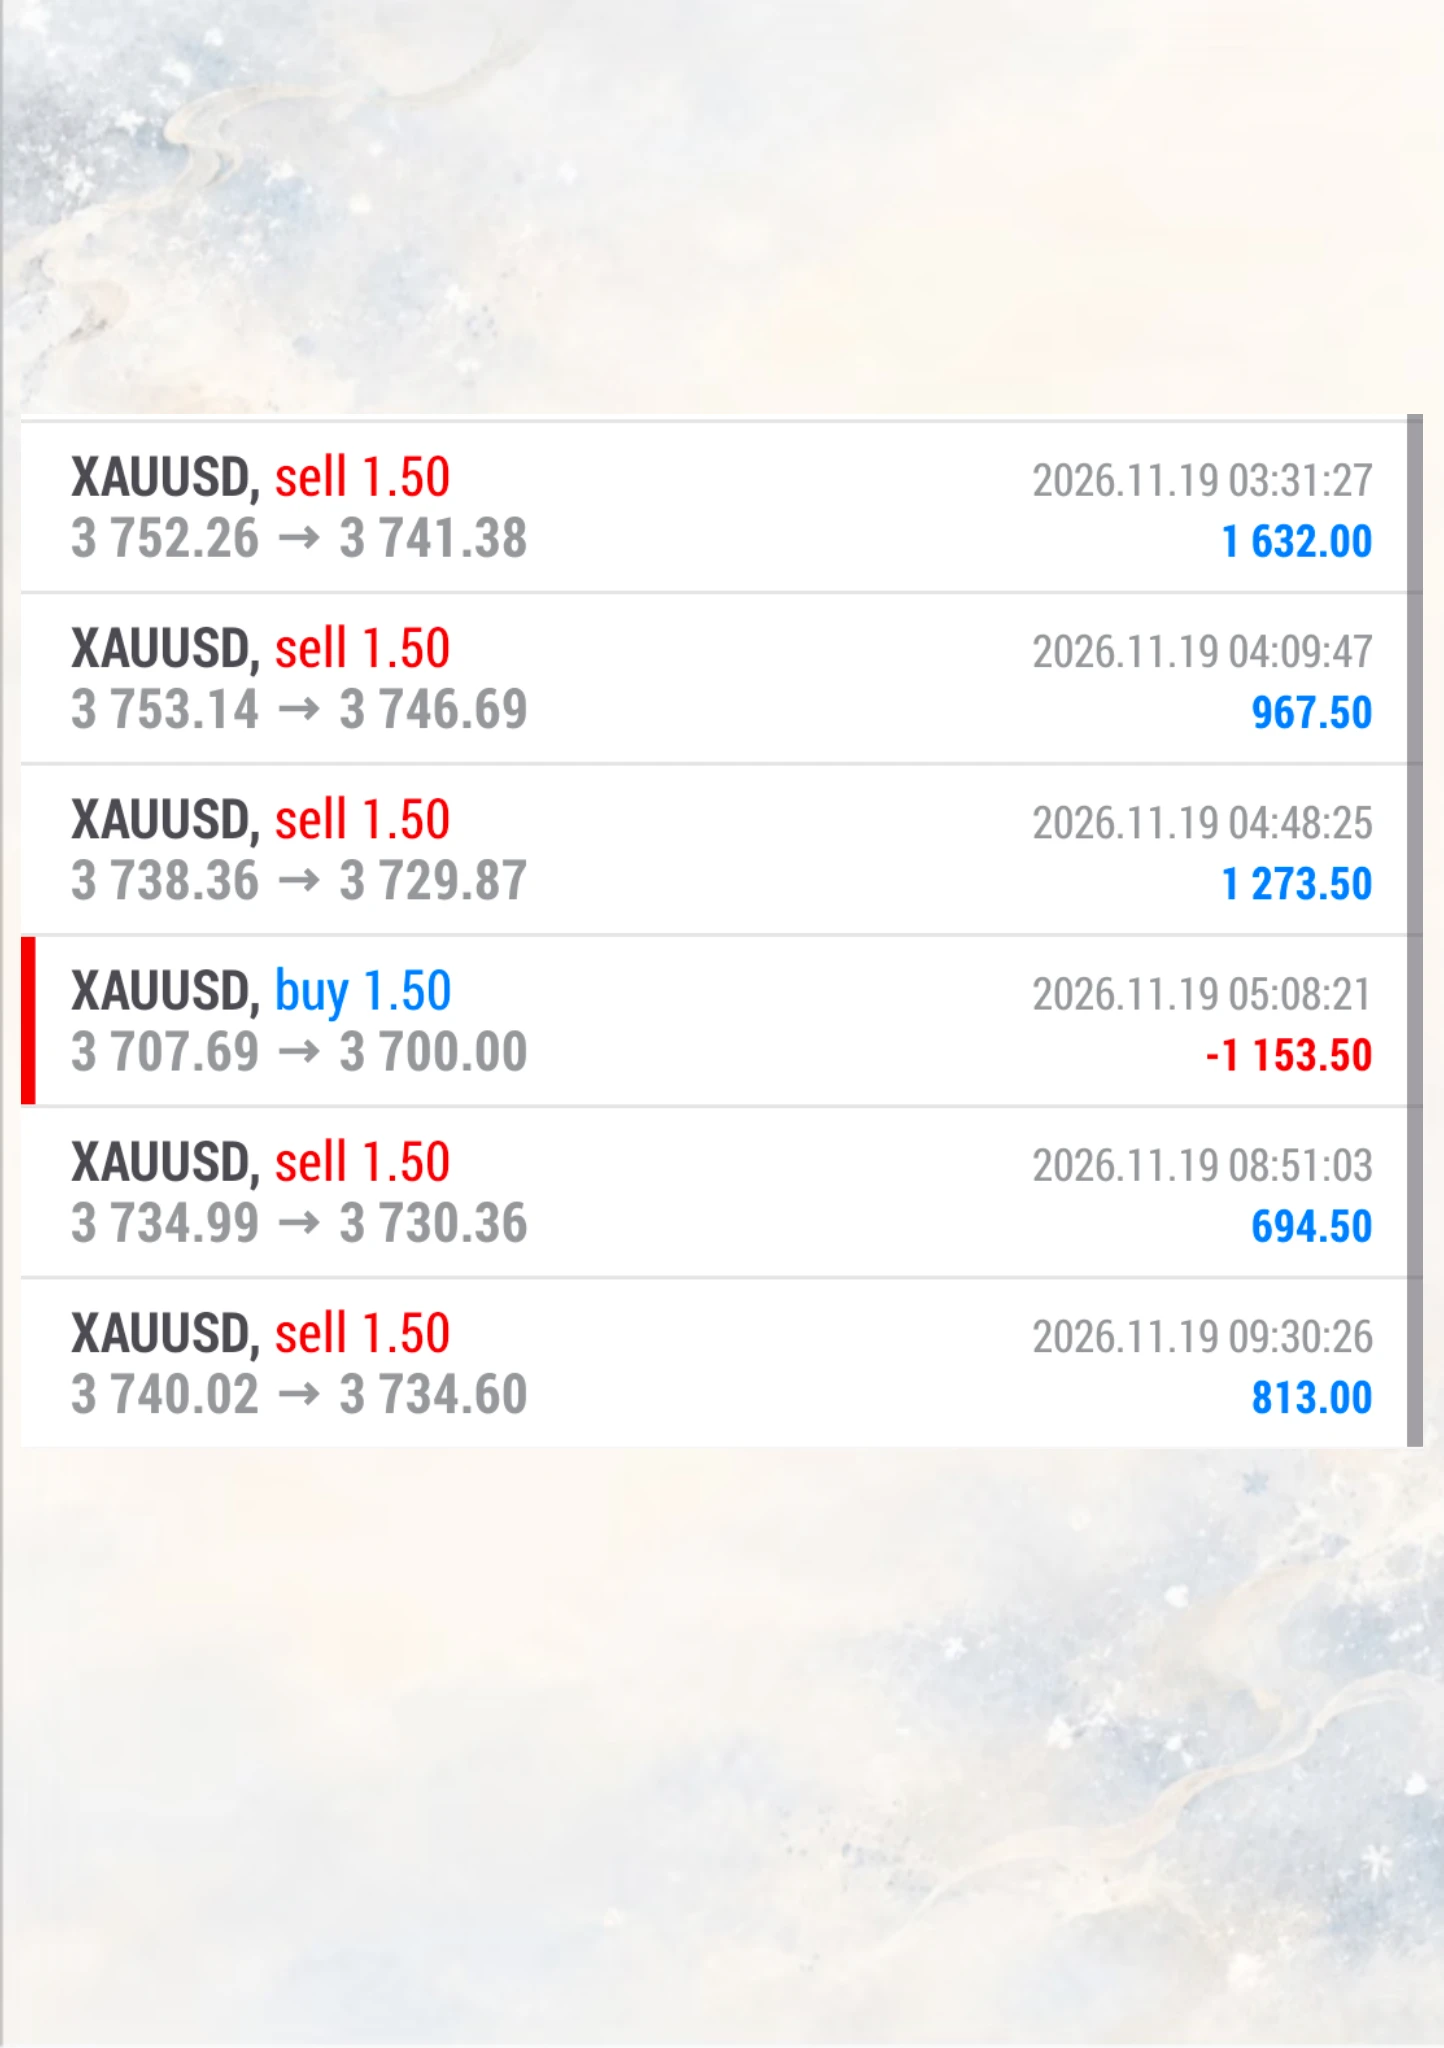
Sixth gold trade of the day: nailed the trend and corrected in time!
Shorted at 3740, exited at 3734, 6 points, 813🔪$XAUT
post-image
XAUT+0.30%
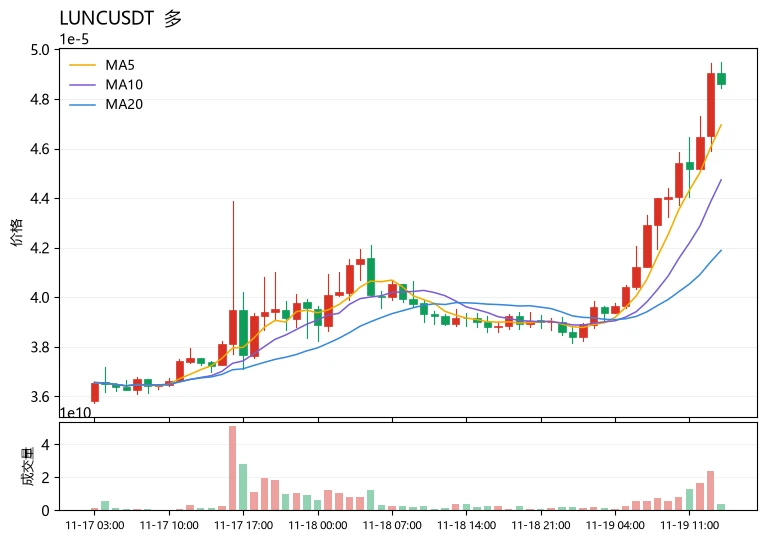
$LUNC $LUNC has rallied 24% against the trend amid extreme fear. Is it the one in its sector most worth watching? Start with a comparison: $ZKP is down 22% over 24 hours, with moving averages in a bearish alignment and a negative MACD histogram; $HYPE is only trading in a narrow range, with a 6.37% amplitude; while $LUNC , now at 4.861e-05, is above MA5 (4.6954e-05) and MA20 (4.18935e-05), and its MACD histogram at +8.467e-07 remains bullish, showing clear relative strength. However, RSI is already at 83.8, the price is near the Bollinger upper band at 4.87627e-05, and the 30-candle amplitude
post-image
LUNC-2.74%
ZKP-1.63%
HYPE+0.24%
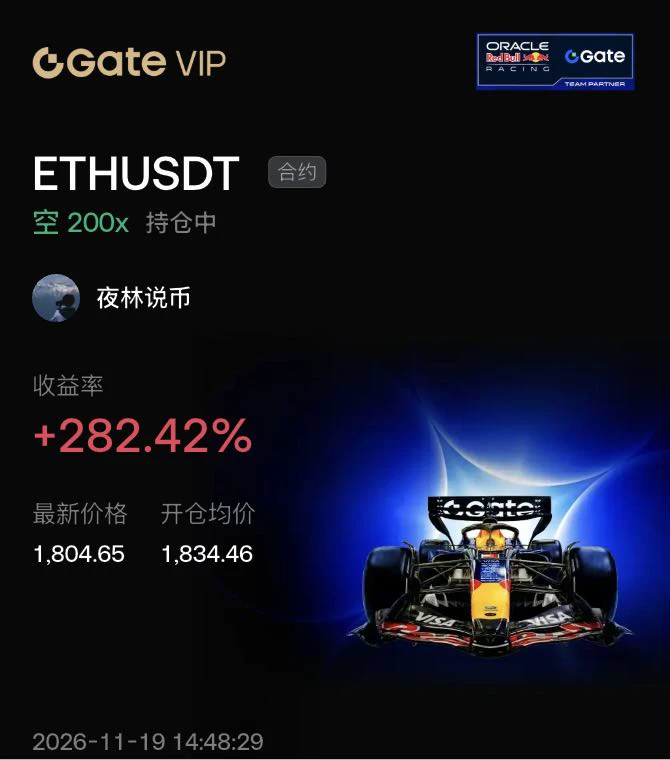
$ETH Could a sharp pullback after a false breakout above resistance trigger a liquidation cascade?
In-depth analysis: 1834.46 is a key resistance level for ETH. After a false breakout above this level, a rapid pullback can completely shatter bulls’ psychological defenses. The breach of resistance triggers a cascade of stop-losses, while 200x leverage perfectly amplifies this long squeeze. $SOL $GT #Gate年度荣耀盛典
post-image
ETH-1.26%
SOL-0.74%
GT-2.24%
  • 1
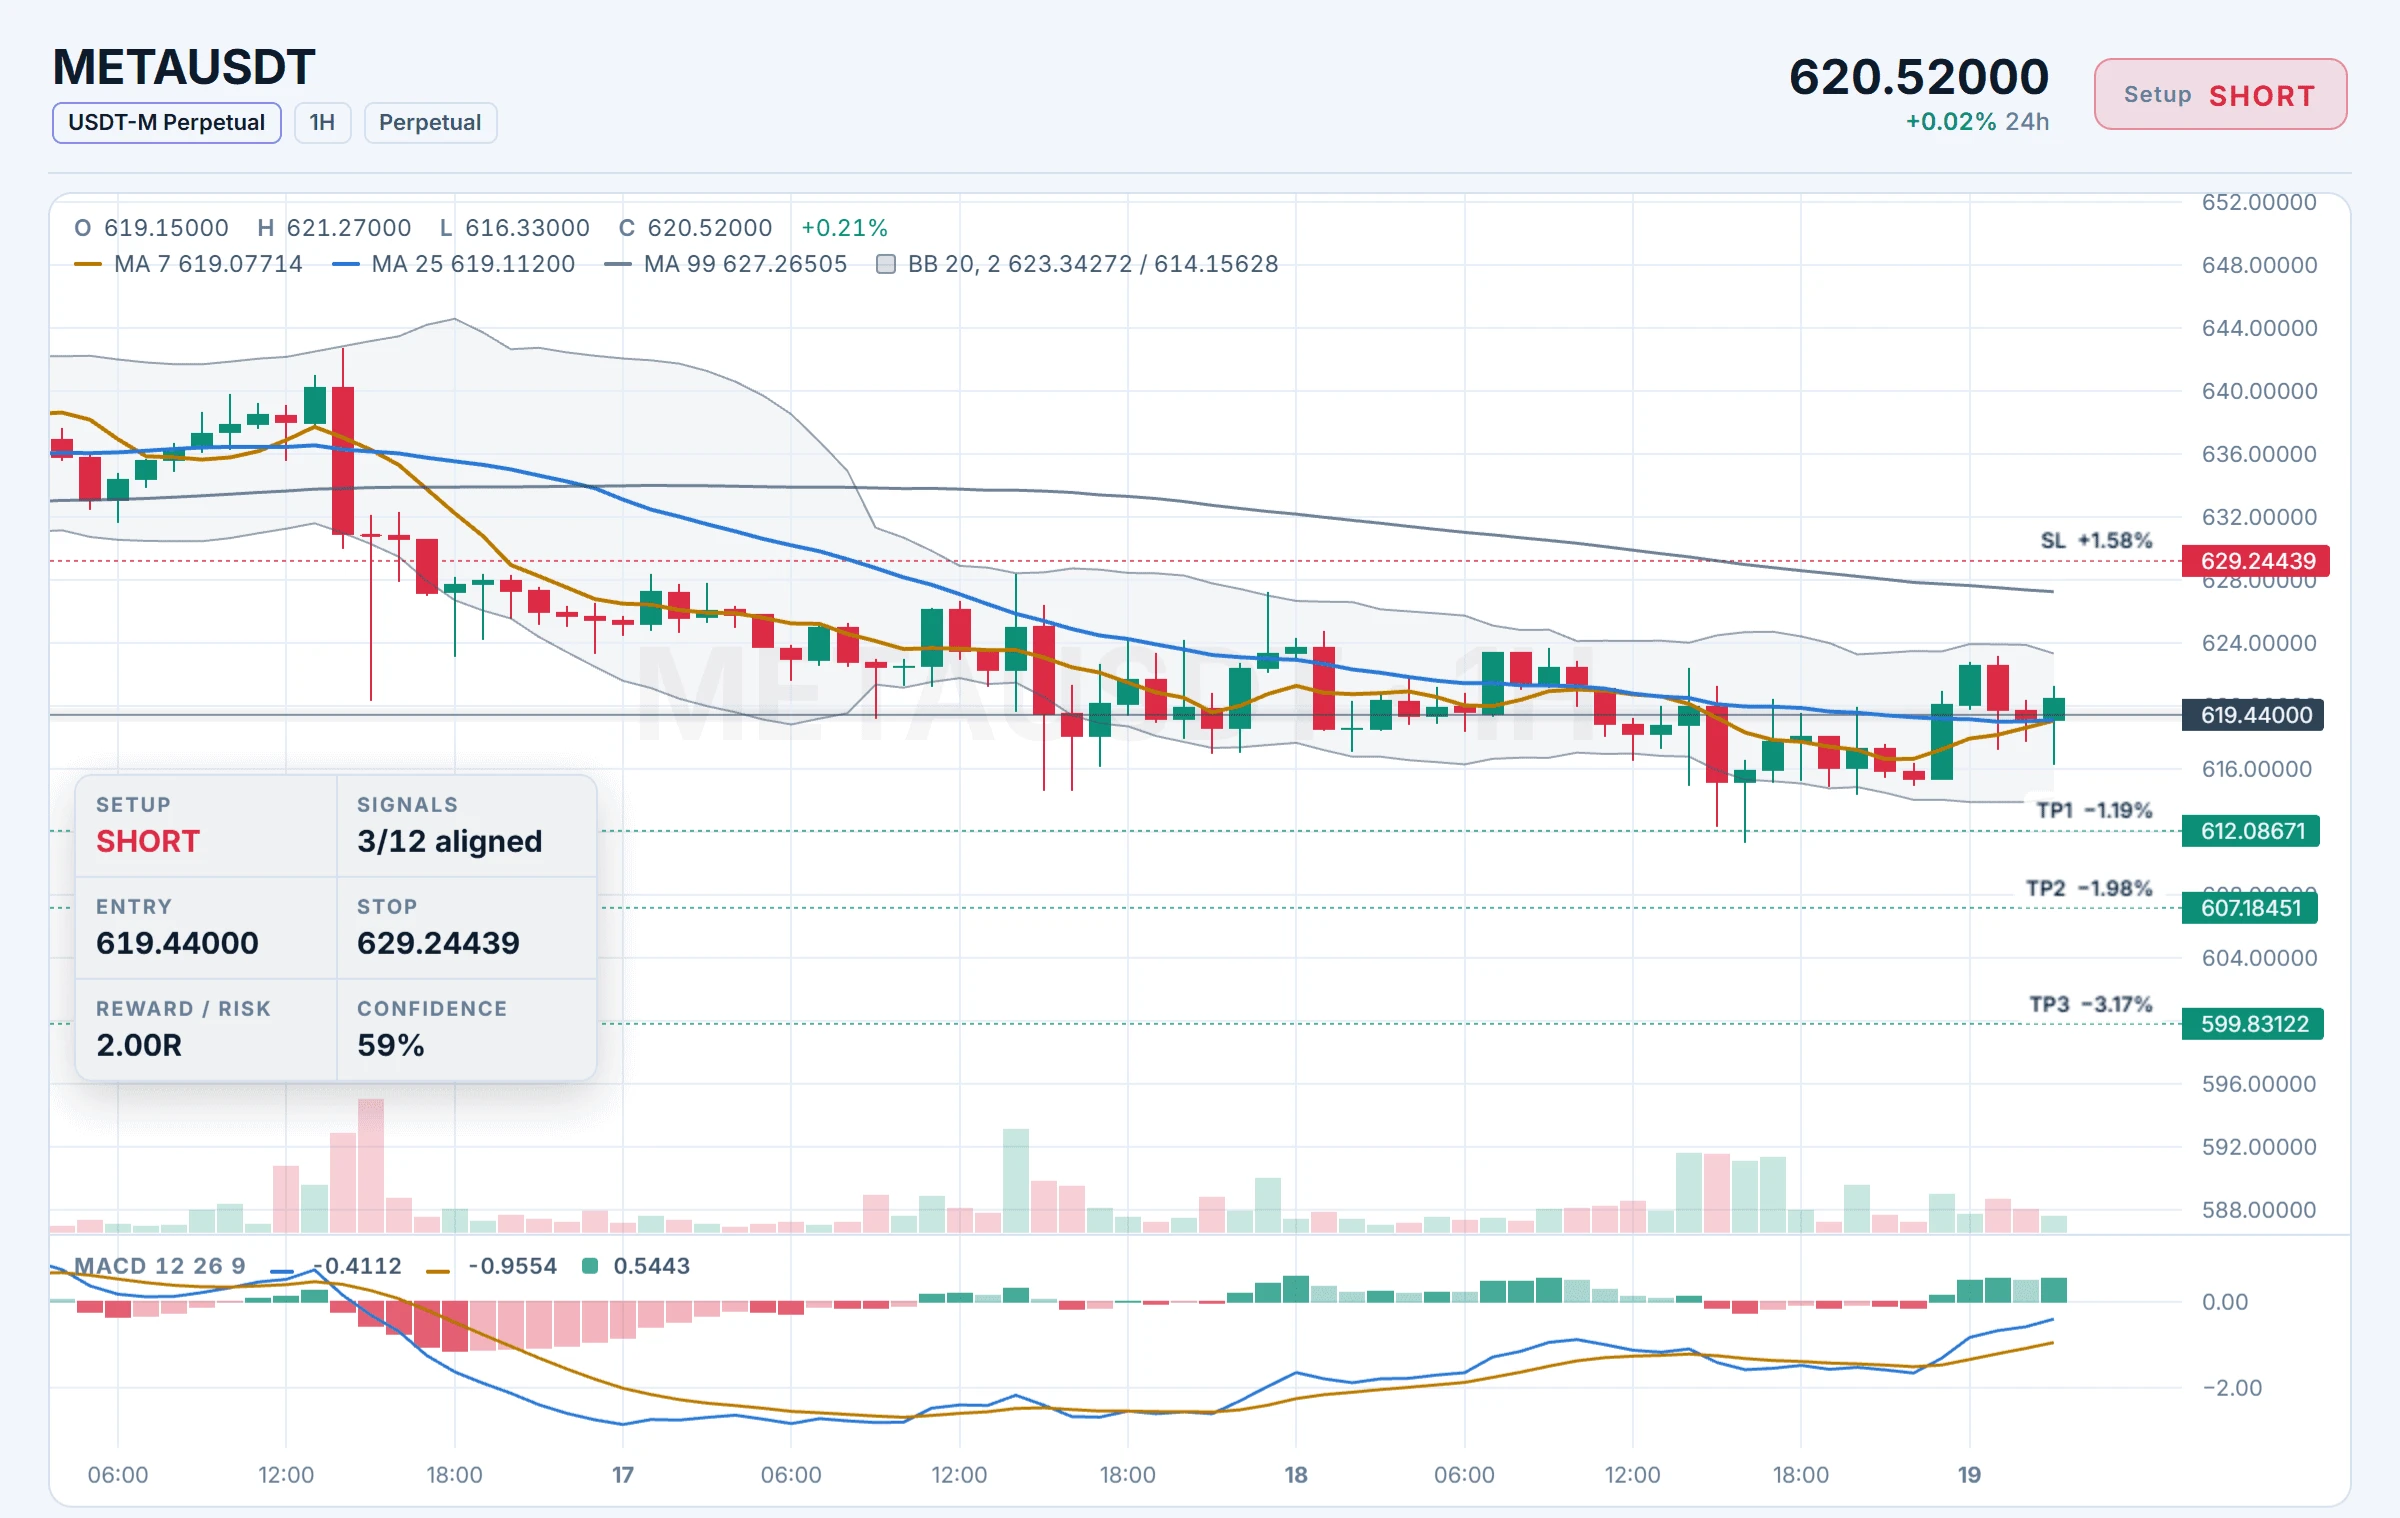
$META /USDT Short Setup: Momentum Conflict

$META /USDT

Direction: Short

Entry: 619.44000

Stop Loss: 629.24439

Targets
TP1: 612.08671
TP2: 607.18451
TP3: 599.83122

$METAG
post-image
META-0.07%
METAG-0.13%
Made a decisive call to pivot to Beijing today.
I've always wanted to experience the capital for myself—the Great Wall, the Forbidden City, all of it.
We even got a light snow, which feels like a great omen ❄️
Spending too long up north always feels a bit gloomy, though.
As for venturing any further, I'm putting that on hold for now.
Hoping for a wonderful time in Beijing before running back down south.
post-image
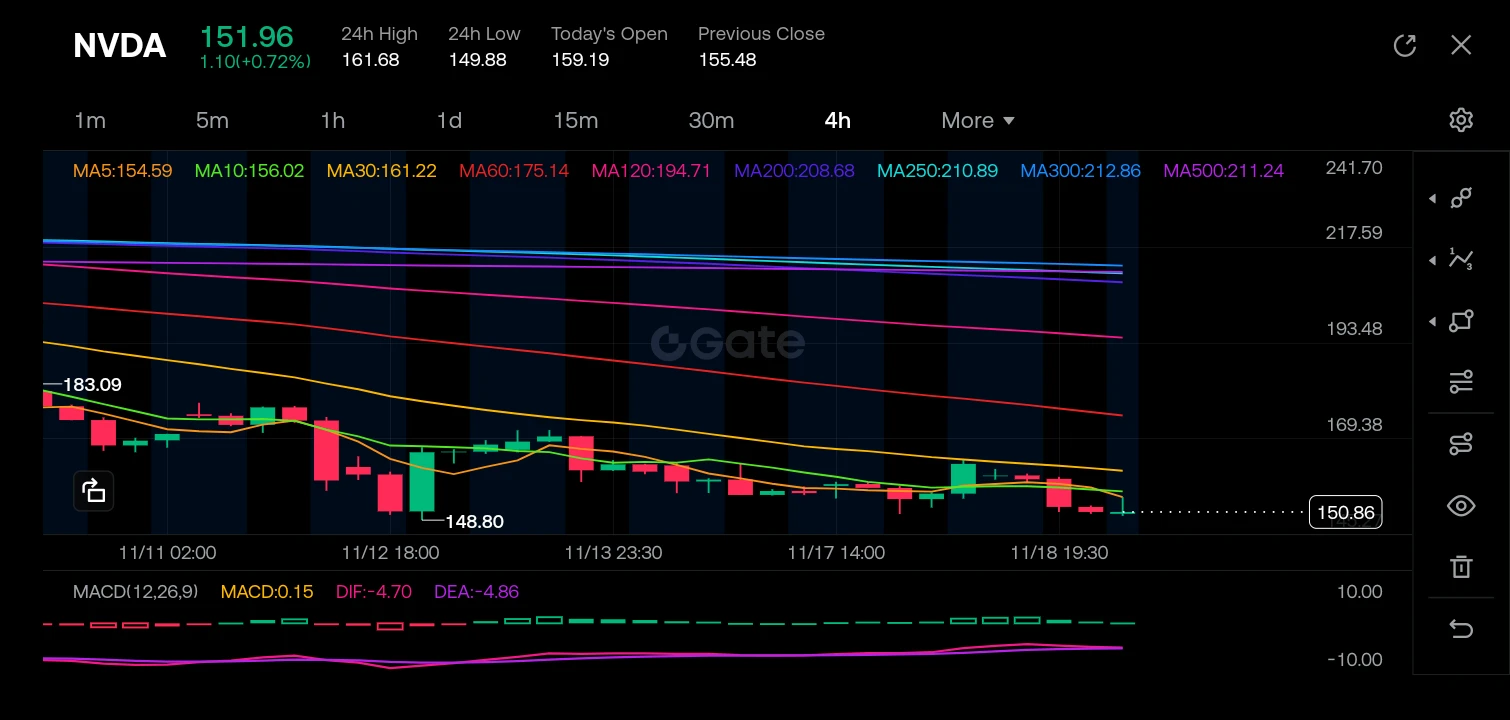
$NVDA ‌#NvidiaQ3RevenueHits115.8B

Structural Read: NVDA on the 4H is in a confirmed downtrend — lower highs, lower lows, price beneath all MAs (MA5:154.59 → MA500:211.24), and MAs fanned in perfect bearish stack. The waterfall from 183.09 → 148.80 was a liquidation cascade; the current action (148.80–155) is a bear flag / pause, not a reversal.

Macro flow (1M → 1W): Distribution. Heavy red bodies on down-moves, weak green bodies on bounces — supply dominates.

Micro flow (1D → 1H): Compression. Doji/spinning tops near 150–151 = indecision. The MACD (DIF -4.70, DEA -4.86, hist +0.15) shows
post-image
NVDA-2.97%
  • 3
BTC Wipes out all gaain since aguest market depth has shrunk 38 from this year peak
live-cover
LIVE1,668
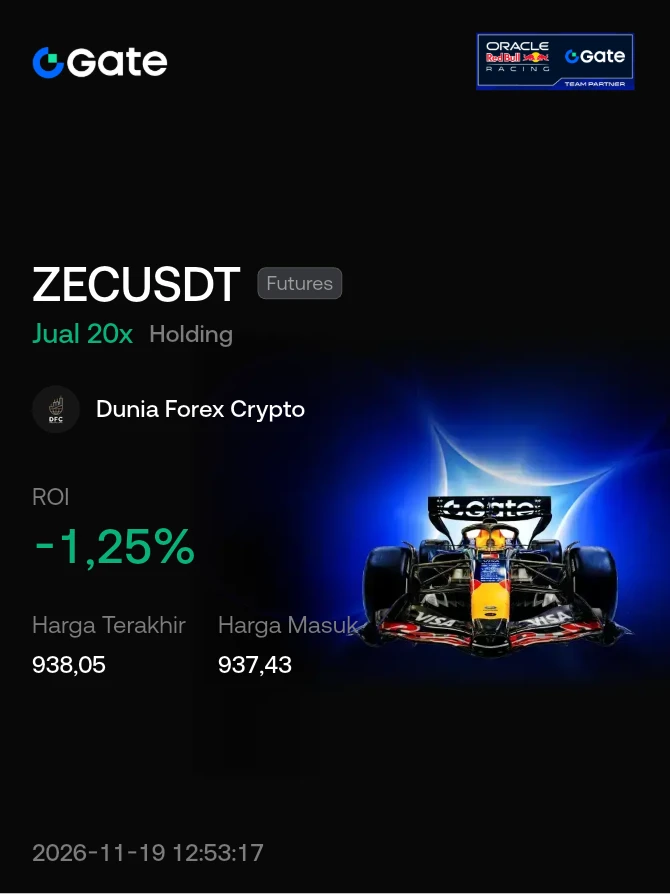
#Share My Holding Returns#
Time to enter and make a profit☕🐂🀄
post-image
ZEC+1.29%
  • 1
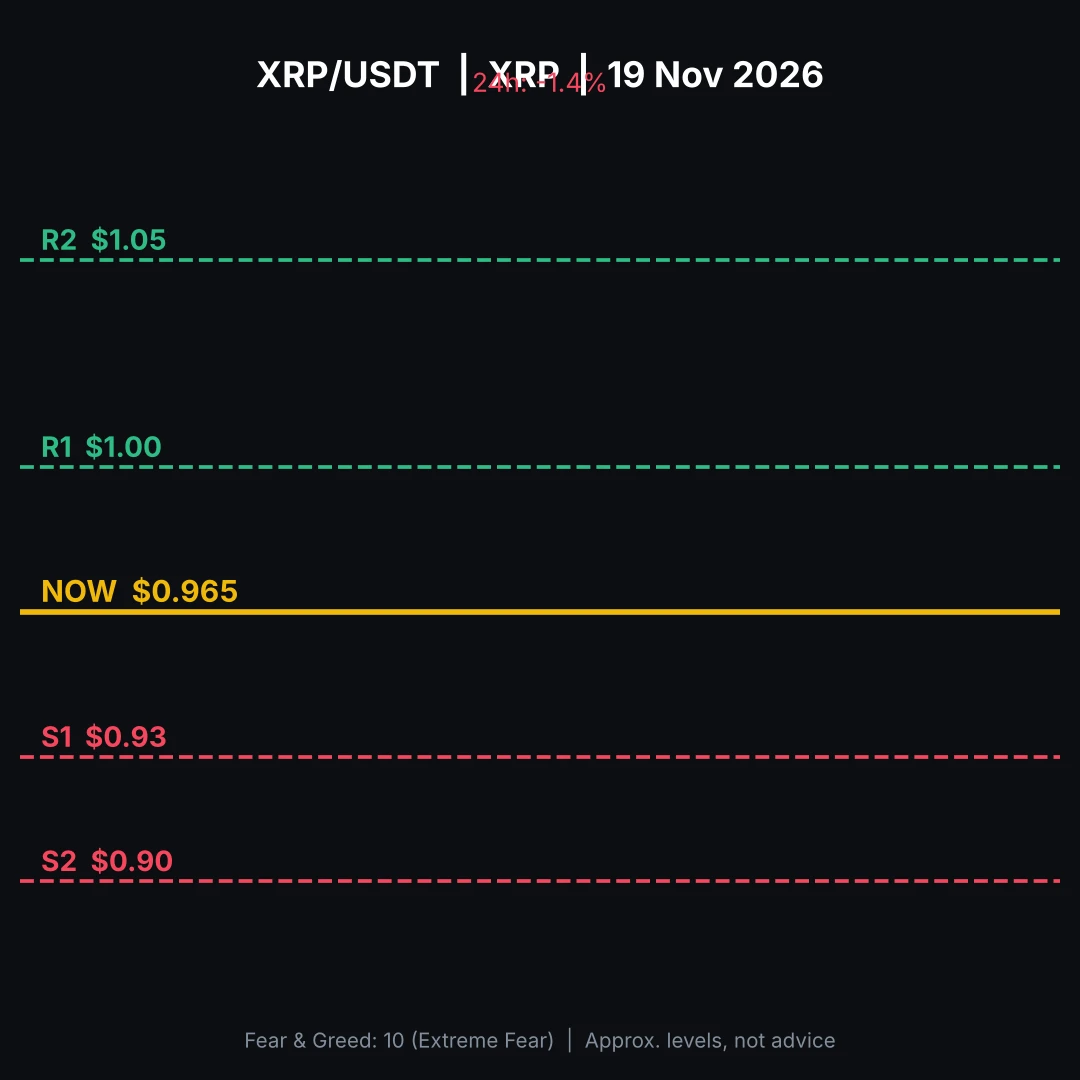
📊 XRP | ~$0.965
XRP is sitting just under the $1.00 psychological level. Support is $0.93 and $0.90. A close above $1 would improve the picture. ⚠️ NFA
#XRP #GateSquare
post-image
XRP-1.15%
The morning analysis played out perfectly!
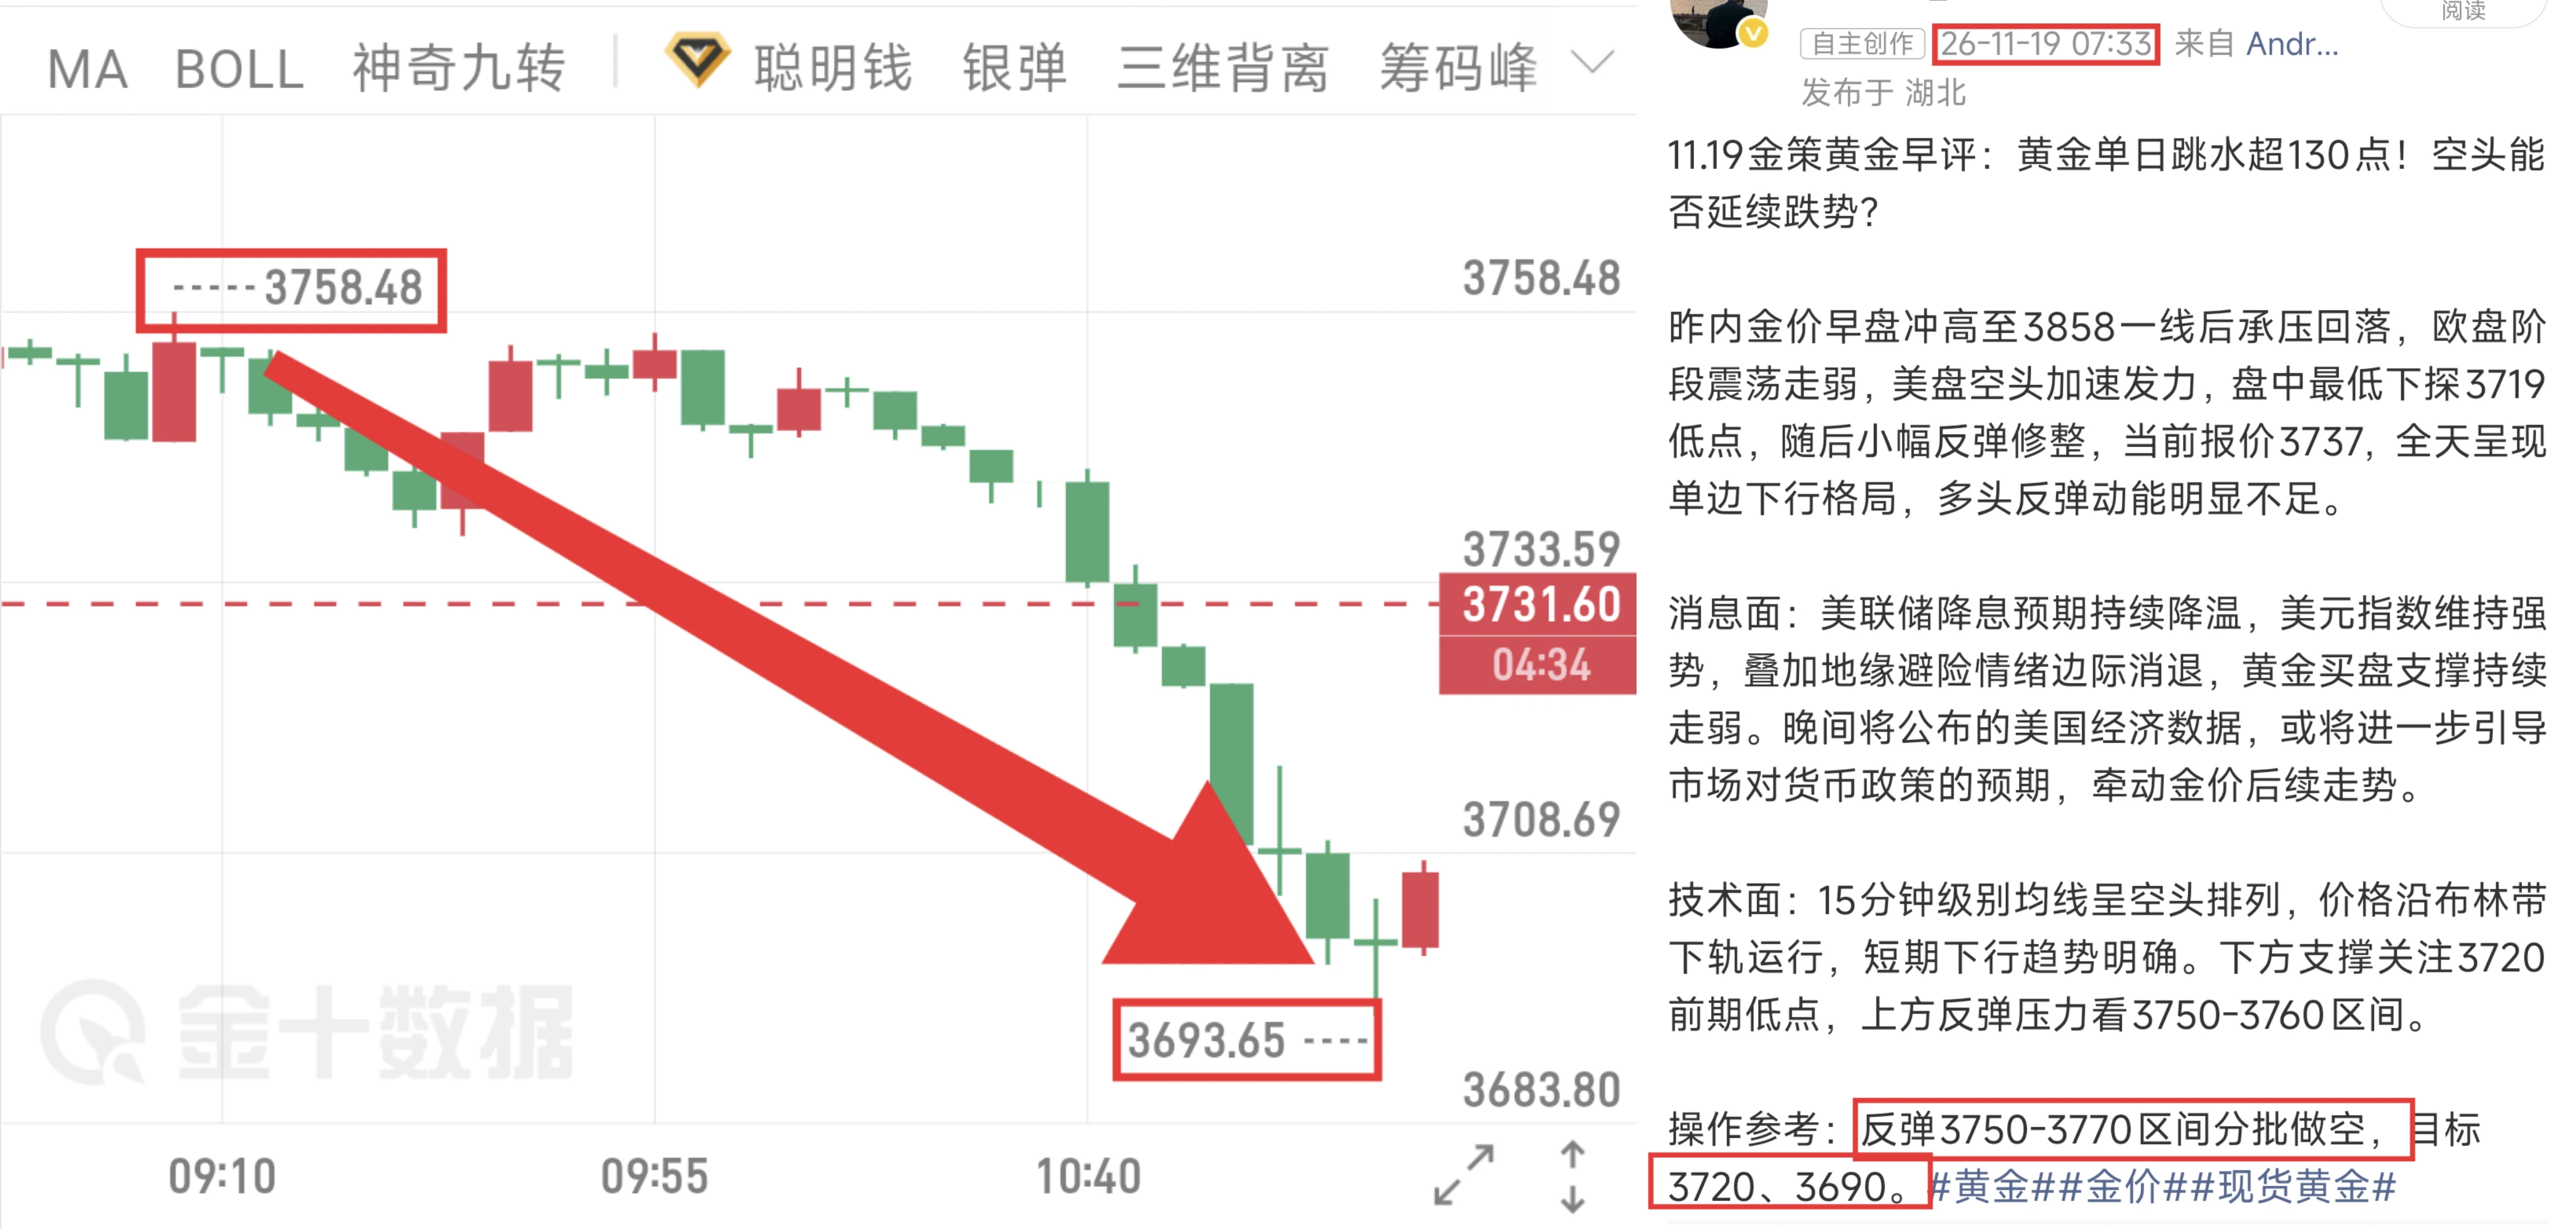
The morning alert called for scaling into shorts in the resistance zone; the target broke through to 3693, delivering a 65-point move!$XAU #GTA6相关Meme币暴涨381倍 #黄金 ‌
XAU+0.38%
Whether Jensen Huang returns to Nvidia no longer matters. Even AI infrastructure companies represented by Nvidia no longer matter. The new leader of the AI market, ANT, will emerge today.
With ANT’s listing, the model layer now has a public-market valuation anchor. This will catalyze the AI market’s expansion from infrastructure to leading model companies and then to application-layer companies.
post-image
NVDA-2.97%
🚨 Gold and silver are facing a massive sell-off!
Gold drops below $3,745, while silver falls under $45.
Around $800 BILLION in combined market value reportedly wiped out today.
Even traditional safe havens aren’t safe from this market volatility.
XAU+0.38%
XAG+0.47%
  • 2
  • 1
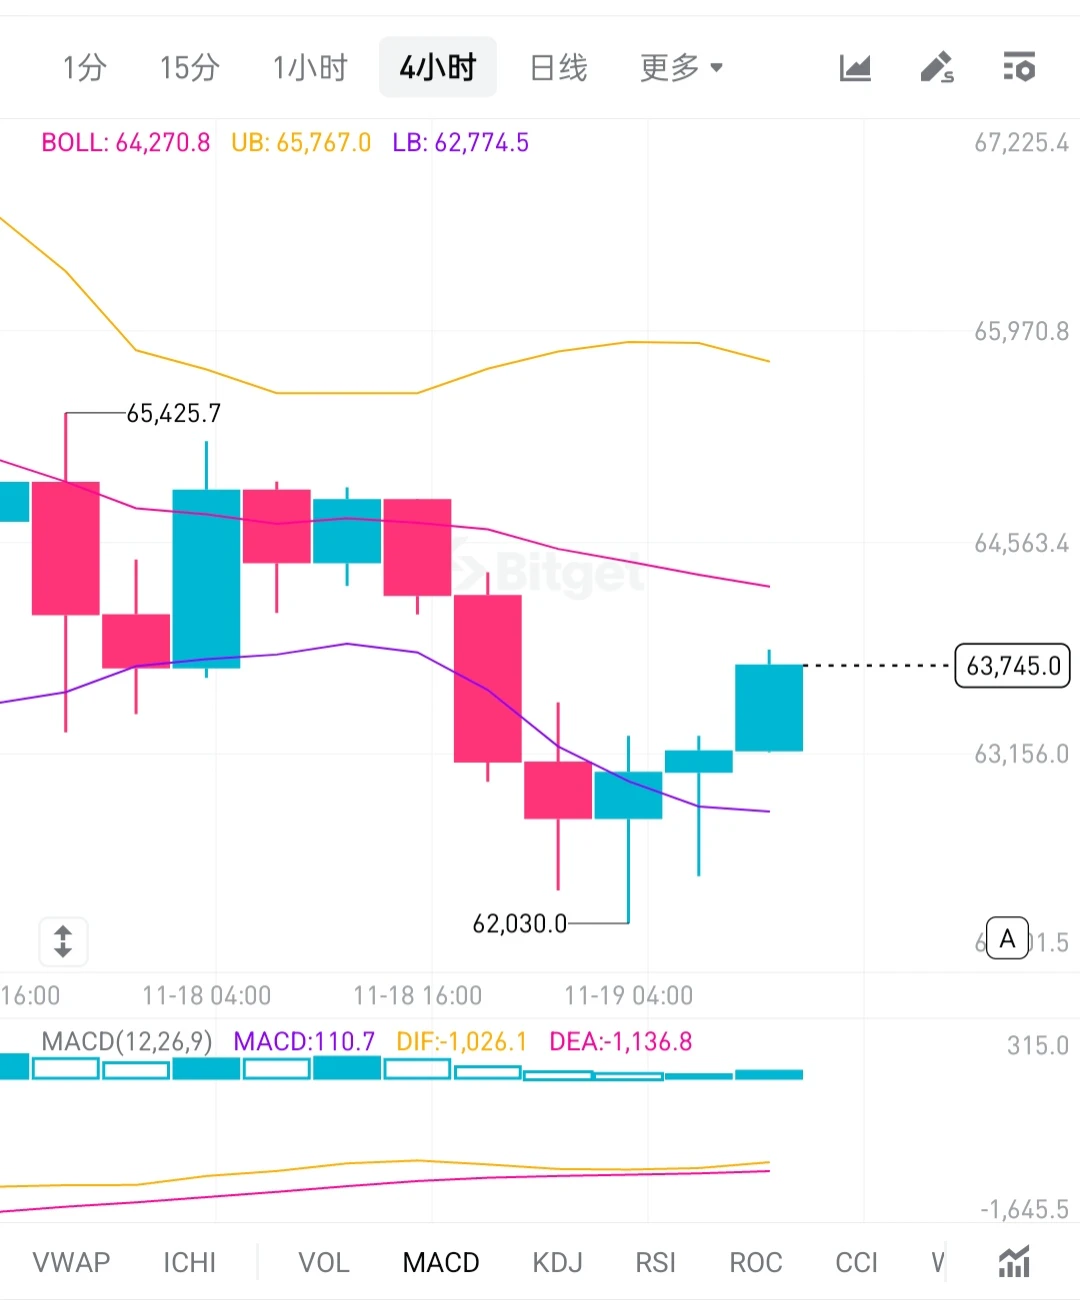
BTC on the afternoon of 11/19:

On the 4-hour chart, the current price is between the middle and lower Bollinger Bands. After testing the 62030 area, it staged a rebound from the lows. The MACD shows DIF still below DEA and in negative territory, but the green bars have narrowed, indicating slowing downward momentum and signs of a corrective rebound. However, no golden cross has formed yet, and the reversal lacks strength. The first resistance above is the middle Bollinger Band. The key support below is the previous low near 62030; if it fails, the downtrend is likely to resume.

Trading sugge
post-image
BTC-0.67%
The early analysis laid out a strategy of shorting the rebound. Price fell from 3758 to 3693, capturing 65 points of profit! $XAUT
post-image
XAUT+0.30%
Tether Fires Back at S&P Over Its USDT Rating! With Both Sides Disagreeing on Stablecoin
live-cover
LIVE2,497
#Analytics

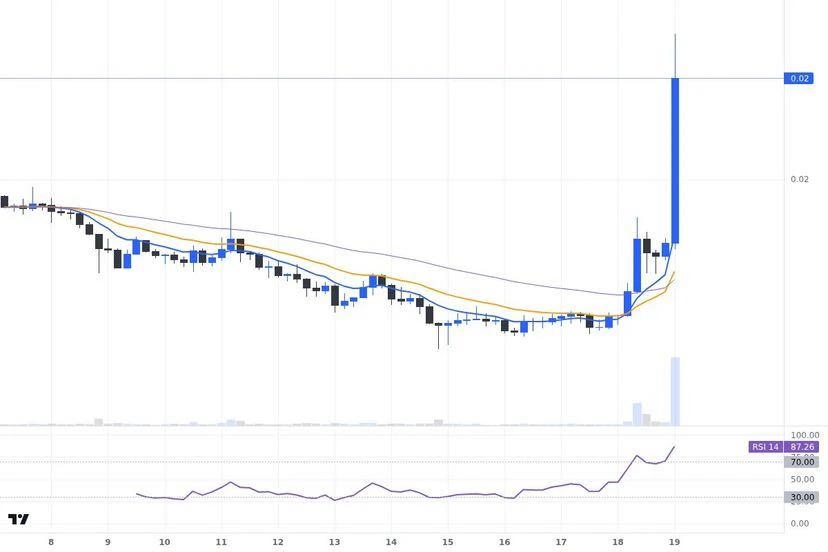
#IRYS Sharp rise with overheating and unusually high volume

IRYS is at $0.02386 after rising 61.11% in 24 hours. The move is accompanied by unusually high activity: the volume of the last closed four-hour candle is 25.33 times higher than the average volume of the previous twenty candles. This is a strong argument in favor of the strength of the current move.

At the same time, the 14-period RSI on the four-hour chart is 89.9: the price is already in deeply overbought territory. The assessment is mixed: the rise is supported by volume, but such a high RSI makes the risk of a sharp
post-image
IRYS-22.27%
For the annual streamer awards, please vote for Xiaomolun Trends and show your support. Thank you. https://www.gate.com/zh/competition/Annual-Gala
post-image
  • 1
  • 2
Load More

Join 40 M users in our growing community

⚡️ Join 40 M users in the crypto craze discussion

💬 Engage with your favorite top creators

👍 See what interests you

Trending Topics

FedMayNeedA50bpRateHike

383.7K Views2.1K Discussing

Minutes from the Fed’s October meeting showed that while officials kept rates unchanged, “almost all” policymakers still believed further rate hikes would be needed if the economy evolved as expected. More importantly, a few officials said that if inflation remained too high, the Fed could even need a 50bp hike at a future meeting. Recent inflation data have already moved closer to that kind of trigger. The market is no longer just debating whether the Fed will hike again, but whether it may need to move faster. Do you think a 50bp hike will start getting priced back in? If hawkish expectations keep rising, which faces more pressure: $BTC or U.S. equities?

3LaunchPoolsNowLiveWithGenerousRewards

971.8K Views34.9K Discussing

AnthropicIPOPricesAt83

497.9K Views4K Discussing

View More