Share crypto content and earn up to 60% commissions through content mining.
placeholder
gatefun
[$H Signal] Long + 1H Breakout Momentum
$H 1H-level breakout, order book buy-side depth ratio 2.08, RSI 66.56.
🎯Direction: Long
⚡Entry/Order: 0.0798 - 0.0800
🛑Stop loss: 0.0792
🚀Target 1: 0.0812
🚀Target 2: 0.0818
🛡️Trade Management:
- Execution strategy: After reaching Target 1, reduce the position by 50% and move the stop loss up to breakeven. If the price falls back to the entry level, exit automatically to protect the principal.
Depth logic: The 4H MACD histogram is 0.0023, with bullish expansion. The upper Bollinger Band at 0.0783 has been broken, and the current price is hugging the
BTC0.54%
NVDA1.86%
View Original
post-image
  • Reward
  • Comment
  • Repost
  • Share
Silver$XAG /USDT 4-hour short signal: Is 68.68 a trap or the starting point?

XAG_USDT - SHORT

Trading plan:
Entry: 68.55 – 68.81
SL: 69.90
TP1: 67.76
TP2: 67.15
TP3: 66.23

Why pay attention to this setup?
- The data speaks: 4-hour SHORT signal, with 55.4 confidence and a clear direction.
- Key levels: Current price 68.68, resistance at 68.81 above (EMA resistance), and support at 68.55 below (entry low).
- Why now? The 15-minute RSI has reached 63.84, indicating short-term overbought conditions. The 1-hour ATR at 0.51 shows expanding volatility, and the pullback window is open.
- Clear t
XAG0.66%
View Original
post-image
post-image
  • Reward
  • Comment
  • Repost
  • Share
#BessentPlansToShakeBondBears
Bessent is taking a much more active approach to the Treasury market, and the real battle is happening at the long end of the curve. U.S. Treasury Secretary Scott Bessent has doubled planned buybacks of 10- to 30-year Treasuries to at least $4 billion per operation beginning in September, while also signaling that the size could go higher. The objective is clear: improve liquidity, support long-duration bonds and push back against the recent rise in long-term yields.
The market reaction shows why this matters. The initial announcement triggered a sharp drop in lo
TLT0.29%
post-image
  • Reward
  • Comment
  • Repost
  • Share
$VELVET 500/k long liq
VELVET-18.96%
post-image
  • Reward
  • Comment
  • Repost
  • Share
This trend is so obvious I don’t even need to think—the account is dancing on its own. 💃
While everyone else was still watching from the sidelines, $LINK moved sideways at the bottom around 9.423. I watched money quietly flow in. Although volume wasn’t large, someone stepped in to buy every dip. At that level, I went long directly, without the slightest hesitation. The market was quiet then, but I could smell the opportunity.
Now the price has risen to 11.538, with a +1593.73% return—waiting it out wasn’t in vain. This profit feels great, but discipline must not be abandoned: Take profit on 8
LINK0.54%
ZEC-1.85%
DOGE-0.07%
View Original
post-image
  • Reward
  • Comment
  • Repost
  • Share
$OTHERS $ALTS
200B strong resistance and we've spent 218 days below the red range. Break above would be a true statement for bulls but we've seen nothing yet despite the euphoria all over X.
post-image
  • Reward
  • Comment
  • Repost
  • Share
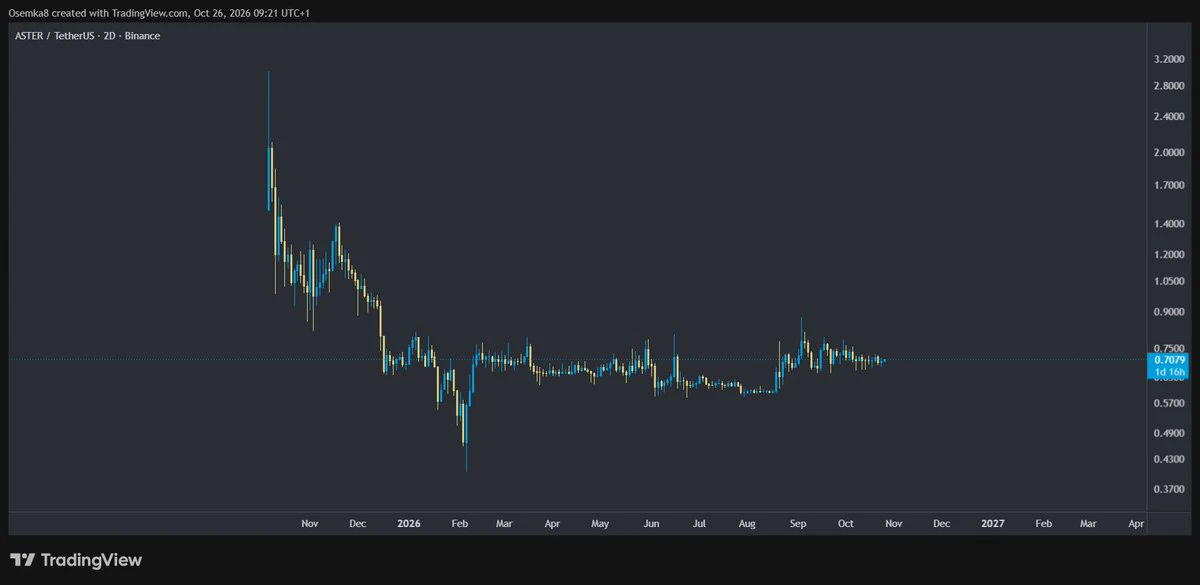
$ASTER
Ripping from 0.5789, now pressing 0.7775. MAs stacked—price above all three. Break above triggers continuation; rejection retests 0.7071. Momentum strong—watch for the close.
Entry Zone: 0.7015 – 0.7020
TP1: 0.7184
TP2: 0.7775
TP3: 0.8000
Stop-Loss: 0.6700
#ASTER #BTCBreaks$81k #CandyDrop1BTCForOldUsers #TopFiveLeaguesPreMatchPredictor #NVIDIAEarnings
ASTER4.64%
post-image
  • Reward
  • 4
  • Repost
  • Share
ELIX:
looking forward keep it up
View More
Lacking perspective, can't hold on. The profits on this move are as thin as paper, but I love it. 😏 Before the market had fully started moving, I was already waiting for this level. The rebound right after the early-session dump looked fake no matter how I looked at it: low trading volume, insufficient support, and weakness on the way up. Not taking a short in this setup would have been a waste of the market move.
$ZBT Opened a short at 0.12722, now at 0.07804, directly handing me +1859.01% in gains. This move was the market being in a good mood and casually scattering a few gold coins, whic
ZBT1.15%
SOL3.04%
SNDK0.74%
View Original
post-image
  • Reward
  • Comment
  • Repost
  • Share
$HANA Signal】Long + momentum continuation after breaking above the 4H upper band
$HANA RSI 1H 68.69, price at 0.0205 broke directly through the 4H Bollinger upper band at 0.0199. The 4H MACD bullish histogram is expanding, while the 1H histogram is contracting and volume remains elevated. The order book Bid/Ask ratio is 1.13, with buyers holding a slight advantage; depth imbalance is only 6.27%, indicating average buying support.
🎯Direction: Long
⚡Entry/limit order: 0.020439 - 0.020500
🛑Stop-loss: 0.020295
🚀Target 1: 0.020807
🚀Target 2: 0.020961
🛡️Trade management:
- Execution strategy:
HANA24.84%
BTC0.58%
ETH0.18%
SOL3.12%
NVDA1.86%
View Original
post-image
  • Reward
  • Comment
  • Repost
  • Share
#XAU
XAU/USD: Gold Is Testing the $4,700 Wall After a Powerful August Rally
Gold is trading around $4,622/oz after briefly reaching a fresh three-month high near the psychologically important $4,700 area. Tuesday’s pullback of roughly 0.6% looks more like profit-taking after an aggressive rally than a confirmed trend reversal. The bigger picture remains constructive, with gold having climbed sharply over the past several sessions and futures gaining about 6.3% across the four sessions through Monday.
The current structure is bullish, but stretched. Price has moved rapidly from the lower-$4,00
XAU0.15%
post-image
  • Reward
  • Comment
  • Repost
  • Share
#GateStockInsightsChallenge $SNDK
🚨 SNDK's correction is a test — and I am watching the buyers.
SanDisk has experienced another major pullback, closing August 24 at around $1,493.12, down 6.45%, after reaching an intraday low of approximately $1,416.56. The selloff spread across the memory-chip sector, making this much more important than a single-stock correction.
But my conclusion is different from simply calling the sector bearish.
I believe the market is currently testing whether the enormous AI-memory rally can justify its valuation.
SanDisk still has impressive fundamentals. FY2026 r
SNDK-0.35%
post-image
Yusfirah
#GateStockInsightsChallenge $SNDK
🚨 SNDK's correction is a test — and I am watching the buyers.
SanDisk has experienced another major pullback, closing August 24 at around $1,493.12, down 6.45%, after reaching an intraday low of approximately $1,416.56. The selloff spread across the memory-chip sector, making this much more important than a single-stock correction.
But my conclusion is different from simply calling the sector bearish.
I believe the market is currently testing whether the enormous AI-memory rally can justify its valuation.
SanDisk still has impressive fundamentals. FY2026 revenue reached around $20.25B, up approximately 175% YoY, while data-center revenue jumped 437%.
That gives the long-term story credibility.
But the chart is currently asking for patience.
My most important level is $1,400–$1,450.
If SNDK holds this area, forms a higher low and reclaims $1,500–$1,535, I would see the correction as potentially transitioning into accumulation.
Above $1,600, my bullish conviction increases.
My targets:
$1,650 → $1,800 → $2,000
If momentum becomes extremely strong again, I would reassess higher targets rather than blindly predicting them today.
My downside plan is equally clear.
If $1,400 fails decisively, I step back.
If the broader memory sector continues falling together, I reduce risk.
If buyers return, I scale in.
This is my experience-based approach: I don't need to catch the exact bottom. I need to identify a level where the potential reward is worth the risk.
So, is the SNDK drop an opportunity?
Potentially yes.
Is it safe to buy immediately?
No.
The opportunity becomes more attractive when support holds and the price confirms a recovery.
That is the setup I am waiting for.
My current sentiment:
Short term — cautious.
Medium term — cautiously bullish.
Long term — constructive on AI-driven storage demand.
SNDK remains one of the most interesting names in the memory-storage sector, but today's market is teaching us an important lesson:
A strong company can still be a bad trade at the wrong price.
I want the right company, the right level and the right risk/reward.
For me, the roadmap is clear:
$1,400–$1,450 support → $1,535 recovery → $1,600 breakout → $1,650 → $1,800 → $2,000.
Now I am waiting to see which side wins: the sellers defending the correction, or the buyers who believe the AI-storage story is still only getting started.
#MemoryStocks #StockInsights
repost-content-media
  • Reward
  • Comment
  • Repost
  • Share
‍# GateStockInsightsChallenge 📈🔥
The # # GateStockInsightsChallenge brings a new opportunity for the community to share stock market ideas, research, analysis, and valuable insights. 📊💡 It’s a great way to explore market trends, discuss interesting companies, and exchange perspectives with other traders and investors. From earnings and valuations to sector movements and market sentiment, every well-researched insight can help create a stronger and more informed trading community. 🚀
Whether you focus on technology, AI, semiconductors, finance, consumer stocks, or emerging market opportunit
post-image
post-image
  • Reward
  • Comment
  • Repost
  • Share
$CYS Signal】Long + 1H breakout above the upper Bollinger Band
$CYS RSI 1H 71.69, tracking along the upper Bollinger Band at 0.6835. The 4H MACD histogram expanded to 0.0137, with bullish momentum still being released. Order book imbalance is -4.38%, with sell-side orders slightly heavier, but the price has closed above 0.67 consecutively, indicating effective support at lower levels.
🎯 Direction: Long
⚡ Entry/Limit order: 0.678558 - 0.680600
🛑 Stop-loss: 0.673794
🚀 Target 1: 0.690809
🚀 Target 2: 0.695913
🛡️Trade management:
- After reaching Target 1, reduce the position by 50% and move
CYS12.36%
BTC0.58%
ETH0.18%
SOL3.12%
NVDA1.86%
View Original
post-image
  • Reward
  • Comment
  • Repost
  • Share
#HOOD
HOOD — The Real Battle Is Between $100 and $110
HOOD is showing a much more interesting structure after last week’s explosive move. The stock jumped sharply into the $109–$110 area, then pulled back toward $103. The important part is that the rally was accompanied by unusually heavy volume, which means genuine market participation was present. But the following pullback also shows that sellers are still active near the recent highs. Right now, HOOD looks like a stock trying to prove whether that breakout has enough strength to continue.
The $100 area has become the key psychological ref
HOOD7.30%
post-image
  • Reward
  • 2
  • Repost
  • Share
FenerliBaba:
To The Moon 🌕
View More
JUST IN: 🇨🇳 China warns US sanctions on Iran could disrupt the global economy.
post-image
  • Reward
  • Comment
  • Repost
  • Share
SNDK at 17x P/E: genuinely cheap or a value trap?
Guys, SNDK has fallen from 2354 to over 1400, and one figure really stands out—the trailing P/E has dropped to around 17x.
What does 17x mean? The S&P 500 averages 26x, while the tech sector averages 34x. For a company like SNDK, whose year-to-date revenue has grown 372% and whose gross margin has surged to 84.6%, its P/E is actually far below that of the broader market. It really does look like a huge bargain.
But here's what I want to say—there's always a reason something is cheap.
The first question: How long can an 85% gross margin last? Th
SNDK-0.35%
View Original
post-image
post-image
post-image
  • Reward
  • Comment
  • Repost
  • Share
🚨🇮🇳BREAKING: India's crypto hearing just got wiped off the calendar with zero replacement date
Official Lok Sabha notice:
>hearing was set for August 27, subject: "A Study on Virtual Digital Assets and Way Forward"
>sitting formally CANCELLED
>no new date given for the VDA session
>Committee's next sitting already booked for September 3, on direct tax reform, unrelated topic
India's been "about to clarify" crypto policy for years now
Watch whether this comes back in weeks or vanishes for months like it always does
post-image
  • Reward
  • Comment
  • Repost
  • Share
- $ETC is holding around $7.91 after a strong move toward $8.10.
- Buyers are still showing decent strength near support.
- A clean break above $8.10 could open the way higher.
- Watch $7.82–$7.90 as key support.
- Stay patient and avoid FOMO while waiting for confirmation.
ETC2.15%
post-image
  • Reward
  • Comment
  • Repost
  • Share
Market prediction
gate liveLIVE
1,057
live-coin
  • Reward
  • Comment
  • Repost
  • Share
Load More

Join 40 M users in our growing community

⚡️ Join 40 M users in the crypto craze discussion
💬 Engage with your favorite top creators
👍 See what interests you
  • Pinned