Square
Following
Hot
News
Notifications
Profile
Share your thoughts
placeholder
Article
#BitcoinUnderPressure #ShareWeekly

Bitcoin Below $74K: Temporary Correction or the Beginning of a Deeper Market Downtrend?

The cryptocurrency market is facing renewed selling pressure as stronger-than-expected U.S. inflation data and increasingly hawkish Federal Reserve expectations weigh on investor sentiment.

Bitcoin has slipped below the $74,000 level, while rising Treasury yields and a stronger U.S. dollar are creating additional pressure across risk-sensitive assets.

The latest developments have changed the market narrative. Investors who were previously expecting easier monetary poli
post-image
BTC-0.65%
XAU+0.38%
  • 2
All the short positions in last night's livestream made a profit; we almost got into the ZEC short, though—otherwise, the short trades would've been perfect
post-image
ZEC+1.29%
Trenches
Max
M
bade
b
Max
5qaP...pump
Market Cap
$.
Change
.
24h Vol
$.
Holders
.
mihao
m
bade
b
mihao
4Cxj...pump
Market Cap
$.
Change
.
24h Vol
$.
Holders
.
AGT
A
bade
b
AGT
0x5d...e274
Market Cap
$.
Change
.
24h Vol
$.
Holders
.
DacityCoin
D
bade
b
DacityCoin
DKYc...pump
Market Cap
$.
Change
.
24h Vol
$.
Holders
.
Max
M
bade
b
Max
HPSp...h53z
Market Cap
$.
Change
.
24h Vol
$.
Holders
.
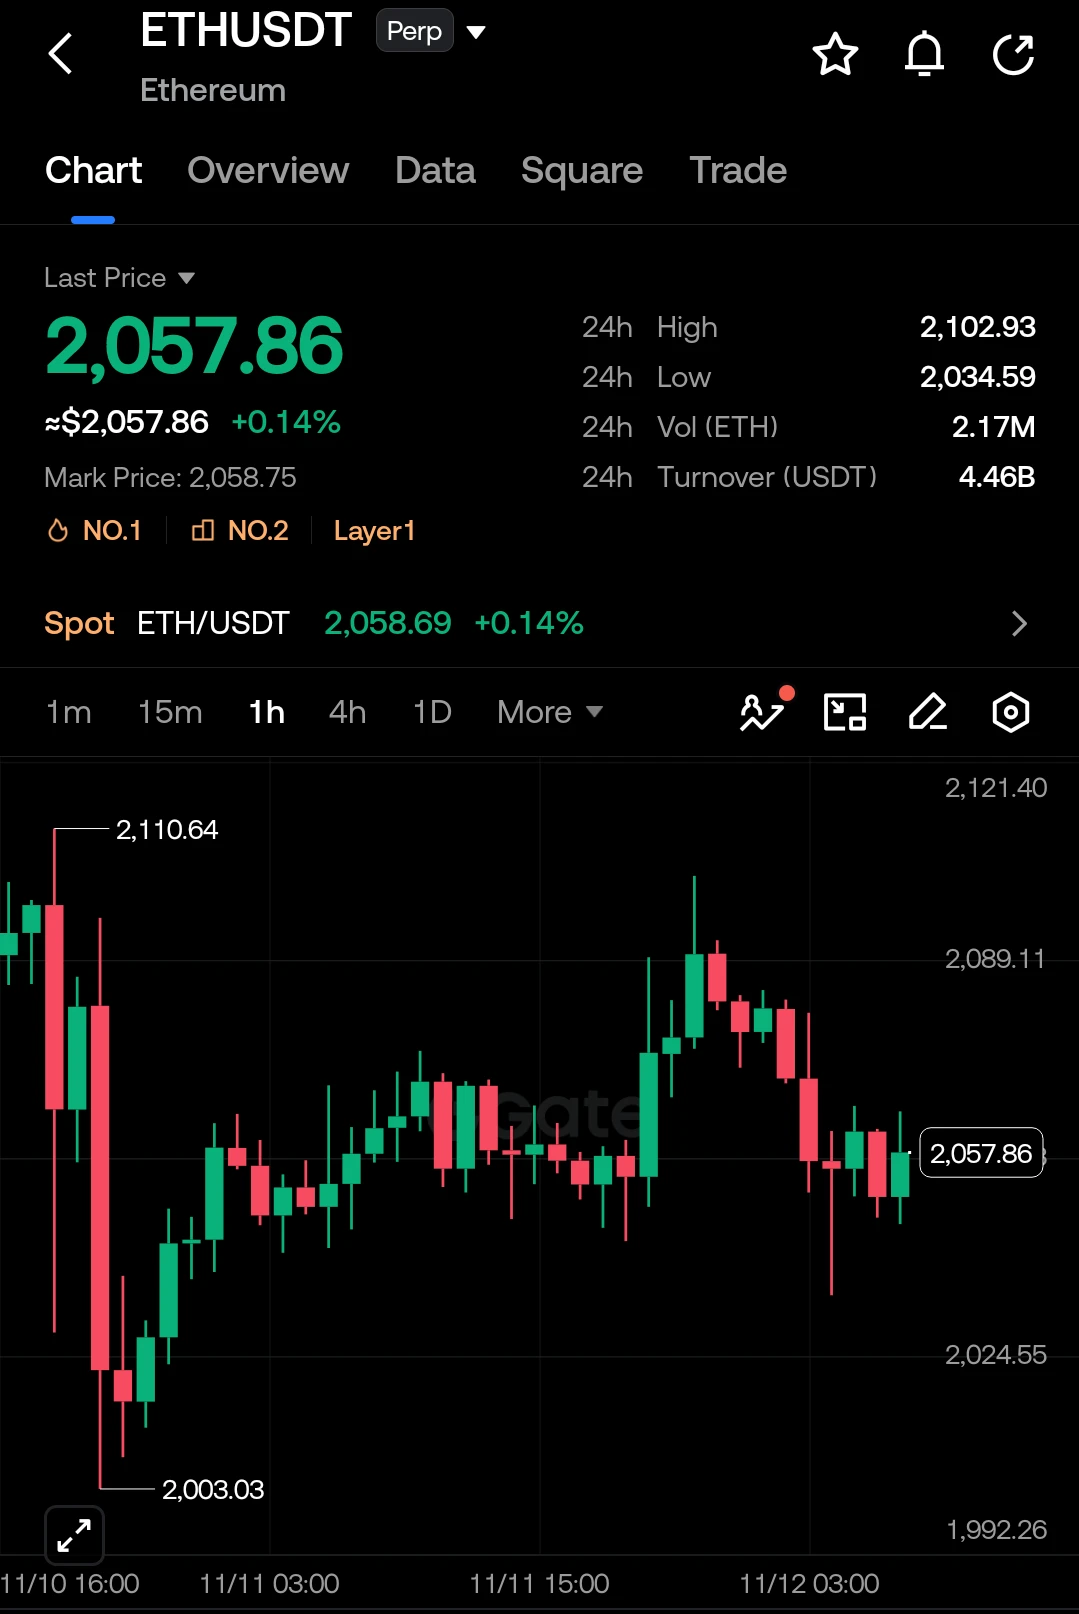
✅ ETH2026.11.12 09:00 Beijing time

Disclaimer: For technical chart reference only; this is not investment advice

【ETH | Short-Term Strategy】
Current price: 2061.16
Timeframes: 1-hour to determine direction | 15-minute for candlesticks | 1-minute for entry
Pivot: 2088.37
✅ Long: Go long if price stabilizes near 2043.81 on a pullback, target 2070 - 2088.37, stop-loss below 2038
❌ Short: Go short if price meets resistance at 2088.37 on a rebound, target 2040 - 2035.70, stop-loss above 2094
Profit/loss target: $15–$20

Note: A modest recovery and consolidation at low levels, with clear resistanc
ETH-1.26%
$ETH | 1h | Range Support Retest

Bias: Long

Entry Zone: 2,045 to 2,055
Stop Loss: 2,028

Targets:
TP1: 2,075
TP2: 2,090
TP3: 2,110

Invalidation:
1H close below 2,028

$ETH
post-image
ETH-1.23%
Market Update

Bitcoin ETF outflows are slowing, while stablecoins continue to contract.
Claude is about to IPO, and a December rate hike is all but certain.
Overall, the market outlook for at least the next month is not very positive.

Bitcoin fell below the 75,000 support level due to the Lao Huang affair scandal.
It has found some support at 72,000 for now, but remains shaky.
If it doesn't hold, 70,000 is the next level to watch.

With the market this bad, how can you make money in the secondary market?

The first method, and the most conservative:
Dollar-cost average over the long term, bu
post-image
BTC+1.22%
BNB-0.76%
HYPE+0.24%
UNI+3.05%
PUMP-1.06%
  • 1
Good morning!
On January 12, according to The Washington Post, the White House will not intervene in the Nvidia (NVDA.O) board’s decision regarding Jensen Huang.
NVDA+2.99%
Great, $NIGHT has turned green again. It rose and formed an upper wick at 048, which is still acceptable. Looks like a bearish signal has appeared, so I’ll take another small short position 😍😍😍$AGT $KGEN 😍😍😍
post-image
NIGHT-3.10%
AGT-26.77%
KGEN-5.46%
$SNDK Positioning for another large-scale short. Thank me later. Stop-loss: $1030 Take-profit: $830 Short now $SNDK 👇
post-image
SNDK+13.75%
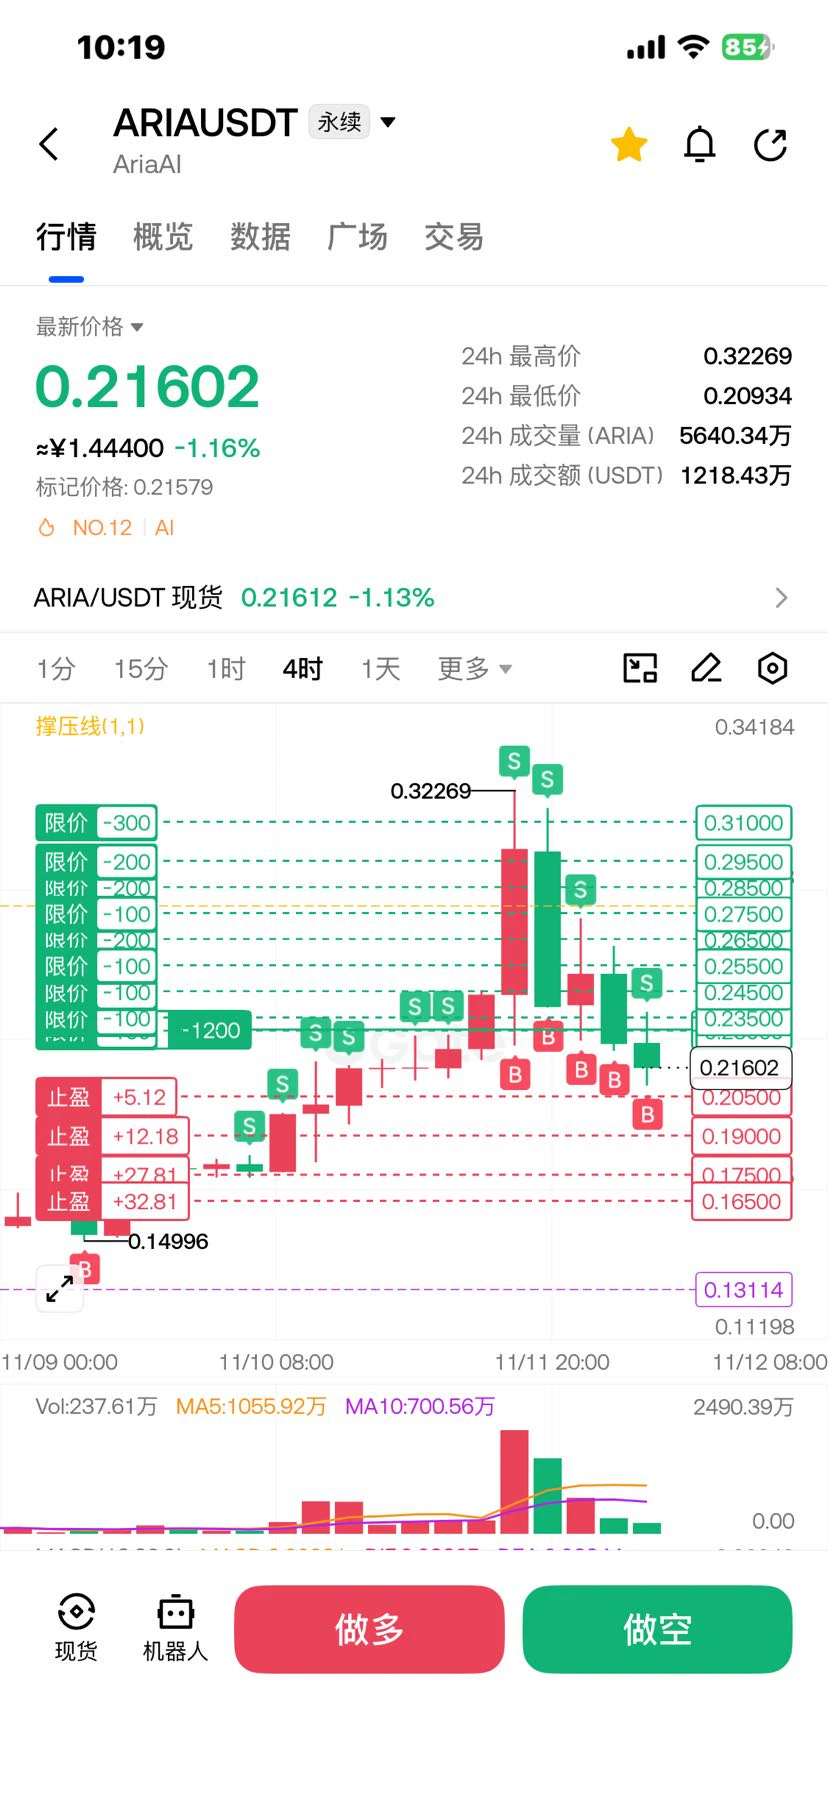
$ARIA Mind your timing, short at the highs, add to your position layer by layer, and farm away
post-image
ARIA+22.03%
Yesterday’s market-order setup played out as expected, entering at 4066 and reaching 3968 for a 98-point move.

See the broader trend clearly; there’s no need to rush. Let the market confirm it over time.
TradFi
XAUUSD Today Up or Down
Up 51%
Down 55%
$95.6 24H
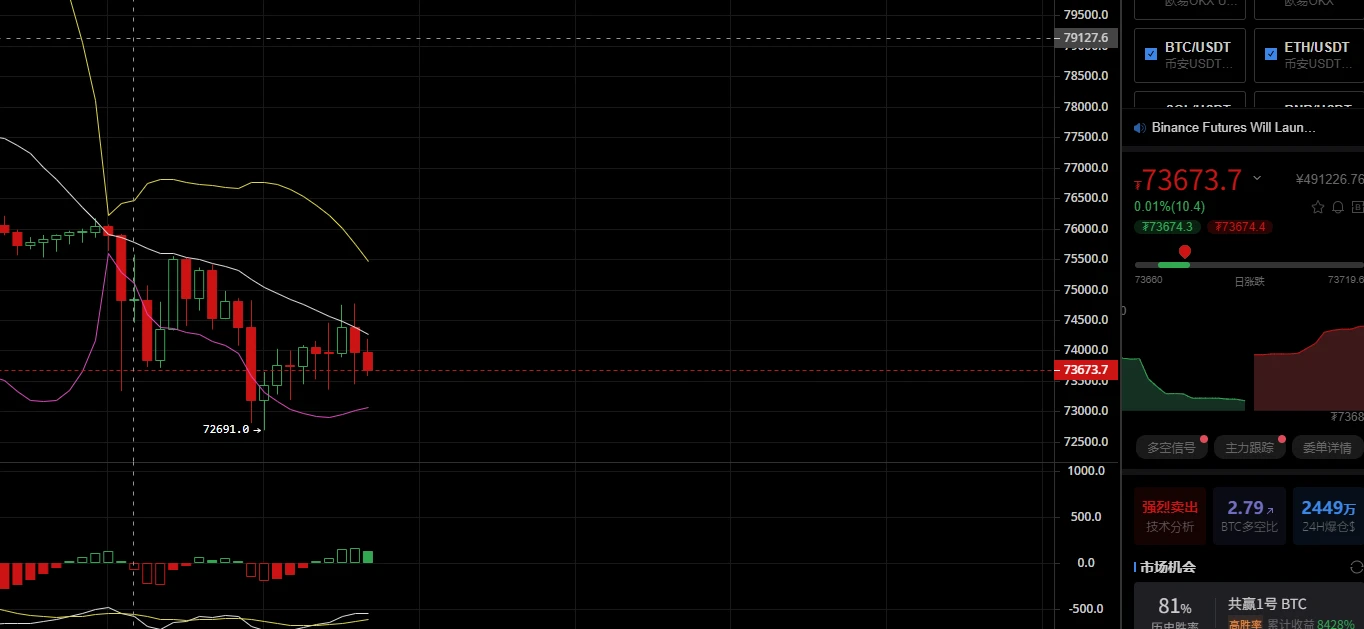
11.12 BTC Trading Setup
Market Analysis
BTC is currently at 73673. After bottoming at 72691 and completing a rebound recovery, it is once again facing resistance and pulling back. The candlesticks have turned downward, the moving average system is capping price gains, and short-term bullish momentum has faded. The indicators on the right signal a strong sell, with bears regaining the upper hand. This is a second retest following the end of the rebound.

Entry Zone

Short Entry Zone: 73750 - 74100
If the rebound reaches this resistance zone, place short orders in batches. Do not chase the decl
post-image
BTC-0.65%
Does the law ultimately protect the weak or the strong? What do you think @grok
post-image
Sol market update
live-cover
LIVE1,895
ETH | 2070–2090 short setup, shared in advance yesterday.

The idea shared yesterday was clear: consider shorting ETH if it rebounds to the 2070–2090 range, with a stop-loss at 2110.

As I also said last night, the recent rebounds in BTC and ETH have been driven to a large extent by gains in U.S. stocks. This doesn’t mean the crypto market itself has fully strengthened.

Today, U.S. tech stocks such as NVIDIA and SanDisk pulled back, and ETH came under pressure as well.

That’s why I didn’t blindly chase longs yesterday, but instead chose to wait for a rebound to short.

Market correlations ar
BTC-0.65%
ETH-1.23%
Thursday, BTC short-term trading strategy
The current 4-hour chart is consolidating at elevated levels, with bullish and bearish candles alternating and no clear one-way trend yet established. Notably, the price has held above the Bollinger Bands middle line, while the KDJ indicator has continued rising after a golden cross. Bullish momentum is quietly building, laying the groundwork for a potential breakout.

On the 1-hour chart, the price briefly surged above the upper Bollinger Band, but the long upper wick clearly shows that selling pressure remains overhead, putting a near-term brake on t
post-image
BTC-0.67%
  • 1
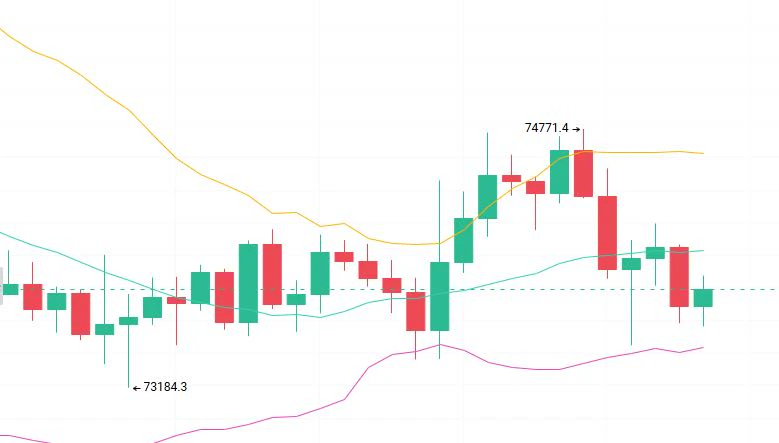
11.12 BTC Analysis

Analysis: Short near 74500-75000 on a rebound, with a stop at 75300. First target: 73700; second target: 73200.

On the 1H chart, the current price is 73706.5. Structurally, the price rebounded from a low of 73184.3, rising to a swing high of 74771.4, but then printed a high-volume long bearish candle and continued to pull back, falling below the cyan moving average again and forming a classic spike-and-reversal pattern. In terms of candlestick patterns, consecutive solid bearish candles formed during the pullback from the 74771 high, while rebound candles came on lower vol
post-image
BTC-0.67%
11.12 ETH Analysis

Analysis: Short the rebound near 2080-2100, with a stop at 2120. First target: 2040; second target: 2015.

On the 1H chart, the current price is 2057.40. Price rebounded from a low of 2013.40 to a high of 2103.62 before coming under pressure and pulling back below the cyan moving average. The yellow Supertrend resistance line is near 2090, with 2080-2100 forming a confluence resistance zone where trapped positions are concentrated. A rebound to this area could easily weaken again. The RSI is falling, and bullish momentum is insufficient, so shorting rallies is the preferred
post-image
ETH-1.26%
MSCI has finally swung the axe. The change takes effect after the close on November 30, kicking both US-listed Strategy and Japan's Metaplanet out of its indexes. The reason is straightforward: under the new framework, these companies count as non-operating businesses.
It's Wall Street's official stamp of approval: stop pretending you're tech software companies or industrial businesses—you’re just Bitcoin asset-management boxes wrapped in publicly listed company shells.
The harshest part isn't the rhetoric; it's the passive fund selling.
JPMorgan previously estimated that MSCI's removal of Str
post-image
MSCI+0.71%
BTC-0.67%
MSTR+1.10%
JPM+0.38%
The number of ZEC developers has doubled In two years
live-cover
LIVE2,737
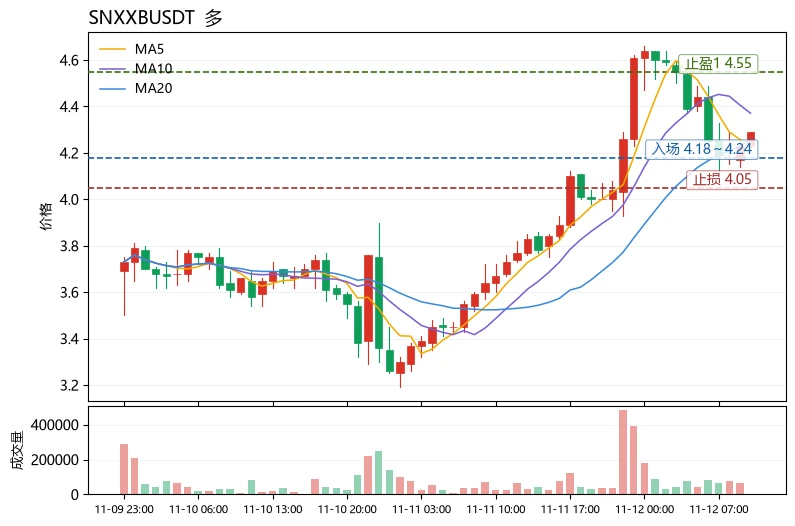
$SNXXB$SNXXB technical outlook: Short-term bullish, but this is a countertrend recovery rather than a trend reversal; buying on pullbacks is preferable to chasing highs. The current price of 4.29 is above MA5 (4.228) and near MA20 (4.255). Short-term moving averages are beginning to cross above medium-term ones, and the structure is shifting from weak to stable. RSI at 57.7 is neutral to strong, with room to rise. The MACD histogram at -0.04251 remains negative, so momentum has not fully turned positive, suggesting this rally is driven more by short covering. The Bollinger Bands [3.76053, 4.74
post-image
LINK-0.18%
QNT+4.79%
Load More

Join 40 M users in our growing community

⚡️ Join 40 M users in the crypto craze discussion

💬 Engage with your favorite top creators

👍 See what interests you

Trending Topics

GateIPOAccessAnthropic

245.61k Views2.28k Discussing

Gate IPO Access Phase 3 features Anthropic (ANT), with USDT subscription interest starting from 100 USDT. Successful allocations will be delivered as real shares to Gate Stock Accounts. Indicative price: $70–$78/share Subscription: Nov 12–17 (UTC+8) Allocation is not guaranteed. Please manage risk accordingly.

USOctoberCPIBeatsExpectations

139.75k Views2.89k Discussing

GateGlobalComplianceExpansion

53.2k Views468 Discussing

View More