Square
Following
Hot
News
Notifications
Profile
Share your thoughts
placeholder
Article
Everyone in the group is calling for a rally, so I’m going contrarian—precious metals’ market cap surged by over $600 billion in 90 minutes. That kind of move isn’t driven by retail; it’s safe-haven money rushing to get positioned. Stare at charts long enough and you start seeing what you want to see, but the numbers are right there this time—you can’t deny them. There’s only one question left: is this a short-term spike, or the start of a major capital rotation? Can $BTC reach a certain coin? We’ll know before that coin’s price point.
post-image
BTC-0.67%
$PIEVERSE It broke above the previous high. I’m adding to my short and continuing to short. The largest token unlock is on the 14th, with more than 86 million tokens. With several hundred million dollars in selling pressure, the unscrupulous market makers won’t push it much higher. If you didn’t go long at the bottom, look for an opportunity to short, with a stop-loss around 2
post-image
PIEVERSE+0.58%
Trenches
ZIG
Z
bade
b
ZIG
0x8c...1145
Market Cap
$.
Change
.
24h Vol
$.
Holders
.
牛逼
牛
bade
b
牛逼
0x96...7777
Market Cap
$.
Change
.
24h Vol
$.
Holders
.
BTC
B
bade
b
BTC
C5xp...pump
Market Cap
$.
Change
.
24h Vol
$.
Holders
.
STONK
S
bade
b
STONK
6GmA...UNgx
Market Cap
$.
Change
.
24h Vol
$.
Holders
.
ANSEM
A
bade
b
ANSEM
9cRC...pump
Market Cap
$.
Change
.
24h Vol
$.
Holders
.
$XPL The short signal is flashing. The current entry price is 0.05087, with an initial target of around 0.00012 before considering buying back in. This downtrend still has a long way to go, so don’t rush to buy the dip. $XPL
Risk warning: The above is solely a personal market view and does not constitute investment advice. Contract trading carries extremely high risks, so please manage your position carefully.
post-image
XPL-0.60%
$FOLKS I think this coin is rising. Buy at 2.410 and 2.365. Targets: 2.490, 2.530, and 2.574. Stop loss: 2.315
post-image
FOLKS+0.88%
Screenshots from the first round in Dabao's livestream room
  • 1
I called it when the crowd was at its loudest, and lost a few hundred followers afterward. ETH at 2.2K and BTC at 73K both hit, and it hasn’t even been two months—once again, I don’t have to leave crypto. With ETH at 2.7K and BTC at 87K, you still can’t bring yourself to short?
Are the haters still around? During this downturn, many streamers keep urging you to buy the dip and go long. Block and unfollow anyone giving you that advice—if they can’t even read the trend, why are they trading? #BTC闪崩插针
ETH-1.26%
BTC-0.67%
  • 4
$BTC and $ETH are heading into an important week. Tuesday, November 10: CPI and core CPI. Thursday, November 12: Jobless claims. Friday, November 13: PPI and core PPI. All are released at 8:30 a.m. ET. These data could shift expectations for Fed rate policy. Expect significant market volatility!
post-image
BTC-0.67%
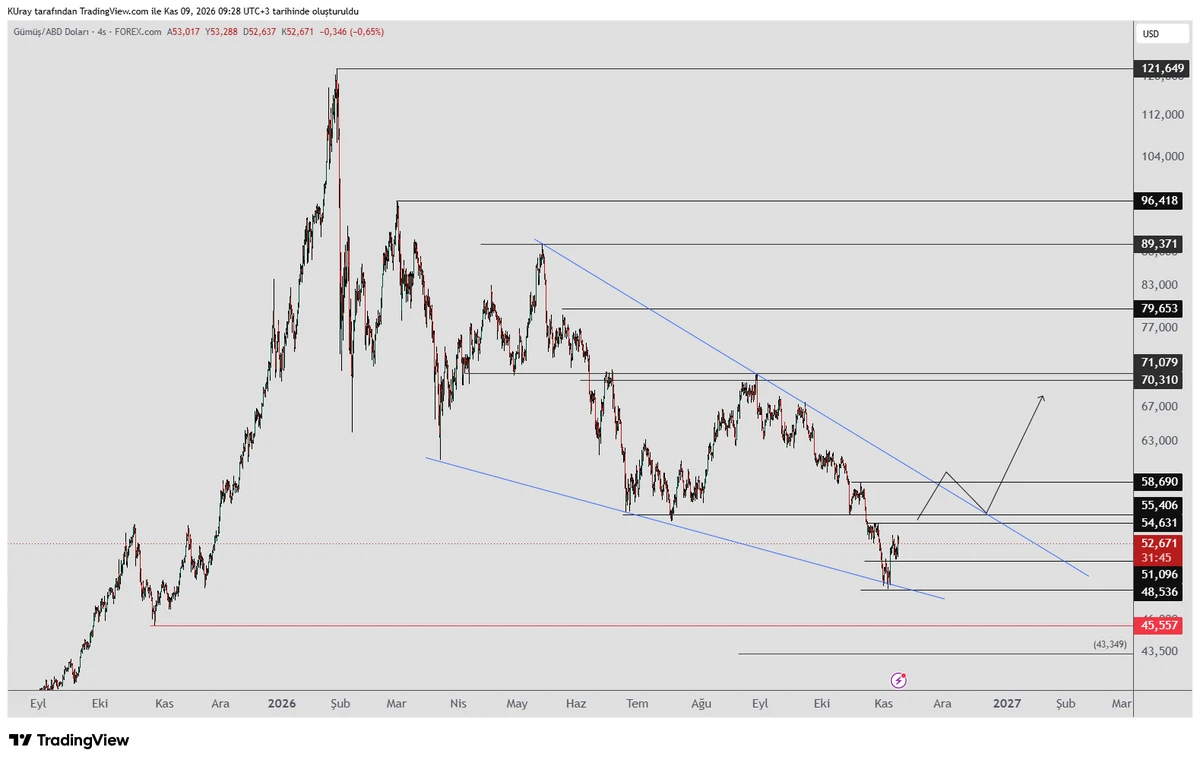
#xag #Gümüş Continues to hold the 48.5 low; we are following the wedge pattern.
After testing the 51 resistance it broke, the price rose again.
After the retest, it could rise toward the 54-55 resistance. If it closes above the 54-55 region, further upside is expected.
After that, we will watch the 59 level; if it closes above, the wedge’s upper edge will have broken, creating the possibility of testing higher resistance levels.
It could test the 62 and 70-71 regions.
On the downside, if it stays below the 48.5 low, the decline will continue and it could test the 45 and 43 levels.
post-image
XAG+0.47%
Good morning everyone ☀️
Today is @Enter_Elysium day
Are you ready to mint your NFT through @kalosfun ?
It is going to be a busy day
Wishing everyone a great week ahead
post-image
Can NVDA Still Be Held with Confidence? Three Risks for Nvidia Emerge Amid the Jensen Huang Investigation!

Nvidia remains a key player at the heart of the AI industry, but this incident reminds investors that even the strongest companies are not without risk.
After Jensen Huang acknowledged an extramarital affair, the board launched an independent investigation to determine whether he had ever been targeted by a foreign intelligence operation. As the news unfolded, NVDA fell around 2.2% at one point in after-hours trading.
Investors should watch three risks going forward.
First, management ri
NVDA+2.80%
  • 15
What Is Out-of-Sample Testing? Why Can’t You Repeatedly Use the Same Historical Data to Prove Your Strategy Works?

In cryptocurrency trading, some strategies perform exceptionally well in backtests but frequently fail once they enter the live market. One reason is that traders repeatedly use the same historical data to adjust parameters, eventually arriving at a set of trading rules that fit the past very well but may not fit the future.

To reduce this risk, it is important to understand a key concept: out-of-sample testing.

First, what is in-sample testing?

In-sample data refers to histor
post-image
BTC-0.67%
KAABBOOOMMMMMMM!!!!! 🍾🍾🍾🍾🍾🍾POST BIRTHDAY GIFT 🤪🤪🤪🤪
$WLD I know all too well that I picked the wrong coin when I bought into you, but there’s been no turning back for a long time.
It’s not that I don’t know when to cut my losses; I’m just caught between a rock and a hard place.
Moving forward, I can’t see a future; turning back means falling into an abyss.
Things have never turned out the way I wanted, and I brought it all on myself.
I went off course long ago, but I refuse to admit defeat and keep pressing on.
So much in this world is beyond our control.
It seems like it shouldn’t be this way, yet it can only be this way.
I often wonder: if I
WLD-5.61%
  • 1
XRP market update
live-cover
LIVE1,888
#70%OfAltcoinsFallBelow200DMA $XRP $SOL #ShareWeekly
Seven out of ten altcoins below their 200 day average sounds like a clean bearish signal. Before I react to it, I want to understand what the number really measures, because I think it says less than it appears to.

What the indicator measures

The 200 day average is the average closing price over the last 200 days, and traders use it to separate long uptrends from downtrends. The reading counts how many altcoins on a large exchange sit below that line. It is a yes or no test. A coin that is 1% under the line counts the same as a coin that
XRP-1.12%
SOL-0.74%
AI Stocks Plunge, but Tech Giants Say Demand Hasn’t Disappeared! Is This AI Sell-Off an Overreacti
live-cover
LIVE3,324
Will housing prices keep slowly declining? An analysis from a trading perspective
Hello everyone, welcome to Uchiha's short-term real estate analysis. Does it seem strange to see real estate analysis on a crypto platform? But I think it's quite interesting. Trading platforms let everyone speak freely about their views on finance.

For us Chinese, housing is an asset that simply cannot be ignored. People always hope to own a home when they're young, so they can get married, have children, educate them, retire, and even benefit from the home's financial and social attributes.

First, in China, a
post-image
GLDX-0.40%
PAXG+0.37%
11.9 ETH Midday Market Analysis$BTC $GT $ETH

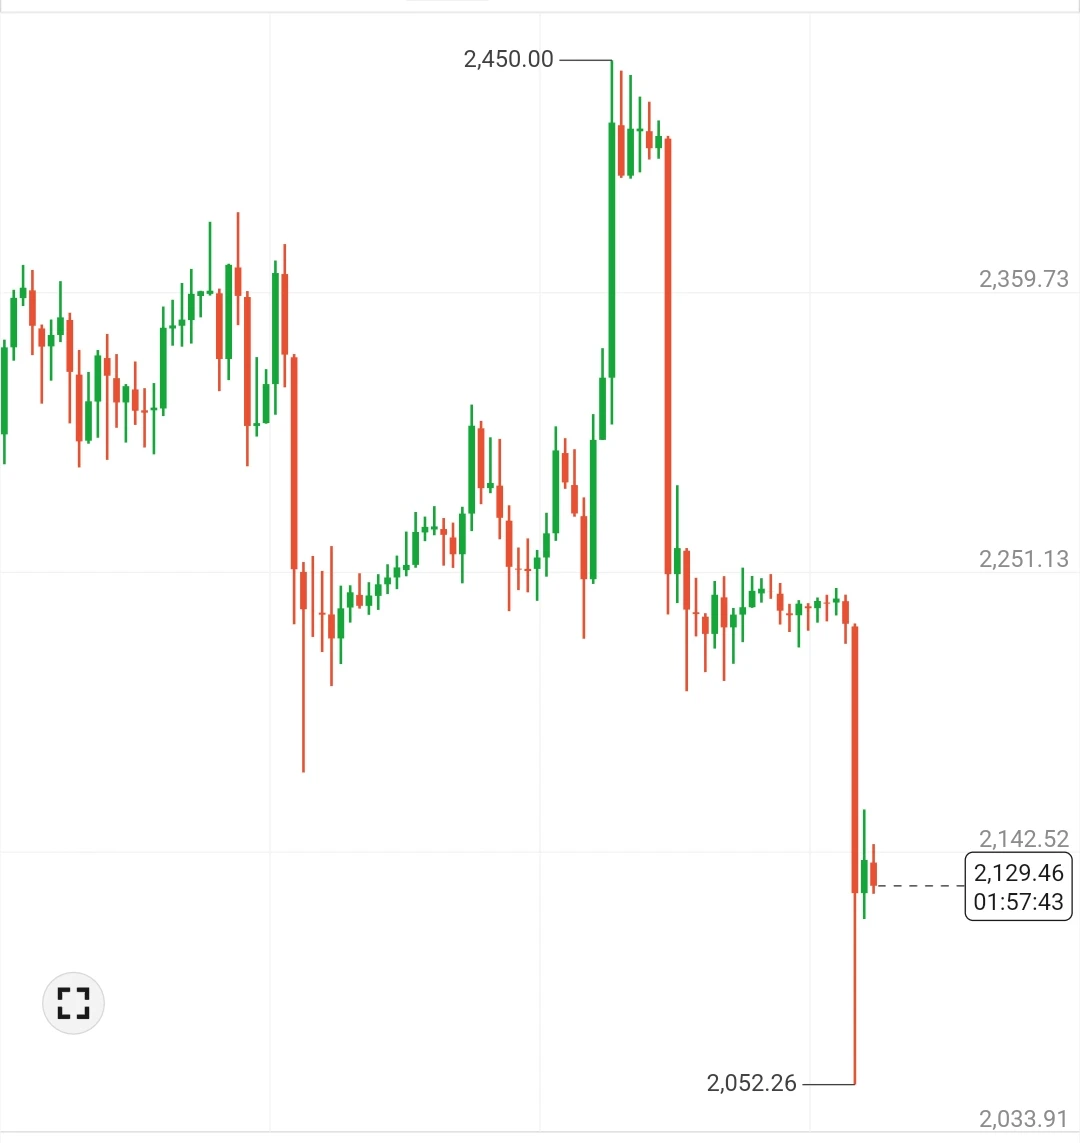
Ether has pulled back from its high of 2450, with four consecutive bearish 4-hour candles, breaking through the 2280 and 2200 support levels in succession and dipping to around 2050 at its lowest. The short-term structure has clearly weakened. However, after the sharp drop, signs of a low-level recovery have emerged on the 15-minute timeframe, and bearish momentum has been released quickly. The key now is not whether support has been broken, but whether the price can reclaim that level afterward—if it gets back above 2200, this sell-off can be con
post-image
BTC-0.65%
GT-2.24%
ETH-1.23%
What Is a Monte Carlo Simulation? Why Can a Positive-Expectancy Strategy Still Lose Consecutively?

In cryptocurrency trading, even if a strategy has been backtested and has positive expected returns, that does not mean live trading will necessarily go smoothly. Consecutive losses and maximum drawdowns exceeding expectations may cause traders to abandon an otherwise effective strategy prematurely. Monte Carlo simulation is one method that can help us study these risks.

First, what is Monte Carlo simulation?

It repeatedly generates a large number of possible trading outcomes and examines the
post-image
Load More

Join 40 M users in our growing community

⚡️ Join 40 M users in the crypto craze discussion

💬 Engage with your favorite top creators

👍 See what interests you

Trending Topics

USCPIDataIncoming

26.7k Views1.76k Discussing

The U.S. October CPI report will be released on November 10 at 8:30 a.m. ET. September CPI came in at 3.7% year over year, and markets will be watching closely for signs that inflation is cooling, especially in core CPI. A softer-than-expected reading could strengthen rate-cut expectations, while hotter inflation may pressure risk assets through higher Treasury yields and a stronger dollar. How do you think this CPI print will move $BTC, U.S. stocks and gold?

RedBullDoublePodiumInBrazil

1.25k Views30.51k Discussing

BTCFlashCrash

59.21k Views66.15k Discussing

View More